TCR analysis reveals significant repertoire
selection during
in vitro
lymphocyte culture
Pierre-Yves Dietrich, Paul R. Walker, Vale´rie Schnuriger, Philippe Saas,
Gae¨lle Perrin, Maryvonne Guillard
1, Catherine Gaudin
2and
Anne Caignard
1Division d’Oncologie, Laboratoire d’Immunologie des Tumeurs, Hoˆpital Universitaire, 1211 Gene`ve 14, Suisse
1INSERM CJF 94-11 and2Unite´ INSERM U333, Institut Gustave Roussy, Villejuif, France
Keywords: glioma, renal cell carcinoma, skewing, TCRβchain, tumor immunology
Abstract
Thein vitro stimulation of T lymphocytes is frequently used as a technique to expand specific cells present at low precursor frequencyin vivo. However, cells analysed after such procedures may no longer reflect those originally presentin vivo because of the variable efficiency of outgrowth of different T cell subpopulations. To systematically assess this and to complement functional assays, we have analysed the TCR repertoire using a new high resolution RT-PCR method to determine TCRβchain CDR3 transcript length. In theex vivo analysis of tumor infiltrating lymphocytes (TIL) of renal cell carcinoma and glioblastoma patients, we observed and quantified oligoclonally expanded populations of T cells that were very susceptible to repertoire modification upon subsequentin vitro culture with autologous tumor cells. This in vitro repertoire skewing occurred preferentially with TIL rather than peripheral blood lymphocytes and we noted that tumor cells rather than normal cells of the same tissue type were the most potent inducers of the effect. It was striking that this selection was sometimes negative: certain prominent T cell populations that were highly representedin vivo disappeared after in vitro re-stimulation. This suggests that the presentation of tumor associated antigens during culture may eliminate rather than enrich for in vivo primed T cells. It is clear that in vitro functional tests cannot adequately describe all T cells with tumor specificity. Approaches that allow the assessment of potentially antigen-reactive T cell populationsex vivo are thus an important advance in the global appraisal of anti-tumor T cell immune responses.
Introduction
T cell recognition of specific antigens restricted by MHC class characterization of tumor-specific T cells (1), but has certain limitations. It probably underestimates the overall anti-tumor I and class II molecules has generally been investigated
using in vitro functional tests such as proliferation, cytotoxicity T cell response because T cells (particularly those infiltrating tumors) may have low proliferative potential (2), impaired or cytokine release. However, such tests rely on (i) the
availability of antigen (or cells expressing the antigen), (ii) a cytolytic function (3) and defects in cytokine production (4) or could possibly be in an anergic state. Furthermore, in frequency of specific T cells appropriate for the sensitivity of
the test and (iii) cells that are functionally competent in vitro. situations where purified antigens are not available (i.e. in most tumors), the tumor cells used for stimulating T cell Such conditions are not always met from T cell populations
isolated ex vivo and in vitro expansion or re-stimulation is cultures may not adequately present the putative antigens due to low or absent MHC expression (5–7), specific antigen thus frequently utilized. In the case of anti-tumor immune
responses, mixed lymphocyte tumor cell culture (MLTC) is loss (8), low antigen density (9,10) or defects in antigen processing (11).
used to expand tumor cell-specific T cells in an in vitro
environment that minimizes the immunosuppressive condi- In order to better assess the overall anti-tumor T cell response, we have taken advantage of a new high-resolution tions that may have been originally present in vivo. This
in vitro approach has sometimes led to the successful RT-PCR method based on the determination of the TCRβchain
Correspondence to: P.-Y. Dietrich
CDR3 transcript length (12,13). This technique is sensitive 105tumor cells in the presence of 106 irradiated LAZ 509 (Epstein–Barr virus-transformed cell line). Two stimulations at enough to detect T cell clonal expansions in vivo, without the
necessity of functional tests and in vitro culture. Recurrent weekly intervals were performed (20- to 50-fold expansion between stimulations). For the second RCC patient, co-identical size transcripts are found after specific T cell clonal
expansion in response to defined antigens (12–14). Their cultures of TIL were performed either with tumor cells or with normal renal cells, using the same conditions described presence in tumor infiltrating lymphocytes (TIL) may thus
reflect the response driven by putative and still undefined above.
T cells derived from glioblastoma were cultured in Iscove’s antigens. Indeed, we demonstrated that in certain cases, the
T cell populations detected in vivo by these molecular methods medium (Gibco/BRL) supplemented with 10% human serum and 30 U/ml rIL-2 to establish the TIL lines. Two re-stimulations could be expanded in vitro and were tumor specific in
cytotoxicity assays (15). were carried out at ~3 week intervals using allogeneic
irradi-ated PBMC and 1µg/ml purified phytohemagglutinin (Murex In this study, we show that some significant clonal
expan-sions detectable in vivo are lost after in vitro culture and that, Diagnostics, Dartford, UK), and then a second MLTC (con-sidering the first 3 days of culture to be the first MLTC) was furthermore, the fate of such populations is dependent upon
the nature of the stimulating cells. Our results suggest that carried out using 105T cells with 104autologous tumor cells (10- to 40-fold expansion between stimulations).
MLTC procedures utilized to expand antigen-specific T cells may instead induce the selective depletion of potentially
Flow cytometry antigen-reactive populations. Previous studies based on ex
vivo phenotypic analysis of antigen-selected cells that express T cell populations and tumor cell lines were analysed on a FACScan equipped with Lysys II software, calibrated by eye distinctive TCR also indicated that functional assays
underesti-mate the real T cell response (16). The present data, mainly (Becton Dickinson, Mountain View, CA). Each mAb was used at a saturating concentration predetermined by titration curves based on the analysis of CDR3 length profiles, demonstrate
that new approaches are necessary to understand the in vivo on positive cloned cell lines. Anti-TCRBV region mAb, JU74.3, E17.5F3, CAS1.1.3, Tamaya 1.2 (Immunotech, Marseille, significance of clonally expanded T cells that are
non-func-tional or deleted in vitro. France) and DE.4 (Institut Gustave Roussy, Villejuif, France)
are directed against TCRBV13S6, BV17, BV14, BV16 and BV13S3 respectively. OKT3 (Ortho Diagnostics, Westwood, Methods MA) reacts with the CD3 antigen; anti-NKTa mAb, recognizing an infrequent TCR αβ determinant (17), was used as a Isolation and culture of tumor cells
negative control. W6/32 (ATCC, Rockville, MD; HB95) and Long-term tumor cell lines were established from renal cell L243 (ATCC; HB55) recognize monomorphic determinants of carcinoma (RCC) and glioblastoma patients. Tumor biopsies HLA class I and class II gene products respectively. Staining were processed immediately after removal at surgery to obtain was revealed with a FITC-conjugated goat anti-mouse Ig single-cell suspensions using enzymatic digestion. Briefly, (Immunotech). All analyses were performed after gating on tissue was enzymatically digested for 1–2 h at 37°C in culture viable lymphocyte populations using a combination of forward medium containing 0.1% collagenase type IA, 0.002% DNase and side light scatter (linear amplification).
type II and either 0.001% hyaluronidase (for RCC) or 0.05%
TCRBV gene segment usage protease type I (for glioblastoma). The resulting cell
suspen-sions were centrifuged over a Ficoll-Hypaque gradient (Phar- TCRBV gene segment usage was determined by RT-PCR as macia, Uppsala, Sweden) and then cultured in DMEM medium previously described (18). Briefly, total RNA was prepared containing 10% FCS. All enzymes were obtained from Sigma from tumor, lymph nodes, PBL and MLTC (0.2–0.5 g tissue (St Louis, MO) and media were from Gibco/BRL (Life Technolo- or 2–53106 cells) using TRIzol (Gibco/BRL) and converted gies, Paisley, UK). From one RCC patient, a normal kidney to cDNA by standard methods using reverse transcriptase cell line that expanded for five passages was also obtained and an oligo d(T) primer. These cDNAs were amplified in
using the same techniques. non-saturating PCR conditions with a panel of experimentally
validated 59 sense primers specific for the 24 BV subfamilies Isolation and culture of T cells and one 39 antisense primer for the BC gene segment. The specificity of the amplified products was assessed after T cells were either obtained from digested tumor tissue as
described above (i.e. TIL), from tumor draining lymph node Southern blotting and hybridization with a labelled BC oligonu-cleotide, and also by verifying the length of the PCR products (TLN) which was also digested in the same way or from
peripheral blood lymphocytes (PBL) obtained after Ficoll- with values deduced from the BV1–24 and BC primer posi-tions. The comparative analysis of each BV product between Hypaque centrifugation. For glioblastoma, non-adherent cells
were taken from the tumor cell cultures described above after the different samples was achieved by densitometric analysis of the signals on the autoradiographs.
3 days of culture.
For RCC patients, TIL and cells from TLN were expanded
CDR3 size analysis of TCRBV transcripts for 6 days prior to MLTC in RPMI 1640 with 10% human
serum, 10 U/ml rIL-2 and 3% conditioned medium from The CDR3 region of the PCR-amplified TCRBV1–24 transcripts was analysed using a run-off procedure, as previously phytohemagglutinin-activated lymphocytes. PBL were not
expanded before MLTC. In MLTC for the first patient, 3–53105 described (12,13). Briefly, aliquots (2µl) of the BV1–24/BC PCR products (40 cycles) were subjected to one to three T cells (from TIL, TLN and PBL respectively) were mixed with
cycle run-off reactions, using dye-labelled oligonucleotide primers, specific either for BC or one of the 13 human functional BJ segments. The run-off products were then run on an automated sequencer in the presence of fluorescent size markers. The length of the DNA fragments and the fluorescence intensity of the bands were analysed with Immu-noscope software (developed by C. Pannetier) or Genescan Analysis software (Applied Biosystems, Forster City, CA). Sequencing of PCR products
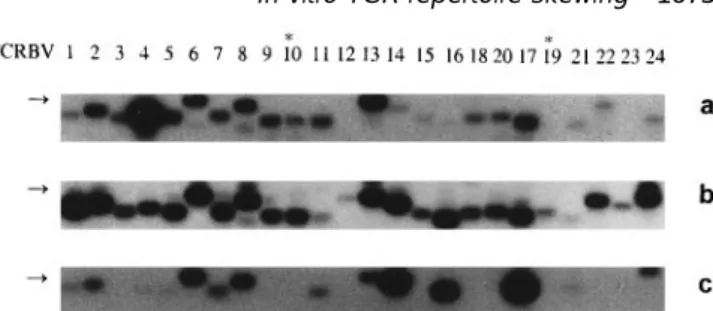
Fig. 1. Southern blot analysis of RT-PCR amplified TCRBV gene TCRBV13–BC PCR products derived from glioblastoma segments from TIL ex vivo (a), after 6 days culture with IL-2 (b) and samples were cloned into PBS-SK1 vector (Stratagene, La after the second MLTC at day 20 (c) in RCC patient 1. The DNA fragments (0.25–0.5 kb) amplified by each BV–BC pair were hybridized Jolla, Ca). Competent XL-1 blue Escherichia coli (Stratagene)
with a BC oligonucleotide probe.PCR reactions were performed with were transformed and plated for blue/white colour selection
the panel of primers described in (18) and results are presented on media containing X-gal. Plasmid DNA was extracted from according to the new nomenclature (55). Asterisks denote white colonies using the Qiagen Plasmid Mini Kit (Qiagen, pseudogenes. Arrows indicate the 0.5 kb DNA marker position. Hilden, Germany) and sequenced using the Dye Terminator
Cycle Sequencing Kit (ABI PRISM; Perkin Elmer, Forster City, CA) according to the manufacturer’s instructions.
samples (RNA directly analysed ex vivo), and compared Quantification of clonal expansions in glioblastoma samples these to the corresponding T cells after various periods of
in vitro culture. To quantify the respective proportions of recurrent BV13
transcripts in the total BV13 mRNAs (Fig. 6), clonotypic
TCR repertoire of TIL analysed ex vivo is dramatically altered primers hybridizing with the CDR3 region of the recurrent
after in vitro culture with autologous tumor cells BV13 sequences from TIL ex vivo or after MLTC were
synthe-sized and labelled with a 6-Fam fluorophore (GENSET, Paris, TIL, TLN and PBL from RCC patient 1 were stimulated twice at weekly intervals using autologous tumor cells. Using RT-France). Primer sequences were 5
9-AGCTCCCCGGTGT-TCGGGAGT-39 for the recurrent cDNA clone detected in TIL PCR, we analysed the BV gene usage in MLTC-derived T cell lines and compared it to that observed ex vivo from tumor, ex vivo (CDR3-ex vivo primer) and 5
9-CTGCTCATTGTAA-GTCCTCCA-39 for the recurrent cDNA clone detected in TIL TLN or PBL. The amplified material was revealed by autoradio-graphy. Results for TIL analysed ex vivo, after 6 days in after MLTC (CDR3-in vitro primer). Samples were amplified
using a BV13 and a BC primer, then aliquots of BV13–BC culture with low-dose IL-2 alone or after MLTC are shown in Fig. 1. Each TCRBV gene product was obtained with the PCR products were subjected to an elongation with either a
6-Fam-labelled and nested BC primer (13) or with one of the expected size (deduced from the positions of the TCRBV and TCRBC primers on cDNA sequence), varying from 250 to 535 two clonotypic primers. The two run-off products were loaded
in equal amounts in the automated sequencer. The proportion bp. Autoradiographs were analysed by densitometry which allows the comparison of the usage of a given BV gene in of the specific sequence in the total BV13 mRNA population
was then calculated by dividing the area under the curve the different samples, since the same primer pair was used in the PCR reactions (Fig. 2). The repertoire of T cells from (AUC) obtained with the clonotypic primers by the sum of the
AUC obtained with the BC primer. This calculated ratio was uncultured PBL and TLN was diverse with almost all BV genes expressed, whilst T cells present within tumor displayed a then corrected by the relative specific activity of the clonotypic
primers (see legend of Fig. 6). With the exception of sequen- restricted BV gene usage, with particularly abundant BV4 transcripts. In addition, the repertoire of PBL and TLN was cing, all molecular experiments were performed at least twice,
with highly reproducible results. not significantly modified by co-culture with autologous tumor
cells. Indeed, the variation of the relative expression of any of the BV gene segments did not exceed the mean value Results 6 1 SD (20). In contrast, the same in vitro procedure induced major modifications of the BV gene usage in cultured TIL In previously published studies (15,19), the in vivo repertoire
in RCC and the representation of a specific cytotoxic T when compared with the ex vivo TIL repertoire, with a major increase in BV14, BV16 and BV17 expression, and a dramatic lymphocyte (CTL) clone was analysed. Here, we extend these
studies, to more globally and systematically analyse T cell decrease in BV4 expression (Figs 1 and 2).
We also used TCRBV-specific mAb and flow cytometric ana-repertoires in vivo and after in vitro culture. In particular we
wished to address whether commonly used in vitro culture lysis to confirm the results of the molecular analysis, and observed similar striking differences between the different techniques always achieve the usual aim of expanding in vivo
primed T cells. To circumvent the problem of non-detection co-cultures. In TIL after MLTC (comprising 92% CD31cells), 45, 32 and 7% of lymphocytes were labelled with mAb to of T cells without function in in vitro tests (or of cells that
showed no further expansion in vitro), we used sensitive BV14, BV17 and BV16 respectively, whereas BV13 (mAb BV13S31 BV13S6) T cells constituted ,1.5% of the cells RT-PCR based methods of the TCR repertoire to analyse
oligoclonal expansions of T cells. We have analysed blood (Fig. 3). In contrast, none of these BV-specific mAb labelled .6% TLN lymphocytes in MLTC (data not shown). These (after Ficoll-Hypaque isolation) and unmanipulated tissue
by run-off analysis of RCC samples (Fig. 4). BV–BC products were copied with a nested fluorescent BC and the sizes of the fluorescent run-off products were determined by electrophor-esis on an automated DNA sequencer. Size variations of the run-off products are strictly due to different CDR3 lengths reflecting the imprecise V–D–J joining mechanism. In PBL of healthy donors, the repertoire of any BV–BC and BV–BJ com-bination usually displays a bell-shaped profile with 3-nucleot-ide-spaced peaks corresponding to in-frame sequences (13,21). In contrast, the emergence of one dominant peak reveals the presence of cDNAs with identical or same size in frame junctional regions.
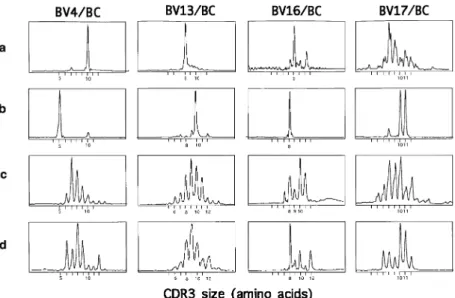
Several observations can be made from these data. Some dominant peaks observed ex vivo disappeared or were signi-ficantly diminished after in vitro culture (Fig. 4). The BV4 tran-scripts, highly expressed in the ex vivo sample, contained one major peak corresponding to a CDR3 size of 10 amino acids (Fig. 4a). After MLTC (Fig. 4b), TIL BV4 transcripts contained a prominent peak not detected ex vivo (CDR3 size of 5 amino acids) and a weaker peak (CDR3 size of 10 amino acids) matching the main peak detected ex vivo. These data support the view of a counterselection of an in vivo expanded T cell population (with a 10 amino acid CDR3 size) during in vitro culture. Similarly, the intense peak (consistent with the expan-sion of T cells bearing a CDR3 of 8 amino acids) observed ex vivo in BV13 was not detectable after MLTC, whereas a peak corresponding to T cells with a 10 amino acid CDR3 size clearly emerged. The shift in the principal BV16 peaks (9 amino acids in ex vivo TIL sample versus 8 amino acids after MLTC) is an additional example (Fig. 4).
However, MLTC is clearly useful in some cases to facilitate the in vitro outgrowth of T cell populations that are detectable in ex vivo samples, but which do not represent major peaks. For example, BV171T cells with CDR3 sizes of 10 or 11 amino acids that were present in the ex vivo tumor sample (but were not the predominant peaks) became the major populations after MLTC (Fig. 4). Furthermore, we have previously reported that one of these two peaks corresponded to a tumor cell-specific CTL clone obtained after direct cloning of TIL [(15),
Fig. 2.Comparison of relative TCRBV gene segment expression in
samples analysed ex vivo or after two rounds of MLTC in RCC patient but referred to as TCRBV19 in this previous report according 1. Tumor (a), TLN (b) and PBL (c) samples were analysed ex vivo (solid to old nomenclature]. Indeed, this same clone was also found bars) or after MLTC (hatched bars). For each sample, the
to account for the peak corresponding to the CDR3 of 10 amino autoradiographic spots obtained by Southern blot of PCR amplified
acids in TLN after MLTC (Fig. 4d). TCRBV gene segments (e.g. those obtained in Fig. 1) were analysed
by densitometry and each BV signal was expressed as a percentage In contrast to the significant selection observed in TIL after of the sum of all BV spots. Pseudogenes (BV10 and BV19) were not MLTC, the majority of BV–BC PCR products from PBL after considered for this calculation. Values obtained for uncultured tumor,
MLTC conserved a bell-shaped pattern consistent with poly-PBL and TLN have been previously reported (19). They are reproduced
clonality (Fig. 4c), i.e. the same profile previously reported in here to facilitate the comparison of patterns obtained before and after
uncultured PBL of RCC patients (19), possibly reflecting the MLTC.
lower frequency of tumor-specific T cells among PBL compared with TIL. The situation with TLN (Fig. 4d) was intermediate between that of PBL and TIL, with some polyclonal patterns conserved (e.g. BV4), but certain prominent peaks showing phenotypic data support the conclusion from the molecular
analysis, i.e. there are high proportions of BV14, BV16 and significant in vitro selection (e.g. BV17). BV17 T cells after in vitro stimulation with autologous tumor cells.
In vitro skewing occurs after culture of T cells infiltrating different tumor types
Oligoclonal TIL and TLN populations are subject to greater
in vitro selective pressure than PBL To see whether skewing phenomena were restricted to RCC, the TCR repertoire of T cells from human glioblastoma was also To assess the putative clonality of expanded T cells subsets in
TIL after MLTC and their representation in vivo, we examined investigated. The BV gene segment usage of TIL after MLTC (10 days after the last addition of tumor cells and 50 days after the CDR3 size distribution of the corresponding BV transcripts
Fig. 3.Major expansion of certain TCRBV-expressing subsets in TIL after MLTC (RCC patient 1). Cells were stained with mAb to TCRBV14 (a), BV17 (b), BV16 (c), and BV13S3 and BV13S6 (d), and were analysed by flow cytometry. Histograms represent the relative number of cells versus intensity of fluorescence on a log10scale.
Fig. 4.Dramatic modifications in the CDR3 size distribution patterns of tumor BV–BC run-off products after MLTC (RCC patient 1). Total RNA from tumor sample ex vivo (a) or from MLTC T cell lines derived from TIL (b), PBL (c) and TLN (d) was reverse transcribed and amplified by PCR with BV and BC primers. Amplified cDNA was copied by a fluorescent BC primer in a run-off reaction and subjected to electrophoresis on an automated sequencer. The patterns obtained show the size and intensity distribution of in frame BV–BC amplification products. Horizontal axis: size in amino acids of the CDR3 region as defined in (56) and deduced from the fragment size. Vertical axis: fluorescence intensity, in arbitrary units. BV4–BC, BV13–BC and BV17–BC run-off products from the tumor sample ex vivo, and BV17–BC run-off products from the after MLTC sample have been previously reported [(19), but referred to as BV19 in this previous report according to old nomenclature]. They are reproduced here to facilitate the comparison of patterns obtained in the different samples.
the beginning of culture) was studied and compared with that compared with PBL (22 and Dietrich et al., manuscript in pre-paration). In the glioblastoma patient analysed here (Fig. 5), the observed in T cells ex vivo (tumor biopsy and PBL RNA:
Fig. 5). Here again, some BV specificities highly expressed in relative expression of TCRBV13 transcripts was significantly higher in TIL ex vivo than in PBL. After subsequent in vitro culture TIL ex vivo disappeared after in vitro co-culture with autologous
tumor cells (e.g. BV4, BV5, BV6 and BV15). In contrast, some of TIL, the TCRBV13 was the most abundantly expressed BV. Indeed, we confirmed the representation of BV131cells in the BV specificities such as BV12 and BV16 poorly represented in
the ex vivo sample gave rise to significant proportions of the T cultured TIL by flow cytometry, which revealed.70% of total T cells reacting with mAb specific for BV13S1 and BV13S2 (data cell repertoire after in vitro culture. A further category can be
considered: BV families that were highly represented when not shown). We therefore assessed whether the BV13 T cells expanding after in vitro stimulation with autologous glioma cells analysed ex vivo showing further expansion in vitro (e.g. BV13
and BV14). Of these subsets, BV131T cells are of particular were the same as those overexpressed in vivo.
The run-off procedure was used to define the CDR3 size interest, since this BV is frequently overexpressed in glioma
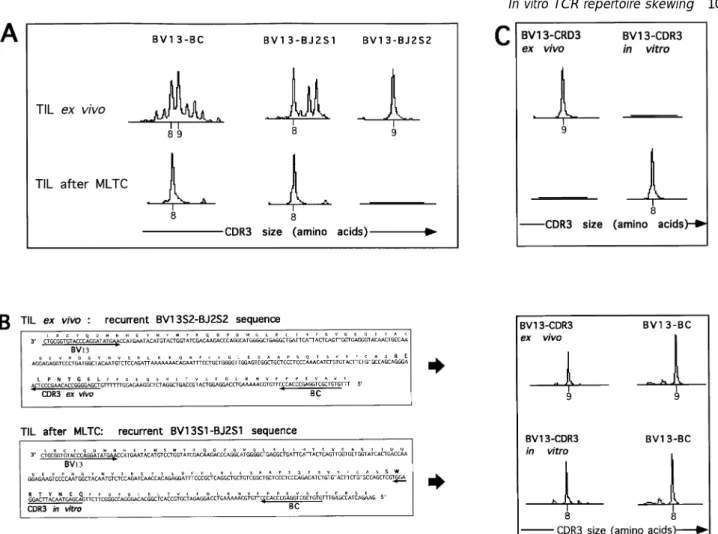
Fig. 6(A). Clonotypic primers specific for the CDR3 region of both recurrent sequences were synthesized (CDR3-ex vivo and CDR3-in vitro primers: Fig. 6B). To determine the proportion of the BV13S2–BJ2S2 and BV13S1–BJ2S1 clones in the total BV13 population present in TIL ex vivo or in TIL after MLTC, the BV13–BC PCR products were copied with the labelled BC primer, the CDR3-ex vivo primer or the CDR3-in vitro primer and their CDR3 size distribution was analysed in the automated sequencer. The BV13S2–BJ2S2 clone represented 25% of the total BV13 mRNAs in the ex vivo sample (after correcting for the specific activity of the CDR3-ex vivo primer), but was unde-tectable in TIL after MLTC (Fig. 6C). Thus, this highly expanded clone that we estimate to represent ~4% of total T cells ex vivo (Figs 5 and 6) was eliminated in culture. On the other hand, the BV13S1–BJ2S1 clone remained undetectable in the ex vivo sample, whereas it was highly expressed in TIL after MLTC, representing 85% of the BV13 transcripts. Therefore, since the
Fig. 5.Comparison of relative TCRBV gene segment expression in
T cell line obtained after MLTC was comprised of 73% BV13S11 samples analysed ex vivo or after MLTC (day 50 after tumor
T cells (assessed by flow cytometry: data not shown), it can be dissociation) in a case of glioblastoma. For each indicated sample, the
autoradiographic spots obtained by Southern blot of PCR amplified estimated that this BV13S1–BJ2S1 clone represents a minimum TCRBV gene segments were analysed by densitometry and each BV of 62% of the T cell line. These data clearly demonstrate that signal was expressed as a percentage of the sum of all BV spots.
the major in vitro expansion of T cells bearing a TCRBV13S1– BJ2S1 chain with a CDR3 of 8 amino acids derives from a population with minor representation in vivo [probably ,1 in 105T cells (21)].
profiles and the BJ usage of the BV13 population analysed ex vivo and after in vitro culture with autologous tumor cells
In vitro skewing is most pronounced when tumor cells rather (Fig. 6A). At a first level of analysis using the fluorescent BC
than normal cells of the same lineage are used for in vitro primer, we observed that the BV13–BC PCR products from the
stimulation ex vivo tumor sample displayed a nearly bell-shaped pattern
with, however, two slightly prominent peaks corresponding to Whilst TIL (rather than PBL) from different tumors were clearly susceptible to in vitro skewing, we wanted to determine if this T cells bearingβchains with CDR3 sizes of 8 and 9 amino acids
respectively. In the cultured TIL, a single peak (CDR3 of 8 amino was an intrinsic property of TIL in culture or whether different stimulator cells influenced this selection to a greater or lesser acids) was highly predominant. To further characterize the
BV13 transcripts with the same size CDR3 (8 amino acids), extent. We therefore compared the CDR3 profiles in three differ-ent cultures from another RCC patidiffer-ent: TIL cultured in the pres-BV13–BC PCR products were copied with the 13 BJ primers.
Each BV13–BJ profile of the tumor sample analysed ex vivo ence of IL-2 (Fig. 7a), TIL stimulated by autologous tumor cells (Fig. 7b) and TIL stimulated by autologous normal kidney displayed several peaks corresponding to transcripts of
differ-ent CDR3 sizes, often with an fluorescence intensity close to cells (Fig. 7c). The representative profiles of BV–BC PCR prod-ucts shown in Fig. 7 indicate that the co-culture of TIL with tumor background levels (data not shown). The single exception was
the BV13–BJ2S2 profile where an intense and prominent peak cells induced a major restriction of the number of T cell clones within a given BV specificity, whilst no obvious difference was corresponding to a CDR3 size of 9 amino acids was noted. In
contrast, no BV13–BJ2S2 amplified transcript was detected in observed following co-culture with normal kidney cells. These results are consistent with tumor cell-specific signals to in vivo TIL after MLTC, but a significant peak (CDR3 size at 8 amino
acids) was seen in the BV13–BJ2S1 profile. Therefore, despite primed TIL that can act either in a positive (in vitro selection and growth) or a negative (inhibition of growth) manner. Unlike overexpression of BV13 T cells both in vivo and after in vitro
culture, analysis of CDR3 size shows that the prominent BV13– some tumor cell lines that are low or negative for MHC expres-sion, the three tumor cell lines used for this study are MHC class BJ2S2 T cell population detected in the ex vivo sample did not
expand in vitro, whereas the BV13–BJ2S1 T cells proliferating I1(Fig. 8) and thus may potentially present antigens to class I-restricted CD8 T cells. Since MHC class II is not constitutively in vitro probably derive from minor in vivo populations.
expressed (Fig. 8), the repertoire selection could thus be more Quantification of individual clones ex vivo and after MLTC pronounced for the CD81T. However, we cannot exclude that cytokines secreted in the culture microenvironment may lead To quantify the extent of in vitro skewing, random sequencing
of BV13–BC PCR products was used, leading to the identifica- to the transient expression of MHC class II molecules, since class II expression was inducible by IFN-γon the three cell lines tion of BV13 clones that were highly represented either in TIL ex
vivo or in TIL after MLTC. A recurrent BV13S2–BJ2S2 sequence (data not shown). (four of eight sequences) with a CDR3 size of 9 amino acids
was found in the ex vivo sample and a different recurrent
Discussion BV13S1–BJ2S1 sequence (nine of 11 sequences) with a CDR3
size of 8 amino acids was found in TIL after MLTC (Fig. 6B). Whilst high efficiency culture of normal human T cell popula-tions (e.g. from PBL) is possible (23), the general experience These data are consistent with the CDR3 profiles shown in
Fig. 6.Effect of MLTC on the representation of individual T cell clones in glioblastoma. (A) CDR3 size distribution patterns of BV13–BC, BV13– BJ2S1 and BV13–BJ2S2 run-off products from TIL analysed ex vivo or after MLTC. Amplified cDNA was copied by a fluorescent BC or BJ primer in a run-off reaction and subjected to electrophoresis on an automated sequencer. The patterns obtained show the size and intensity distribution of in-frame BV–BC or BV–BJ amplification products. Horizontal axis: size in amino acids of the CDR3 region. Vertical axis: fluorescence intensity, in arbitrary units. (B) Recurrent sequences found in TIL ex vivo (BV13S2–BJ2S2) or after MLTC (BV13S1–BJ2S1). BV13–BC PCR products from both samples were cloned into PBS-SK1vector and sequenced (see Methods). CDR3 sequences are in bold. The positions of primers (BV13, BC, as well as clonotypic primers CDR3-ex vivo and CDR3-in vitro) used for subsequent PCR are indicated on plasmid sequences. Plasmid DNAs were amplified using a BV13 and a BC primer. Equal amounts of the BV13–BC PCR products were elongated either with the BC primer or the clonotypic primer and their CDR3 size was analysed on an automated sequencer. The relative specific activities of clonotypic primers were then calculated by dividing the AUC obtained with the clonotypic primer by the AUC obtained with the BC primer (0.73 for CDR3-ex vivo and 0.78 for CDR3-in vitro). (C) Identification of the recurrent sequences in TIL ex vivo or after MLTC using the two clonotypic primers.
with T cells derived from cancer patients is of a much reduced during culture. These results are thus not only descriptive of specific T cell populations, but are also predictive of TCR with clonogenic potential, particularly from TIL (2,24). Is this just
because there is global immunosuppression affecting all T cells potential antigen reactivity. Such predictions may therefore be exploitable for the subsequent isolation of T cell populations or are more specific inhibitory interactions in operation? This
is an extremely difficult question to answer using traditional enriched for antigen specificity, as demonstrated in a case of chronic lymphocytic leukaemia (25). These approaches may techniques to assess immune function and specificity, since
only those cells that actually expand in vitro are testable. In an be further refined by selecting subsets defined by other pheno-typic markers (16).
attempt to partially circumvent this technical limitation and to
thus better define the overall anti-tumor immune response, we Several features emerge from the present study. When lymphocyte populations were first analysed ex vivo, we have exploited the high resolution properties of the analysis of
CDR3 transcript length within ex vivo and in vitro populations observed a higher representation of oligoclonal T cell popula-tions in TIL and to a lesser extent in TLN (i.e. those compart-defined for both BV and BJ usage (13). This technique
gener-ates data that reveal highly distinctive profiles corresponding ments in closest proximity to the tumor) compared with blood. However, the major finding of this study is that in vitro culture to either polyclonal or oligoclonal T cell expansions. This has
enabled us to identify T cell populations that were probably dramatically skews the representation of different T cell popula-tions compared with their starting proporpopula-tions. Whilst this was selected by antigen in vivo and to follow their fate systematically
a role of tumor-associated antigenic stimulation in this skewing, causing either in vitro expansion or elimination of T cells that were presumably primed in vivo. In our quantitative analysis we showed that MLTC can substantially expand clones poorly represented in vivo, which for one clone we estimated to be a 62,000-fold enrichment. Conversely, a major clone that we estimated to represent 4% of TIL in vivo disappeared after MLTC (Fig. 6). If the loss of oligoclonally expanded T cell populations is a specific effect, these eliminated populations warrant as much attention as T cell populations that actually proliferate in culture. The ex vivo identification of T cell populations that sub-sequently exhibit highly diverse growth patterns during culture raises questions about their functional status at the outset. The cells that do expand in vitro are presumably in a primed state,
Fig. 7.Repertoire comparison for selected BV of TIL cultured in the
responsive to the exogeneously supplied cytokines, particu-presence or absence of different stimulator cells (RCC patient 2). CDR3
size distribution profiles are shown for BV–BC run-off products of TIL larly after re-stimulation by tumor cells. These populations are cultured without addition of stimulator cells (a), with autologous tumor naturally the easiest to test for function and specificity, e.g. cells (b) or autologous normal renal cells (c). Horizontal axis: size in
the BV171cells that we discuss in this report that have been amino acids of the CDR3 region. Vertical axis: fluorescence intensity,
previously shown to specifically lyse RCC tumor cells [(15), but in arbitrary units.
referred to as BV19 in this previous report according to old nomenclature]. In a case of a regressive melanoma, there is evidence that in vitro growth patterns may also depend upon T cell interactions. The growth of one CTL clone (BV13) with specific anti-tumor activity was achieved after MLTC, whereas another clone (BV16) with a higher representation in vivo could be cultured only after sorting, rather than as a bulk T cell line (26,27). Utilization of BV specific mAb for sorting is not always feasible since many specificities are not available and, further-more, crude BV usage may not always provide sufficient enrich-ment for specific cells, as shown with our more refined analyses based on CDR3 size. However, it is clear that expression of an appropriate receptor for antigen recognition and in vitro growth are not sufficient conditions to ensure specific effector function. This may be due to selective defects in cytokine production (4) or impaired cytolytic function (3). Thus, we cannot exclude that, for example, the BV141expanded T cells from RCC TIL (Figs 1–4) may be antigen specific, despite lack of specific cytolytic properties (15). Diminished or incomplete effector functions may be a consequence of immunosuppressive cytokine secre-tion in the tumor microenvironment, such as transforming growth factor-βor IL-10 (28–34), or by the expression of FasL on the tumor cell surface (35–38). Alternatively, inadequate
Fig. 8.RCC and glioblastoma cell lines constitutively express MHC expression of co-stimulatory molecules by tumor cells used for class I molecules, but not class II. Cells were stained either with mAb
stimulation may lead to only partial T cell activation (39–41). A to monomorphic determinants of HLA class I (W6/32) and class II (L243)
further hypothetical possibility is that the tumor cells present molecules (filled curves) or an isotype-matched control mAb (open
modified antigenic peptides that still engage the same TCR but curves) and were analysed by flow cytometry. Upper histograms: RCC
patient 1 cell line; middle histograms: RCC patient 2 cell line; lower that elicit qualitatively different T cell responses (42–45). Such histograms: glioblastoma cell line. Histograms represent the relative mechanisms would be consistent with the oligoclonal T cell number of cells versus intensity of fluorescence on a log10scale. expansions observed ex vivo in RCC (19) and glioblastoma (22), and also in other malignancies (25,46), but the lack of spontaneous tumor rejection in most cases.
It is clear from some experiments that certain T cells poorly partly anticipated (since the principal objective of in vitro
stimu-lation is to enrich for antigen specific cells), TCR analysis represented in vivo strongly expand in vitro. This may reflect the growth of tumor antigen-specific cells now able to proliferate revealed that this in vitro selection was far from uniform. In
particular, it was the highly oligoclonal TIL that were the most in the absence of the immunosuppressive conditions that were present in vivo: these cultures therefore achieve one of the susceptible to repertoire modifications in vitro, especially after
culture with tumor rather than normal cell lines. Indeed, the principal goals of MLTC. Indeed, the in vitro expansion of CTL precursor cells has successfully led to the identification of the tumor cell lines studied here all expressed MHC molecules
(constitutive for class I, inducible for class II), and thus are majority of tumor-associated antigens characterized to date. However, caution must be exercised in interpreting in vitro potential antigen-presenting cells (APC). This is consistent with
secretarial assistance of Melissa Morawitz. We thank the editors of defined T cell specificities. Cultured tumor cells used for in vitro
Cancer Research for permission to reproduce certain CDR3 profiles stimulation do not necessarily reflect the majority of those
pre-previously published. sent in vivo and the hierarchy of antigenic peptides presented
may be altered. It is also possible that totally new epitopes are
expressed by outgrowth of tumor variants or indeed may be Abbreviations derived from proteins used in culture (e.g. bovine serum).
How-APC antigen-presenting cell ever, these possibilities assume either cross-stimulation of T
AUC area under the curve
cells previously activated in vivo by other peptides or in vitro CDR complementarity determining region priming. This latter possibility is only likely to be achieved by CTL cytotoxic T lymphocyte
MLTC mixed lymphocyte tumor cell culture very specific culture conditions, such as stimulation with
pep-PBL peripheral blood lymphocyte tides with high affinity to MHC class I (47), high peptide density
PBMC peripheral blood mononuclear cell (10), B7 expression (48) or particular cytokine cocktails (49,50).
RCC renal cell carcinoma Finally, mitogens may activate irrelevant bystander T cells, but TIL tumor infiltrating lymphocyte this would not explain the selective skewing observed in TIL TLN tumor draining lymph node subjected to tumor cell co-culture, unless previously
antigen-primed cells are differentially responsive to mitogenic
stimu-References lation.
The final category of T cells is perhaps the most tantalizing: 1 Boon, T. and Van der Bruggen, P. 1996. Human tumor antigens the prominent oligoclonally expanded populations detected ex recognized by T lymphocytes. J. Exp. Med. 183:725.
2 Alexander, J., Kudoh, S., Melsop, K., Hamilton, T., Edinger, M., vivo that are eliminated or not detectable after in vitro culture.
Tubbs, R. R., Sica, D., Tuason, L., Klein, E., Bukowski, R. and These cells are thus totally invisible to any immunological test
Finke, J. 1993. T-cells infiltrating renal cell carcinoma display a poor carried out on cultured T cells. They may be specifically deleted proliferative response even though they can produce interleukin 2 by tumor cell contact in vitro which could be the in vitro correlate and express interleukin 2 receptors. Cancer Res. 53:1380.
3 Maeurer, M. J., Martin, D., Elder, E., Storkus, W. J. and Lotze, M. of specific immunosuppression by tumor cells in vivo. It may
T. 1996. Detection of naturally processed and HLA-A1-presented therefore be fruitful to target in situ analyses on the T cell
popula-melanoma T-cell epitopes defined by CD81T-cells’ release of tions that disappear in vitro to search for cells in the process of
granulocyte-macrophage colony-stimulating factor but not by being eliminated, e.g. cells undergoing apoptosis. cytolysis. Clin. Cancer Res. 2:87.
In conclusion, in vitro tests of T cell function and specificity 4 Guilloux, Y., Viret, C., Gervois, N., Le Drean, E., Pandolfino, M. C., Diez, E. and Jotereau, F. 1994. Defective lymphokine production are useful indicators of immune responses when positive
by most CD81and CD41tumor-specific T cell clones derived from results are obtained, but are clearly insufficient to quantitatively
human melanoma-infiltrating lymphocytes in response to or qualitatively describe the in vivo immune response. The autologous tumor cells in vitro. Eur. J. Immunol. 24:1966.
underestimation of T cell involvement in immune responses 5 Maudsley, D. J. and Pound, J. D. 1991. Modulation of MHC antigen expression by viruses and oncogenes. Immunol. Today 12:429. when assessed by cytotoxicity assays alone has been
sug-6 Dhib-Jalbut, S., Kufta, C. V., Flerlage, M., Shimojo, N. and gested in independent studies using different approaches. In
McFarland, H. F. 1990. Adult human glial cells can present target a class I-restricted response to a defined peptide antigen, in
antigens to HLA-restricted cytotoxic T-cells. J. Neuroimmunol. which cells bearing specific TCR could be identified pheno- 29:203.
typically ex vivo, very high proportions (up to 80%) of potentially 7 Luboldt, H. J., Kubens, B. S., Ru¨bben, H. and Grosse-Wilde, H. 1996. Selective loss of human leukocyte antigen class I allele antigen-reactive T cells were detected in certain subsets (16).
expression in advanced renal cell carcinoma. Cancer Res. 56:826. This was in contrast to other murine studies in which CTLp
8 Boon, T., Cerottini, J. C., Van den Eynde, B., Van der Bruggen, P. frequencies determined by classical limiting dilution analysis and Van Pel, A. 1994. Tumor antigens recognized by T lymphocytes. rarely exceeded 1–2% of a defined CD8 subset (51–53). More- Annu. Rev. Immunol. 12:337.
9 Harding, C. V. and Unanue, E. R. 1990. Quantitation of antigen-over, in human clinical studies, totally negative in vitro tests of
presenting cell MHC class II/peptide complexes necessary for T-CTL function were obtained from HLA-A11melanoma patients
cell stimulation. Nature 346:574. immunized with the well-characterized HLA-A1 binding
MAGE-10 Mottez, E., Langlade-Demoyen, P., Gournier, H., Martinon, F., 3 peptide, despite tumor regression in certain patients (54). Maryanski, J., Kourilsky, P. and Abastado, J. P. 1995. Cells The potential range of T cell effector functions is not fully expressing a major histocompatibility complex class I molecule with a single covalently bound peptide are highly immunogenic. J. understood in either its diversity or its regulation. Furthermore,
Exp. Med. 181:493. it is clear that effector function is not expressed in a stable or
11 Restifo, N. P., Esquivel, F., Kawakami, Y., Yewdell, J. W., Mule, J. J., irreversible manner. The most stable and conserved parameter Rosenberg, S. A. and Bennink J. R. 1993. Identification of human in specific antigen recognition is the expression of the TCR, we cancers deficient in antigen processing. J. Exp. Med. 177:265.
12 Cochet, M., Pannetier, C., Regnault, A., Darche, S., Leclerc, C. and thus suggest that assessing TCR usage will be an essential
Kourilsky, P. 1992. Molecular detection and in vivo analysis of the component in globally describing an immune response.
specific T cell response to a protein antigen. Eur. J. Immunol. 22:2639.
13 Pannetier, C., Even, J. and Kourilsky, P. 1995. T-cell repertoire Acknowledgements
diversity and clonal expansions in normal and clinical samples. Immunol. Today 16:176.
This work was supported by the Swiss National Foundation (no.
31-40704.94), la Ligue Genevoise contre le Cancer (P. R. W.), la Fondation 14 Levraud, J. P., Pannetier, C., Langlade-Demoyen, P., Brichard, V. and Kourilsky, P. 1996. Recurrent T cell receptor rearrangements de France (P. S.), and les Fondations Terwindt, MEDIC and Spinola. We
would like to thank Catherine Metral for her expert technical help, in the cytotoxic T lymphocyte response in vivo against the P815 murine tumor. J. Exp. Med. 183:439.
Christophe Pannetier for helpful comments, and Pierre Alberto for
Dietrich, P. Y. 1996. In situ demonstration of renal cell carcinoma expression and selective expression of IL-10 mRNA in human renal cell carcinoma. Int. J. Cancer 63:366.
specific T-cell clones. Int. J. Cancer 66:564.
16 Walker, P. R., Ohteki, T., Lopez, J. A., MacDonald, H. R. and 33 Wang, Q., Redovan, C., Tubbs, R., Olencki, T., Klein, E., Kudoh, S., Finke, J. and Bukowski, R. M. 1995. Selective cytokine gene Maryanski, J. L. 1995. Distinct phenotypes of antigen-selected CD8
T cells emerge at different stages of an in vivo immune response. expression in renal cell carcinoma tumor cells and tumor-infiltrating lymphocytes. Int. J. Cancer 61:780.
J. Immunol. 155:3443.
17 Hercend, T., Reinherz, E. L., Meuer, S., Schlossman, S. F. and Ritz, 34 Maeurer, M. J., Martin, D. M., Castelli, C., Elder, E., Leder, G., Storkus, W. J. and Lotze, M. T. 1995. Host immune response in renal J. 1983. Phenotypic and functional heterogeneity of human cloned
natural killer cell lines. Nature 301:158. cell cancer: interleukin-4 (IL-4) and IL-10 mRNA are frequently detected in freshly collected tumor-infiltrating lymphocytes. Cancer 18 Genevee, C., Diu, A., Nierat, J., Caignard, A., Dietrich, P. Y.,
Ferradini, L., Roman-Roman, S., Triebel, F. and Hercend, T. 1992. Immunol. Immunother. 41:111.
35 Hahne, M., Rimoldi, D., Schro¨ter, M., Romero, P., Schreier, M., An experimentally validated panel of subfamily-specific
oligonucleotide primers (V alpha 1-w29/V beta 1-w24) for the study French, L., Schneider, P., Bornand, T., Fontana, A., Lienard, D., Cerottini, J.-C. and Tschopp, J. 1996. Melanoma cell expression of of human T cell receptor variable V gene segment usage by
polymerase chain reaction. Eur. J. Immunol. 22:1261. Fas(Apo-1/CD95) ligand: implications for tumor immune escape. Science 274:1363.
19 Genevee, C., Dietrich, P. Y., Robache, S., Guillard, M., Escudier, B.,
Terrier-Lacombe, M. J., Triebel, F. and Caignard, A. 1995. In vivo 36 O’Connell, J., O’Sullivan, G. C., Collins, J. K. and Shanahan, F. 1996. The Fas counterattack: Fas-mediated T cell killing by colon local expansion of clonal T cell subpopulations in renal cell
carcinoma. Cancer Res. 55:685. cancer cells expressing Fas ligand. J. Exp. Med. 184:1075. 37 Strand, S., Hofmann, W. J., Hug, H., Mu¨ller, M., Otto, G., Strand, D., 20 Farace, F., Angevin, E., Escudier, B., Caignard, A., Dietrich, P.
Y., Genevee, C., Hercend, T. and Triebel, F. 1993. Influence of Mariani, S. M., Stremmel, W., Krammer, P. H. and Galle, P. R. 1996. Lymphocyte apoptosis induced by CD95 (Apo-1/Fas) ligand-interleukin-2 administration on the expression of T-cell receptor V
gene segments in patients with renal-cell carcinoma. Int. J. expressing tumor cells—a mechanism of immune evasion? Nature Medicine 2:1361.
Cancer 54:741.
21 Even, J., Lim, A., Puisieux, I., Ferradini, L., Dietrich, P. Y., Toubert, 38 Saas, P., Walker, P. R., Hahne, M., Quiquerez, A.-L., Schnuriger, V., Perrin, G., French, L., Van Meir, E. G., de Tribolet, N., Tschopp, J. A., Hercend, T., Triebel, F., Pannetier, C. and Kourilsky, P. 1995.
T-cell repertoires in healthy and diseased human tissues analysed and Dietrich, P. Y. 1997. Fas Ligand expression by astrocytoma in vivo: maintaining immune privilege in the brain? J. Clin. Invest. by T-cell receptor beta-chain CDR3 size determination: evidence
for oligoclonal expansions in tumours and inflammatory diseases. 99:1173.
39 June, C. H., Bluestone, J. A., Nadler, L. M. and Thompson, C. B. Res. Immunol. 146:65.
22 Ebato, M., Nitta, T., Yagita, H., Sato, K. and Okumura, K. 1994. 1994. The B7 and CD28 receptor families. Immunol. Today 15:321. 40 Leach, D. R., Krummel, M. F. and Allison, J. P. 1996. Enhancement Shared amino acid sequences in the NDbetaN and Nalpha regions
of the T cell receptors of tumor-infiltrating lymphocytes within of antitumor immunity by CTLA-4 blockade. Science 271:1734. 41 Van Parijs, L., Ibraghimov, A. and Abbas, A. K. 1996. The roles of malignant glioma. Eur. J. Immunol. 24:2987.
23 Moretta, A., Pantaleo, G., Moretta, L., Cerottini, J. C. and Mingari, costimulation and Fas in T cell apoptosis and peripheral tolerance. Immunity 4:321.
M. C. 1983. Direct demonstration of the clonogenic potential of
every human peripheral blood T cell. Clonal analysis of HLA-DR 42 Sloan-Lancaster, J., Shaw, A. S., Rothbard, J. B. and Allen, P. M. 1994. Partial T cell signaling: altered phospho-zeta and lack of expression and cytolytic activity. J. Exp. Med. 157:743.
24 Miescher, S., Whiteside, T. L., de Tribolet, N. and Von Fliedner, V. ZAP-70 recruitment in APL-induced T cell anergy. Cell 79:913. 43 Klenerman, P., Rowland-Jones, S., McAdam, S., Edwards, J., 1988. In situ characterization, clonogenic potential, and antitumor
cytolytic activity of T lymphocytes infiltrating human brain cancers. Daenke, S., Lalloo, D., Koppe, B., Rosenberg, W., Boyd, D., Edwards, A., Giangrande, P., Phillips, R. E. and McMichael, A. J. J. Neurosurg. 68:438.
25 Farace, F., Orlanducci, F., Dietrich, P. Y., Gaudin, C., Angevin, E., 1994. Cytotoxic T-cell activity antagonized by naturally occurring HIV-1 gag variants. Nature 369:403.
Courtier, M. H., Bayle, C., Hercend, T. and Triebel, F. 1994. T cell
repertoire in patients with B chronic lymphocytic leukemia. 44 Bertoletti, A., Sette, A., Chisari, F. V., Penna, A., Levrero, M., De Carli, M., Fiaccadori, F. and Ferrari, C. 1994. Natural variants of Evidence for multiple in vivo T cell clonal expansions. J. Immunol.
153:4281. cytotoxic epitopes are T-cell receptor antagonists for antiviral
cytotoxic T cells. Nature 369:407. 26 Mackensen, A., Ferradini, L., Carcelain, G., Triebel, F., Faure, F.,
Viel, S. and Hercend, T. 1993. Evidence for in situ amplification of 45 Madrenas, J., Wange, R. L., Wang, J. L., Isakov, N., Samelson, L. E. and Germain, R. N. 1995. Zeta phosphorylation without ZAP-70 cytotoxic T-lymphocytes with antitumor activity in a human
regressive melanoma. Cancer Res. 53:3569. activation induced by TCR antagonists or partial agonists. Science 267:515.
27 Mackensen, A., Carcelain, G., Viel, S., Raynal, M. C., Michalaki, H.,
Triebel, F., Bosq, J. and Hercend, T. 1994. Direct evidence to 46 Caignard, A., Dietrich, P. Y., Morand, V., Lim, A., Pannetier, C., Leridant, A. M., Hercend, T., Even, J., Kourilsky, P. and Triebel, F. support the immunosurveillance concept in a human regressive
melanoma. J. Clin. Invest. 93:1397. 1994. Evidence for T-cell clonal expansion in a patient with squamous cell carcinoma of the head and neck. Cancer Res. 28 Fontana, A., Hengartner, H., de Tribolet, N. and Weber, E. 1984.
Glioblastoma cells release interleukin 1 and factors inhibiting 54:1292.
47 Gill, R. F., Abastado, J. P. and Wei, W. Z. 1994. Systematic interleukin 2-mediated effects. J. Immunol. 132:1837.
29 Huber, D., Philipp, J. and Fontana, A. 1992. Protease inhibitors identification of H-2 Kdbinding peptides and induction of peptide specific CTL. J. Immunol. Methods 176:245.
interfere with the transforming growth factor-β-dependent but not
the transforming growth factor-β-independent pathway of tumor 48 Liu, B., Podack, E. R., Allison, J. P. and Malek, T. R. 1996. Generation of primary tumor-specific CTL in vitro to immunogenic and poorly cell-mediated immunosuppression. J. Immunol. 148:277.
30 Hishii, M., Nitta, T., Ishida, H., Ebato, M., Kurosu, A., Yagita, H., immunogenic mouse tumors. J. Immunol. 156:1117.
49 Yang, G., Hellstrom, K. E., Mizuno, M. T. and Chen, L. 1995. In vitro Sato, K. and Okumura, K. 1995. Human glioma-derived
interleukin-10 inhibits antitumor immune responses in vitro. Neurosurgery priming of tumor-reactive cytolytic T lymphocytes by combining IL-10 with B7-CD28 costimulation. J. Immunol. 155:3897.
37:1160.
31 Schoof, D. D., Terashima, Y., Peoples, G. E., Goedegebuure, P. S., 50 Gajewski, T. F., Renauld, J. C., Van Pel, A. and Boon, T. 1995. Costimulation with B7-1, IL-6, and IL-12 is sufficient for primary Ravan Andrews, J. V., Richie, J. P. and Eberlin, T. J. 1993. CD41T
cell clones isolated from human renal cell carcinoma possess the generation of murine antitumor cytolytic T lymphocytes in vitro. J. Immunol. 154:5637.
functional characteristics of Th2 helper cells. Cell. Immunol.
150:114. 51 Hou, S. and Doherty, P. C. 1993. Partitioning of responder CD81T
cells in lymph node and lung of mice with Sendai virus pneumonia 32 Nakagomi, H., Pisa, P., Pisa, E. K., Yamamoto, Y., Halapi, E., Backlin,
52 Mobley, J. L., Rigby, S. M. and Dailey, M. O. 1994. Regulation of Canon, J.-L., Laurent, C., Naeyaert, J.-M., Plagne, R., Deraemaeker, R., Knuth, A., Ja¨ger, E., Brasseur, F., Herman, J., adhesion molecule expression by CD8 T cells in vivo. II. Expression
of L-selectin (CD62L) by memory cytolytic T cells responding to Coulie, P. G. and Boon, T. 1995. Tumor regression responses in melanoma patients treated with a peptide encoded by gene MAGE-minor histocompatibility antigens. J. Immunol. 153:5443.
53 Razvi, E. S., Welsh, R. M. and McFarland, H. I. 1995. In vivo state 3. Int. J. Cancer 63:883.
55 Arden, B., Clark, S. P., Kabelitz, D. and Mak, T. W. 1995. Human T-of antiviral CTL precursors. Characterization T-of a cycling cell
population containing CTL precursors in immune mice. cell receptor variable gene segment families. Immunogenetics 42:455.
J. Immunol. 154:620.
54 Marchand, M., Weynants, P., Rankin, E., Arienti, F., Belli, F., 56 Chothia, C., Boswell, D. R. and Lesk, A. M. 1988. The outline structure of the T-cell alpha beta receptor. EMBO J. 7:3745. Parmiani, G., Cascinelli, N., Bourlond, A., Vanwijck, R., Humblet, Y.,