HAL Id: hal-00317035
https://hal.archives-ouvertes.fr/hal-00317035
Submitted on 1 Jan 2002
HAL is a multi-disciplinary open access
archive for the deposit and dissemination of
sci-entific research documents, whether they are
pub-lished or not. The documents may come from
teaching and research institutions in France or
abroad, or from public or private research centers.
L’archive ouverte pluridisciplinaire HAL, est
destinée au dépôt et à la diffusion de documents
scientifiques de niveau recherche, publiés ou non,
émanant des établissements d’enseignement et de
recherche français ou étrangers, des laboratoires
publics ou privés.
The bottomside parameters B0, B1 obtained from
incoherent scatter measurements during a solar
maximum and their comparisons with the IRI-2001
model
N. K. Sethi, K. K. Mahajan
To cite this version:
N. K. Sethi, K. K. Mahajan. The bottomside parameters B0, B1 obtained from incoherent scatter
measurements during a solar maximum and their comparisons with the IRI-2001 model. Annales
Geophysicae, European Geosciences Union, 2002, 20 (6), pp.817-822. �hal-00317035�
Annales Geophysicae (2002) 20: 817–822 c European Geophysical Society 2002
Annales
Geophysicae
The bottomside parameters B0, B1 obtained from incoherent
scatter measurements during a solar maximum and their
comparisons with the IRI-2001 model
N. K. Sethi and K. K. Mahajan
Radio and Atmospheric Sciences Division, National Physical Laboratory, Dr. K. S. Krishnan Road, New Delhi – 110 012, India
Received: 6 September 2001 – Revised: 23 January 2002 – Accepted: 12 February 2002
Abstract. High resolution electron density profiles (N e)
measured with the Arecibo (18.4 N, 66.7 W), Incoherent Scatter radar (I.S.) are used to obtain the bottomside shape parameters B0, B1 for a solar maximum period (1989– 90). Median values of these parameters are compared with those obtained from the IRI-2001 model. It is observed that during summer, the IRI values agree fairly well with the Arecibo values, though the numbers are somewhat larger during the daytime. Discrepancies occur during winter and equinox, when the IRI underestimates B0 for the local times from about 12:00 LT to about 20:00 LT. Furthermore, the IRI model tends to generally overestimate B1 at all local times. At Arecibo, B0 increases by about 50%, and B1 decreases by about 30% from solar minimum to solar maximum.
Key words. Ionosphere (equational ionosphere; modeling
and forecasting)
1 Introduction
The International Reference Ionosphere (IRI) is a global em-pirical model which specifies the monthly average of the electron density, electron temperature, ion temperature and ion composition. Over the years, testing and modification of IRI has continued with extensive participation by a joint working group of the International Union of Radio Science (URSI) and the Committee on Space Research (COSPAR). These efforts have led to improvements through several ver-sions (IRI-78, IRI-80, IRI-86, IRI-90, IRI-95, IRI-2001).
Electron density distribution in the IRI model below the F2 peak is described by the analytic function (Ramakrishnan and Rawer, 1972):
N (h) = N mF2 × exp(−xB1)/cos h(x), (1)
with x = (hmF2 − h)/B0. (2)
B0 is the bottomside thickness parameter and B1 deter-mines the profile shape describing the bottomside electron
Correspondence to: N. K. Sethi ([email protected])
density distribution below the F2 peak. In the widely used IRI-90 (Bilitza, 1990), there were two options for provid-ing B0. The old option was the standard model which made use of a table of values of B0 deduced from profile inver-sion of ionograms at mid-latitude stations. The second op-tion (which was considered the better choice, especially at low-latitudes), used Gulyaeva’s (1987) model for B0. This was based on half density height h 0.5 (the height below the F2 peak, where the density fell off to half the peak value: N (h0.5) = 0.5 N mF2). This B0 was given as
B0 = (hmF2 − h 0.5)/C, (3)
where C was a function of B1.
Since the IRI-90 assumed a constant value of 3 for B1 most of the time, the parameter C correspondingly was as-signed a value of 0.75556 (Bilitza, 1990). In earlier studies, Mahajan et al. (1995), using Arecibo measurements (a low-latitude station) during solar minimum period (1974–1977) showed that B0 values based on Gulyaeva’s 1987 model were significantly larger, especially during daytime, for sum-mer and equinox seasons, than those obtained from the surements. Later, Pandey and Sethi (1996), using I.S. mea-surements during daytime from Arecibo, for the solar mini-mum period (1974–1977), showed that the IRI-90 values of electron densities below the F2 peak at all the heights were larger during summer and equinox months. A comparison of N e profiles derived from ionogram at low-latitudes during solar minimum and maximum periods, with those obtained from IRI-90, also showed similar results (De Gonzalez 1996; Aggarwal et al., 1996). Gulyaeva et al. (1996) compared the ratio h 0.5/H mF2 using Arecibo N e profiles during summer, with those obtained from the IRI-90 model. Their analysis showed that the IRI-90 underestimated the ratios at all local times in comparison to those obtained from the observations. In view of these and other discrepancies, the IRI Task Force in 1995 (Bilitza, 1996) decided to establish B0, B1 param-eters directly from the measured profiles below the F2 peak down to 0.24 N mF2. Following this, efforts were made by several workers to establish a set of B0, B1 parameters,
us-818 N. K. Sethi and K. K. Mahajan: The bottomside parameters B0, B1 obtained from incoherent scatter measurements
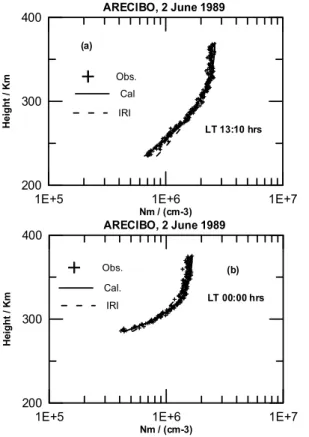
1E+5 1E+6 1E+7
Nm / (cm-3) 200 300 400 He ig ht / K m ARECIBO, 2 June 1989 LT 13:10 hrs Obs. Cal IRI (a)
1E+5 1E+6 1E+7
Nm / (cm-3) 200 300 400 He ig ht / K m ARECIBO, 2 June 1989 Obs. Cal. IRI LT 00:00 hrs (b)
Fig. 1. Sample profiles obtained using best B0, B1 parameters
de-rived from I.S. measurements at Arecibo for (a) daytime, (b) mid-night. Calculated profiles are shown by solid lines. The IRI model profile is shown as dash line.
ing data from various stations (Huang and Reinisch, 1996; Adeniyi and Radicella 1998; Sethi et al., 2000; Mahajan and Sethi, 2001). Their results showed that B1 varied between 1 and 9 with higher values by night and lower ones by day, while in the IRI-90, B1 was kept at a constant value of 3 for most of the cases. These workers also reported that B0 showed a strong diurnal variation with higher values around noon. In view of the discrepancies between the IRI-90 model and the ionosonde, as well as the radar measurements, the model has since been revised and named IRI-2001 (Bilitza, 2001). The B0, B1 values in the model are primarily based upon the ionosonde data base, generated through the ICTP efforts (Bilitza et al., 2000) and provide solar activity, as well as seasonal variations.
We have recently acquired incoherent scatter N e − h data for the years 1989–1990 (a period of high solar activity) from the Arecibo observatory (Qihou Zhou, 2000, private commu-nication). In this paper, we compute the B0, B1 parameters for these data and compare these values with those obtained during the solar minimum by Sethi et al. (2000), Mahajan and Sethi (2001), and with the IRI-2001.
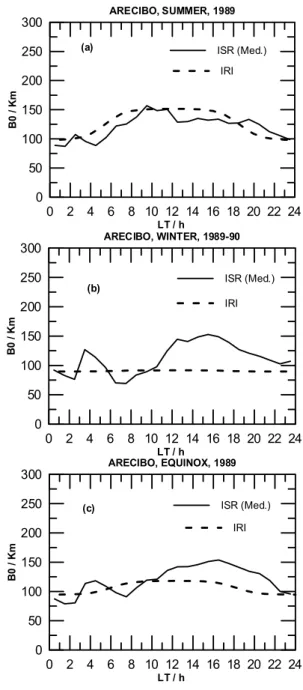
0 2 4 6 8 10 12 14 16 18 20 22 24 LT / h 0 50 100 150 200 250 300 B0 / Km (a) ARECIBO, SUMMER, 1989 0 2 4 6 8 10 12 14 16 18 20 22 24 LT / h 0 50 100 150 200 250 300 B 0 / Km (b) ARECIBO, WINTER, 1989-90 0 2 4 6 8 10 12 14 16 18 20 22 24 LT / h 0 50 100 150 200 250 300 B0 / K m (c) ARECIBO, EQUINOX, 1989
Fig. 2. A scatter plot showing diurnal variation of the parameter B0
derived from the I.S. measurements at Arecibo for (a) summer, (b) winter and (c) equinox.
2 Experimental data
The electron density profiles used in the present study, as mentioned earlier, have been taken from the Arecibo obser-vatory, Puerto Rico, USA. The effective height resolution is 0.6 km, which was achieved by using s 4 µs pulse length. The time resolution is about 1 min. The power profile is con-verted into an electron density profile by using a simultane-ously measured electron to ion temperature ratio profile. The profile is finally calibrated by reading N mF2 from an on-site ionosonde. We have employed the data for a period of so-lar maximum from March 1989 to January 1990, containing
N. K. Sethi and K. K. Mahajan: The bottomside parameters B0, B1 obtained from incoherent scatter measurements 819 0 2 4 6 8 10 12 14 16 18 20 22 24 LT / h 0 50 100 150 200 250 300 B0 / Km IRI ISR (Med.) (a) ARECIBO, SUMMER, 1989 0 2 4 6 8 10 12 14 16 18 20 22 24 LT / h 0 50 100 150 200 250 300 B 0 / Km ISR (Med.) IRI ARECIBO, WINTER, 1989-90 (b) 0 2 4 6 8 10 12 14 16 18 20 22 24 LT / h 0 50 100 150 200 250 300 B 0 / Km ISR (Med.) IRI (c) ARECIBO, EQUINOX, 1989
Fig. 3. Variation of median values of B0 observed at Arecibo and
those obtained from the IRI model for (a) summer, (b) winter and
(c) equinox. The median values are shown as a solid line and the
IRI model values are shown as a dashed line.
around 14 171 N e profiles.
3 Analysis and results
The technique for obtaining B0, B1 from the observed pro-files is demonstrated in Figs. 1a and b. These figures show some sample N e profiles truncated at 0.24 N mF2 below the F2 peak. The IRI profile function, described by Eq. (1), has been fitted to these profiles and the best B0, B1 parameters have been obtained. The best fit profiles are shown as solid lines and the IRI profiles are shown by dashed lines.
Since the IRI-2001 has B0, B1 models for the three sea-sons, summer, winter and equinox, we also have grouped the N (e)profiles into these three seasons. For summer, we have 4675 profiles, for winter, 3709 profiles and for equinox, 5787 profiles. These profiles, as stated earlier, were truncated at 0.24 N mF2 and were then fitted to the IRI profile function, to find optimum B0, B1 parameters. Median values for each of these parameters were calculated for 30-min bins of lo-cal time. The B0, B1 values predicted by IRI-2001 (Bil-itza, 2001) were obtained for RZ12 = 150, day 15 of June, March and December, as representative of summer, equinox and winter, respectively.
Figures 2a–c show mass plots of B0 against local time for summer, winter and equinox seasons. It is observed that for the same local time and in the same season, B0 shows a large scatter, and varies by as much as a factor of 2 during all the seasons. In Figs. 3a–c, we compare the plots of median B0 obtained from the incoherent scatter measurements and the IRI model for summer, winter and equinox, respectively. It can be seen from Fig. 3a that during summer, the median value of B0 varies from around 90 km during night to about 150 km in the pre-noon hours, and thereafter, it falls gradu-ally to about 80 km around midnight. However, it shows a good agreement with the IRI predicted values. The percent-age difference between the two is less than 15%. During the winter and equinox seasons, as can be seen from Figs. 3b and c, the median value of B0 increases from about 90 km in the morning (07:00 LT) to about 150 km in the afternoon (15:00– 16:00 LT) and thereafter, it falls to about 100 km around mid-night. B0 shows an increasing trend from 02:00 to 04:00 LT with values varying from 75 km to 175 km (during winter) and 80 to 120 km (during equinox). In this time period, IRI generally underestimates B0. It may also be noted that the IRI predicted values of B0 do not show any local time change during winter. The percentage difference between the IRI predicted and the median values varies from about 35 to 65% during winter and from about 15 to 35% during equinox, for the local times between 12:00 to 20:00 LT. The difference be-tween the two, outside this time period, remains at less than 20% for both the seasons.
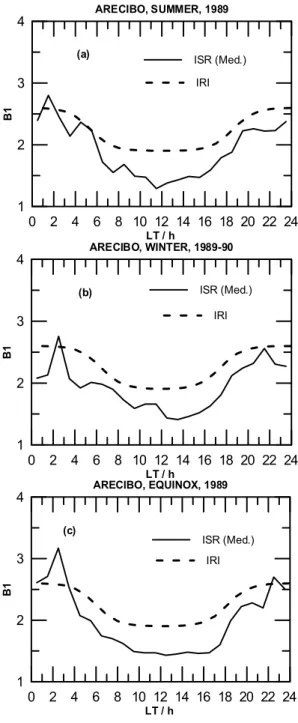
Diurnal variations of mass plots of the parameter B1 are shown in Figs. 4a–c for summer, winter and equinox, respec-tively. It can be seen that B1 shows a large dispersion during the night hours, with values varying between 1 and 6. The median values and the IRI predicted values of B1 are shown in Figs. 5a–c. The median values vary between 1.45 and 3, in general. The IRI values exhibit more or less a similar di-urnal trend, but with somewhat higher values during all the seasons and at all local times.
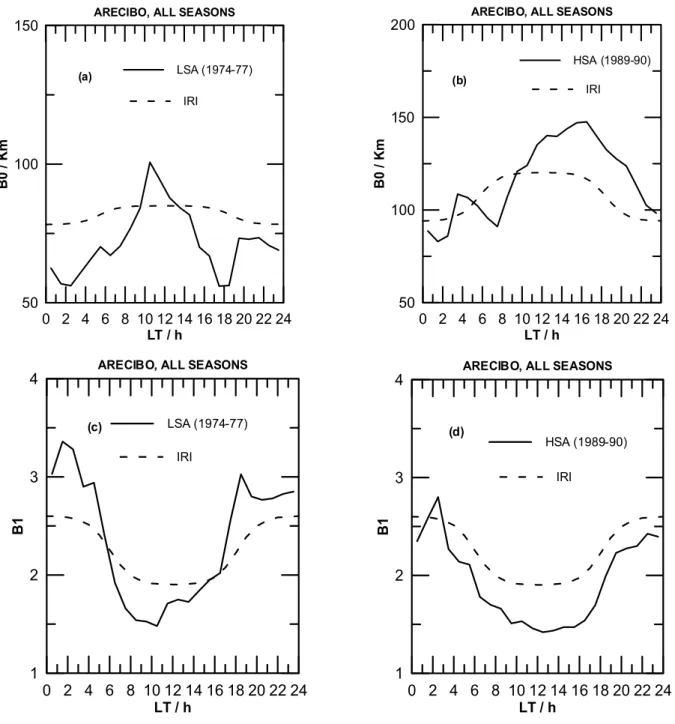
The thickness and shape parameters are expected to show solar activity variations, as seen in IRI-2001 (Bilitza, 2001). We have, therefore, compared in Figs. 6a–d the median val-ues of these parameters for the solar maximum (1989–1990) with those obtained earlier by us (Mahajan and Sethi, 2001) for solar minimum (1974–1977), along with the IRI pre-dicted values. For low solar activity, the prepre-dicted B0, B1 (Bilitza, 2001) values were obtained for RZ12 = 15, day 15
820 N. K. Sethi and K. K. Mahajan: The bottomside parameters B0, B1 obtained from incoherent scatter measurements 0 2 4 6 8 10 12 14 16 18 20 22 24 LT / h 0 1 2 3 4 5 6 7 8 B1 ARECIBO, SUMMER, 1989 (a) 0 2 4 6 8 10 12 14 16 18 20 22 24 LT / h 0 1 2 3 4 5 6 7 8 B1 ARECIBO, WINTER, 1989-90 (b) 0 2 4 6 8 10 12 14 16 18 20 22 24 LT / h 0 1 2 3 4 5 6 7 8 B1 ARECIBO, EQUINOX, 1989 (c)
Fig. 4. A scatter plot showing diurnal variation of the parameter B1
derived from the I.S. measurements at Arecibo for (a) summer, (b) winter and (c) equinox.
of June, March and December, as representative of summer, equinox and winter, respectively. The B0, B1 values thus obtained for low and high solar activity periods are averaged over three months to represent all seasons. It can be seen from Figs. 6a and b that the parameter B0 increases by more than 50% from low solar activity to high solar activity, while the IRI predicted values show an increase by about 40% dur-ing daytime and by about 20% durdur-ing the night. As seen from the Figs. 6c and d, the parameter B1 decreases by about 20% from low solar activity to high solar activity. However, the
0 2 4 6 8 10 12 14 16 18 20 22 24 LT / h 1 2 3 4 B1 ISR (Med.) IRI (a) ARECIBO, SUMMER, 1989 0 2 4 6 8 10 12 14 16 18 20 22 24 LT / h 1 2 3 4 B1 ISR (Med.) IRI (b) ARECIBO, WINTER, 1989-90 0 2 4 6 8 10 12 14 16 18 20 22 24 LT / h 1 2 3 4 B1 ISR (Med.) IRI (c) ARECIBO, EQUINOX, 1989
Fig. 5. Variation of median values of B1 observed at Arecibo and
those obtained from the IRI model for (a) summer, (b) winter and
(c) equinox. The median values are shown as a solid line and the
IRI model values are shown as a dashed line.
IRI does not exhibit any solar activity dependence.
4 Conclusions
Comparison of the IRI-2001 predicted B0 parameter with those observed at Arecibo show a fair agreement during sum-mer for most of the local times. A larger difference between the two occurs during winter and equinox seasons, partic-ularly between 12:00 to 20:00 LT, when the IRI
underesti-N. K. Sethi and K. K. Mahajan: The bottomside parameters B0, B1 obtained from incoherent scatter measurements 821 0 2 4 6 8 10 12 14 16 18 20 22 24 LT / h 50 100 150 B0 / Km (a) IRI LSA (1974-77) ARECIBO, ALL SEASONS
0 2 4 6 8 10 12 14 16 18 20 22 24 LT / h 50 100 150 200 B0 / Km
ARECIBO, ALL SEASONS
IRI (b) HSA (1989-90) 0 2 4 6 8 10 12 14 16 18 20 22 24 LT / h 1 2 3 4 B1 LSA (1974-77)
ARECIBO, ALL SEASONS
IRI (c) 0 2 4 6 8 10 12 14 16 18 20 22 24 LT / h 1 2 3 4 B1 HSA (1989-90)
ARECIBO, ALL SEASONS
IRI
(d)
Fig. 6. Plots showing the median values of B0, B1 parameters obtained from the I.S. measurements, along with the IRI model during low
and high solar activity periods. The median values are shown as solid lines and the IRI model values are shown as dashed lines. Low and high solar activity values of B0 are shown in (a) and (b) and of B1 in (c) and (d), respectively.
mates B0. During winter, the IRI does not show any local time change for the parameter B0. For other local times, the discrepancies are the least. For B1, the model and the observations show a similar diurnal trend, with IRI showing somewhat higher values for all the seasons and for all local times. In contrast to our observations, IRI does not exhibit any solar activity dependence for B1. The parameters B0, B1 obtained from measurements can be used as input to the IRI model, in order to achieve a more accurate shape of the electron density profile in the F2-region below the peak.
Acknowledgement. The Arecibo observatory is one of the major
fa-cility of the National Astronomy and Ionosphere Center, operated by Cornell University under a cooperative agreement with the Na-tional Science Foundation. We are thankful to Qihou Zhou, Arecibo Observatory, HC3 Box 53995 Arecibo, PR 00612, Puerto Rico, USA for supplying us data. K. K. Mahajan is thankful to Coun-cil of Scientific and Industrial Research (CSIR) for the award of Emeritus Scientist position during the progress of this work.
Topical Editor M. Lester thanks two referees for their help in evaluating this paper.
822 N. K. Sethi and K. K. Mahajan: The bottomside parameters B0, B1 obtained from incoherent scatter measurements
References
Aggarwal, S., Venkatachari, R., Sachdeva, V. P., and Jain, V. C.: Comparison of electron density profiles for Delhi with corre-sponding profiles obtained from IRI-90, Adv. Space Res., 18, 6, 39–40, 1996.
Adeniyi, J. O. and Radicella, S. M.: Variation of bottomside profile parameters B0 and B1 at high solar activity for an equatorial station, J. Atmos. Solar-Terr. Phys., 60, 1123–1127, 1998. Bilitza, D. (Ed): The International Reference Ionosphere, NSSDC
90-2, World Data Center A, Rockets and Satellites, Greenbelt, USA, 1990.
Bilitza, D.: F1 and bottomside region in IRI – Status report, Proc. Of the IRI task force Activity 1995, IC/IR/96/14, (Ed) Radicella, S. M., Trieste, May 1996.
Bilitza, D., Radicella, S. M., Reinisch, B. W., Adeniyi, J. O., Mosert, M. E., Gonzalez, S., Zhang, S. R., and Obrou, O.: New
B0 and B1 Models for IRI, Adv. Space Res., 25, 1, 89–95, 2000. Bilitza, D.: International Reference Ionosphere 2000, Radio
Sci-ence, 36, 2, 261–275, 2001.
De Gonzalez, M. M.: Observed and model N (h) profiles for two Argentine stations, Adv. Space Res., 18, 6, 53–56, 1996. Gulyaeva, T. L.: Progress in ionospheric informatic based on
elec-tron density profile analysis of ionograms, Adv. Space Res., 7,
2, 51–60, 1987.
Gulyaeva, T. L., Mahajan, K. K., and Sethi, N. K.: Modification of IRI half-density height option for low latitudes, Adv. Space Res., 18, 6, 149–152, 1996.
Huang, X. and Reinisch, B. W.: Fitting the IRI profile function to measured profiles, IRI Task Force Activity 1996, International Center of Theoretical Physics, Trieste, Italy, 1996.
Mahajan, K. K., Kohli, R., Sethi, N. K., and Pandey, V. K.: Vari-ability of the F-region parameter h 0.5, Adv. Space Res., 15, 2, 51–60, 1995.
Mahajan, K. K. and Sethi, N. K.: Empirical models of parameters
B0, B1 from Arecibo radar measurements, Adv. Space Res., 27, 1, 17–20, 2001.
Pandey, V. K. and Sethi, N. K.: Comparison of hmF2 and mid-day bottomside electron density profile obtained from IRI and incoherent scatter measurements, Adv. Space Res., 18, 6, 33–37, 1996.
Ramakrishnan, S. and Rawer, K.: Model electron density profiles obtained by empirical procedures, Space Research XII, 1253, Akademie-Verlag, Berlin, German Democratic Republic, 1972. Sethi, N. K., Mahajan, K. K. and Pandey, V. K.: Bottomside
pa-rameters B0, B1 from Arecibo incoherent scatter radar measure-ments, Adv. Space Res., 25, 1, 97–100, 2000.