HAL Id: hal-00296798
https://hal.archives-ouvertes.fr/hal-00296798
Submitted on 13 Jan 2006
HAL is a multi-disciplinary open access
archive for the deposit and dissemination of
sci-entific research documents, whether they are
pub-lished or not. The documents may come from
teaching and research institutions in France or
abroad, or from public or private research centers.
L’archive ouverte pluridisciplinaire HAL, est
destinée au dépôt et à la diffusion de documents
scientifiques de niveau recherche, publiés ou non,
émanant des établissements d’enseignement et de
recherche français ou étrangers, des laboratoires
publics ou privés.
Warm season precipitation climatology: first European
results
V. Levizzani, R. Ginnetti, A. G. Laing, R. E. Carbone
To cite this version:
V. Levizzani, R. Ginnetti, A. G. Laing, R. E. Carbone. Warm season precipitation climatology:
first European results. Advances in Geosciences, European Geosciences Union, 2006, 7, pp.15-18.
�hal-00296798�
SRef-ID: 1680-7359/adgeo/2006-7-15 European Geosciences Union
© 2006 Author(s). This work is licensed under a Creative Commons License.
Advances in
Geosciences
Warm season precipitation climatology: first European results
V. Levizzani1, R. Ginnetti1, A. G. Laing2, and R. E. Carbone2
1National Research Council, Institute of Atmospheric Sciences and Climate, Bologna, Italy 2National Center for Atmospheric Research, Boulder, CO, USA
Received: 31 October 2005 – Revised: 9 December 2005 – Accepted: 14 December 2005 – Published: 13 January 2006
Abstract. To date very low scores are associated to
quan-titative precipitation forecasts (QPF) of warm season pre-cipitation, a fact mostly due to the little knowledge of the mechanisms driving these phenomena. The study aims to produce a five-year climatology (1999–2003) of warm sea-son precipitation systems (MJJA) over Europe using Me-teosat IR brightness temperatures as a contribution to a global study launched by the World Weather Research Pro-gramme (WWRP). Cold cloud persistence, span and duration of weather systems were determined to derive the zonal prop-agation speed and daily cycles.
1 Introduction
Quantitative precipitation forecasting (QPF) remains one of the greatest challenges in weather forecasting. Warm season precipitation episodes represent an even greater challenge as they may exhibit coherent rainfall patterns, characteristic of propagating events under a broad range of atmospheric con-ditions. They are frequent under weakly-forced conditions in midsummer and are strongly modulated by diurnal heating.
In the United States (US), investigations on the lifecycles of mesoscale convective systems (MCS) have found that the majority of these systems initiate in the lee of the Rocky Mountains, move towards the east and produce an overnight precipitation maximum across the central plains, sometimes while undergoing various cycles of regeneration (e.g., Mad-dox, 1980; Fritsch et al., 1986; Augustine and Caracena, 1994; Anderson and Arritt, 1998; Trier et al., 2000). Us-ing the Weather Surveillance Radar-88 Doppler (WSR-88D) data, Carbone et al. (2002) found that clusters of heavy pre-cipitation display coherent patterns of propagation across the continental US with propagation speeds for envelopes of precipitation that exceed that of any individual MCS. Their longevity (up to 60 h) suggests an intrinsic predictability of
Correspondence to: V. Levizzani
(v.levizzani@isac.cnr.it)
warm season rainfall that significantly exceeds the lifetime of individual convective systems.
Wang et al. (2004) developed a similar climatology for warm season precipitation in East Asia using infrared (IR) brightness temperatures from the Japanese Geostationary Meteorology Satellite (GMS). Their study showed propaga-tion of cold-cloud clusters (or quasi-precipitapropaga-tion episodes) across a zonal span of 3000 km with a duration of 45 h.
A climatology of warm season precipitation episodes over Africa is under study using IR brightness temperatures from EUMETSAT’s Meteosat satellite (Laing et al., 2004). Given the similarity in the properties of MCSs globally (Laing and Fritsch, 1993, 1997), coherence in propagating characteris-tics is expected for precipitation over Africa.
Several studies based on reanalyses and/or ad-hoc simula-tions have tackled the characterization of the areas of cyclo-genesis, the seasonal dependence and the generating mecha-nisms of European and Mediterranean precipitation systems. Among others, Alpert et al. (1990a) and Trigo et al. (1999) used the European Center for Medium-Range Weather Fore-casts (ECMWF) 15-year reanalysis (ERA-15) to show that over 65% of Mediterranean cyclones have a radius less than 550 km and an average duration of about 28 h. Larger, short-living cyclones were found over the western Mediterranean by other authors spanning between 150 and 300 km. These and other studies have shown the existence of different gener-ation areas and generating mechanisms, with strong seasonal and even inter-monthly variability (Alpert et al., 1990a, b; Trigo et al., 1999, 2002). As is to be expected, the inten-sity of the cyclogenetic activity appears to be dominated to a large extent by large scale forcing. However, local forcing plays a role, e.g. orography and latent heat release at the sea surface.
Very few observational studies exist on the span and dura-tion of precipitadura-tion systems over Europe. Chaboureau and Claud (2003) have devised a technique based on the storm signature on clouds and precipitation as observed from the TIROS-N Operational Vertical Sounder (TOVS). They used three retrieved fields, temperature of the lower stratosphere
16 V. Levizzani et al.: Warm season precipitation climatology
Table 1. Mean zonal span, duration and zonal propagation speed for all system May–August 1999–2003 that last longer than 3 h, and same
quantities for those belonging to the top 50%. For each year the number of those events that qualified over the total number is reported.
Cloud streaks 1999 2000 2001 2002 2003 mean (296/870) (339/889) (328/906) (372/1033) (357/899) (1692/4597) All span (km) 473.0 457.1 516.2 468.6 430.9 469.2 duration (h) 8.1 8.2 9.4 9.1 8.0 8.6 speed (m s−1) 15.7 15.1 15 13.9 14.7 14.9 Top half span (km) 758.0 728.9 823.3 744.0 691.6 749.2 duration (h) 12.2 12.2 14.4 13.8 12 12.9 speed (m s−1) 20.6 20.3 19.4 18.3 19.9 19.7
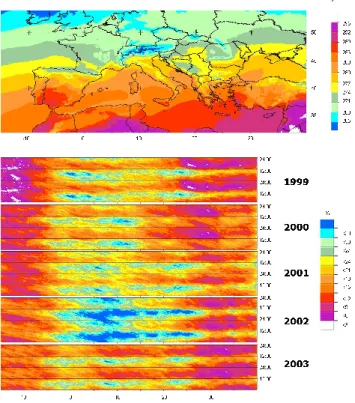
Fig. 1. (a) Average cloud top temperature over the whole
period May–August 1999–2003. (b) Average yearly May–
August longitude-time-of-day Hovm¨oller diagrams of temperatures
<265 K; the graphs are repeated twice in the vertical in order to better identify the existence of the 24-h cycle.
(TLS), cloud top pressure (CTP), and a precipitation index, to characterize the intraseasonal variability of wintertime large precipitating systems over the North Atlantic Ocean. Chaboureau and Claud (2006) have recently adapted their technique to Mediterranean cyclones, providing a typology of cloud systems for each season, to determine the proportion of lows for which the dynamics is dominated by the upper-level situation and to examine the potential relationship be-tween individual cloud systems and low-frequency variabil-ity.
Fig. 2. Examples of monthly Hovm¨oller diagrams for the selected
European area (see Fig. 1): May 2000 (left) and August 2000 (right). The threshold temperature is 265 K. The two highlighted strips correspond to two typical cases of precipitation systems: SW flow from North Africa to Southern Europe with an extensive area of storms lasting three days (left), and Atlantic flow over France and Central Europe producing a series of storms that propagated over the continent for more than three days (right).
The present study aims to produce a five-year climatology of warm season precipitation systems (MJJA) over Europe using Meteosat IR brightness temperatures. Cold cloud per-sistence, span and duration of weather systems were deter-mined to derive the zonal propagation speed and daily cycles. First results are detailed hereafter for the period 1999–2003.
2 Data and methods
Five years of the Meteosat Visible and InfraRed Radiome-ter’s (MVIRI) IR spectral band (10.5–12.5 µm) radiances were gathered and brightness temperatures computed using the instrument’s calibration. The IR images have a spatial resolution of 5×5 km2 at the satellite sub-point (0, 0) and are available at 30 min intervals; the resolution at the South-Central European latitudes is around 7×8 km2. A threshold
technique is used to identify the cold cloud systems that are most likely to be precipitating.
Propagation characteristics were determined using a methodology similar to that employed by Carbone et al. (2002) and Wang et al. (2004). Based on the prevailing low-level flow, the continental boundaries, and tracks of pre-cipitating systems a large domain (32–54 N, 15 W–40 E) was used for the Hovm¨oller calculations; the latitudinal span to-wards the north of the domain is bound by the stretching of Meteosat image pixels. Hovm¨oller strips of 0.05 degree lon-gitude were drawn through the domain. The meridional in-formation is lost while the longitudinal averaging preserves the zonal component of the flow.
3 Cold cloud persistence and daily cycle
Cold cloud persistence was examined for a) May–August of each year, b) each month for all five years, and c) the overall average of the whole period. The latter is shown in Fig. 1.
The May–August average temperature fields for each year show that a clear signal of persistence of clouds with a cold top (the threshold was chosen at 265 K) is found in corre-spondence of the Alps, the Pyrenees, the Balkans and the Carpathians, where the average cloud top temperature is quite low over the whole period. Upon examining the fields of each month for all years, the signal appears stronger over the Alps and the Pyrenees and perhaps less evident over the Balkans and Carpathians. This fact holds also in the whole period average cloud top temperature field (Fig. 1a) although smoothed by the averaging process.
Clear signs of daily cycles are visible on each year as shown in the diagrams of Fig. 1b. The cycles are found in correspondence of the lee of the Pyrenees, Alps, Balkans and Carpathians. The strength of the cycles varies considerably from year to year, being stronger on wetter years (2002) and weaker on drier years (2003). Once more, the daily cycles in the lee of the major mountain chains are clearly visible.
4 Hovm¨oller diagrams
Monthly Hovm¨oller diagrams were drawn for the five warm seasons for a quantitative analysis on duration and span of precipitation systems. Two diagrams are reported in Fig. 2 where two examples of strips corresponding to extensive westerly systems are shown. The various types of mesoscale systems correspond to strips whose longitudinal span and time duration are characteristic of the phenomenon.
A more quantitative analysis has to be conducted on the Hovm¨oller strips to draw a statistics on duration, span and zonal propagation speed. The technique used to automati-cally identify the strips, their length and propagation angle is that devised by Carbone et al. (2002) who give full account of its mathematical aspects. Here it is sufficient to say that a bounded rectangular autocorrelation function is superim-posed to the strips to find their angle, duration and span. The
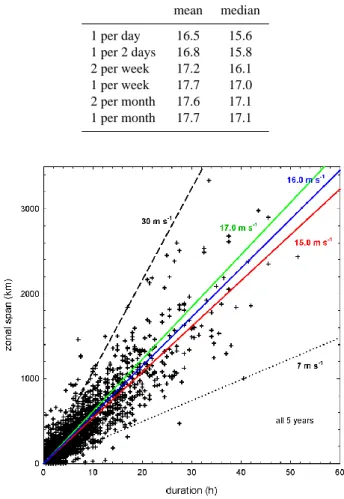
Table 2. Mean and median zonal phase speeds for different
recur-rence frequencies of precipitation systems.
mean median 1 per day 16.5 15.6 1 per 2 days 16.8 15.8 2 per week 17.2 16.1 1 per week 17.7 17.0 2 per month 17.6 17.1 1 per month 17.7 17.1
Fig. 3. Zonal span – duration of all precipitation system streaks
May–August 1999–2003. Black dotted and dashed lines represent the phase speeds of 7 and 30 m s−1, respectively, which encompass most streaks extending more than 1000 km and lasting more than 20 h. The other lines refer to median velocities for: all systems (red), systems occurring between 1 per day and 2 per week (blue), and those occurring between 1 per week and 1 per month (green).
function is uniform in one direction and cosine-weighted in the other.
Table 1 gives the statistics of zonal span, duration and zonal propagation speed of all events longer than 3 h and of those belonging to the top half in terms of span and duration. Mean and median velocity divided by recurrence category are reported in Table 2 for the whole period.
Figure 3 summarizes the overall behavior of the precip-itation systems. First of all, the vast majority of them has a zonal propagation speed between 7 and 30 m s−1, in ac-cordance with the result of Carbone et al. (2002). The median zonal phase speed for all events is 15 m s−1 grow-ing to 16 for the categories between 1 per day and 2 per week, and 17 m s−1for those between 1 per week and 1 per month. Moreover a steady increase (not shown) of the me-dian zonal propagation speed between 1999 (14.5 m s−1)and 2003 (15.8 m s−1)is registered.
18 V. Levizzani et al.: Warm season precipitation climatology
5 Conclusions
Preliminary results of a 5-year (1999–2003) warm season (May–August) climatology of cold cloud tops connected to major precipitation events were presented. No firm conclu-sions can be drawn since more analyses have to be carried out, but a few points can be outlined from the preliminary study:
– Daily cycles exist especially in the vicinity of Alps,
Pyrenees, Balkans and Carpathians.
– Median phase speeds are consistent throughout the
en-tire period.
– The method is capable of capturing all major
precipita-tion types over the continent and the Mediterranean. Further analyses need to be done on the existing dataset in order to
– Complete the statistics and compare with results in
other parts of the world within the study launched by the World Weather Research Programme (WWRP) on warm season precipitation characteristics.
– Compare with ECMWF analyses of mid- and upper
troposphere wind patterns, steering, shear, PV anoma-lies,. . .
Satellite precipitation estimation methods can be applied for further identifying precipitation systems (see Kidd, 2001 for a review of climate-oriented methods).
Acknowledgements. The senior author wishes to acknowledge
CNR for sponsoring the research and the Italian Space Agency (ASI) for partial support under the projects GOMAS and LAM-POS. The US team was sponsored by National Science Foundation support to the U.S. Weather Research Program. Meteosat imagery is copyright of EUMETSAT and was made available by the EUMETSAT Archive.
Edited by: V. Kotroni and K. Lagouvardos Reviewed by: anonymous referee
References
Alpert, P., Neeman, B. U., and Say-El, Y.: Climatological analysis of Mediterranean cyclones using ECMWF data, Tellus, 42A, 65– 77, 1990a.
Alpert, P., Neeman, B. U., and Say-El, Y.: Intermonthly variability of cyclone tracks in the Mediterranean, J. Clim., 3, 1474–1478, 1990b.
Anderson, C. and Arritt, R.: Mesoscale convective complexes and persistent elongated convective systems over the United States during 1992 and 1993, Mon. Wea. Rev., 126, 578–599, 1998. Augustine, J. A. and Caracena, F.: Lower-tropospheric precursors
to nocturnal MCS development over the Central United States, Wea. Forecasting, 9, 116–135, 1994.
Carbone, R. E., Tuttle, J. D., Ahijevich, D. A., and Trier, S. B.: Inferences of predictability associated with warm season precip-itation episodes, J. Atmos. Sci., 59, 2033–2056, 2002.
Chaboureau, J.-P. and Claud, C.: Observed variability of North At-lantic oceanic precipitating systems during winter, J. Geophys. Res., 108(D14), 4435, doi:10.1029/2002JD003,343, 2003. Chaboureau, J.-P. and Claud, C.: Satellite-based climatology
of Mediterranean cloud systems and their association with large scale circulation, J. Geophys. Res., 111(D1), D01102, doi:10.1029/2005JD006460, 2006.
Fritsch, J. M., Kane, R. J., and Chelius, C. H.: The contribution of mesoscale convective weather systems to the warm season precipitation in the United States, J. Climate Appl. Meteor., 25, 1333–1345, 1986.
Kidd, C.: Satellite rainfall climatology: A review, Int. J. Climatol., 21, 1041–1066, 2001.
Laing, A. G. and Fritsch, J. M.: Mesoscale convective complexes in Africa, Mon. Wea. Rev., 121, 2254–2263, 1993.
Laing, A. G. and Fritsch, J. M.: The global population of mesoscale convective complexes, Quart. J. Roy. Meteor. Soc., 123, 389– 405, 1997.
Laing, A. G., Carbone, R. E., and Levizzani, V.: Developing a warm season climatology of precipitating systems in Africa, Proc. 14th Int. Conf. on Clouds and Precipitation, Bologna, 18–23 July, 1806–1807, 2004.
Maddox, R. A.: Mesoscale convective complexes, Bull. Amer. Me-teor. Soc., 108, 1374–1387, 1980.
Trier, S. B., Davis, C. A., and Tuttle, J. D.: Long-lived mesoconvec-tive vortices and their environment. Part I: Observations from the Central United States during the 1998 warm season, Mon. Wea. Rev., 128, 3376–3395, 2000.
Trigo, I. F., Davies, T. D., and Bigg, G. R.: Objective climatology of cyclones in the Mediterranean region, J. Clim., 12, 1685–1696, 1999.
Trigo, I. F., Bigg, G. R., and Davies, T. D.: Climatology of cyclo-genesis mechanisms in the Mediterranean, Mon. Wea. Rev., 130, 549–569, 2002.
Wang, C.-C., Chen, G. T.-J., and Carbone, R. E.: A climatology of warm-season cloud patterns over East Asia based on GMS infrared brightness temperature observations, Mon. Wea. Rev., 132, 1606–1629, 2004.