HAL Id: hal-00766096
https://hal.archives-ouvertes.fr/hal-00766096
Submitted on 18 Dec 2012
HAL is a multi-disciplinary open access
archive for the deposit and dissemination of
sci-entific research documents, whether they are
pub-lished or not. The documents may come from
teaching and research institutions in France or
abroad, or from public or private research centers.
L’archive ouverte pluridisciplinaire HAL, est
destinée au dépôt et à la diffusion de documents
scientifiques de niveau recherche, publiés ou non,
émanant des établissements d’enseignement et de
recherche français ou étrangers, des laboratoires
publics ou privés.
Gravitationally Lensed Star Forming Galaxies at 1 < z
< 6
Lise Christensen, Johan Richard, Jens Hjorth, Bo Milvang-Jensen, Peter
Laursen, Marceau Limousin, Miroslava Dessauges-Zavadsky, Claudio Grillo,
Harald Ebeling
To cite this version:
Lise Christensen, Johan Richard, Jens Hjorth, Bo Milvang-Jensen, Peter Laursen, et al.. The Low
Mass End of the Fundamental Relation for Gravitationally Lensed Star Forming Galaxies at 1 < z <
6. Astronomy and Astrophysics - A&A, EDP Sciences, 2012, 1209, pp.767. �hal-00766096�
arXiv:1209.0767v1 [astro-ph.CO] 4 Sep 2012
The Low Mass End of the Fundamental Relation for Gravitationally
Lensed Star Forming Galaxies at 1 < z < 6
⋆
Lise Christensen†
1,2, Johan Richard
3,1, Jens Hjorth
1, Bo Milvang-Jensen
1,
Peter Laursen
4,1, Marceau Limousin
5, Miroslava Dessauges-Zavadsky
6,
Claudio Grillo
1,2, Harald Ebeling
71Dark Cosmology Centre, Niels Bohr Institute, University of Copenhagen, Juliane Maries Vej 30, 2100 Copenhagen, Denmark 2Excellence Cluster Universe, Technische Universit¨at M¨unchen, Bolzmanstrasse 2, 85748 Garching, Germany
3Centre de Recherche Astrophysique de Lyon, Universite Lyon 1, Observatoire de Lyon, 9 Avenue Charles Andre, 69561 Saint Genis Laval cedex, France 4Oskar Klein Centre, Dept. of Astronomy, Stockholm University, SE-10691 AlbaNova, Stockholm, Sweden
5Aix Marseille Universit´e, CNRS, LAM (Laboratoire d’Astrophysique de Marseille) UMR 7326, 13388, Marseille, France 6Observatoire de Gen`eve, Universit´e de Gen`eve, 51 Ch. des Maillettes, 1290 Sauverny, Switzerland
7Institute for Astronomy, University of Hawaii, 2680 Woodlawn Drive, Honolulu, HI 96822, USA
Accepted 2012 August 29. Received 2012 August 28
ABSTRACT
We present VLT/X-shooter spectra of 13 galaxies in the redshift range 1 ∼< z ∼< 6, which
are strongly lensed by massive galaxy clusters. Spectroscopic redshifts are measured for nine galaxies, while three sources have redshifts determined from continuum breaks in their spec-tra. The stellar masses of the galaxies span four orders of magnitude between 107
and 1011
M⊙and have luminosities at 1500 ˚A rest-frame between 0.004 and 9 L∗after correcting for
the magnification. This allows us to probe a variety of galaxy types from young, low-mass starburst galaxies to massive evolved galaxies. The lensed galaxies with stellar masses less than 1010M⊙have a large scatter compared to the fundamental relation between stellar mass,
star formation rates and oxygen abundances. We provide a modified fit to the fundamental relation for low-mass, low-metallicity galaxies with a weaker dependence of the metallic-ity on either the star formation rate or stellar mass compared to low-redshift, high-mass and high-metallicity SDSS galaxies.
Key words: galaxies: high-redshift – galaxies: distances and redshifts – galaxies: evolution
– galaxies: abundances – Physical data and processing: gravitational lensing
1 INTRODUCTION
Strong gravitational lensing is an important tool for characterising the dark matter distribution and formation of large mass concentra-tions in aΛCDM framework. Since massive galaxy clusters give
rise to magnification factors of 10–50 of background galaxies, as well as stretching the source images into extended arcs, lensing can be used to characterise the physical properties of intrinsically sub-luminous galaxies and investigate spatially resolved properties of high-redshift galaxies (Swinbank et al. 2007). Gravitational lens-ing is also valuable for locatlens-ing z > 6 galaxies (Bradley et al.
2008; Richard et al. 2011b; Zitrin et al. 2012a) and investigate
in-⋆ Based on data from the X-shooter GTO observations collected at the
Eu-ropean Southern Observatory VLT/Kuyuen telescope, Paranal, Chile, under programme IDs: 084.B-0351(D), 086.A-0674(A), 086.A-0674(B), 087.A-0432(A) and 087.A-0432(B). Based on HST general observer programmes GO-10491, GO-11103, and GO-12166.
† lise@dark-cosmology.dk
dividual galaxies which may be representative of those responsible for reionisation.
The Lyman break technique by construction selects galaxies with similar characteristics, such that their stacked spectra can be analysed (Shapley et al. 2003). Individual galaxies are too faint for spectroscopic studies with reasonable use of telescope time, apart from unusually bright Lyman break galaxies (LBGs) (Erb et al. 2010). Other selection techniques have been used to study the fainter end of the high redshift galaxy luminosity function, includ-ing Lyα emitters (e.g. Fynbo et al. 2003; Nilsson et al. 2011) or
host galaxies of gamma-ray bursts (e.g. Hjorth et al. 2012). How-ever, they fail to reach the same level of detail because of the large amount of telescope time needed. Our current understanding of the physical properties of high-redshift galaxies is therefore limited to a small range in absolute magnitude.
Gravitational lensing allows us to study intrinsically fainter galaxies with unusual spectral characteristics at any given redshift, although most lensed galaxies studied in detail to date still belong
to the high-mass, high-luminosity end. A few cases have provided a great deal of insight into the physical properties of individual
z = 2-3 galaxies, with the prime example being the lensed galaxy
MS 1512-cB58 (Pettini et al. 2000; Teplitz et al. 2000; Pettini et al. 2002). The past few years have seen a steady increase in the number of spectroscopic observations of lensed galaxies at z ∼ 2 either detected serendipitously or in large dedicated surveys
(Fosbury et al. 2003; Cabanac et al. 2005; Swinbank et al. 2007; Allam et al. 2007; Stark et al. 2008; Lin et al. 2009; Diehl et al. 2009; Bian et al. 2010; Rigby et al. 2011; Richard et al. 2011a; Wuyts et al. 2012b). Whereas somez = 2 lensed galaxies are
eas-ily investigated with low-resolution spectra from 8-m class tele-scopes, few are sufficiently bright for medium- or high-resolution spectroscopy, which is necessary for examining the interstellar medium of the galaxy. Rest-frame UV absorption line spectra al-low a detailed analysis of the interstellar medium of galaxies with intrinsically very high star formation rates (Cabanac et al. 2008; Quider et al. 2009, 2010; Dessauges-Zavadsky et al. 2010).
As the redshift aroundz ∼ 2 represent the era of the peak
of the star formation, the lensed galaxies are relevant to compare to scaling relations found in other galaxy samples, such as mass-metallicity relations (Tremonti et al. 2004). Recently, a fundamen-tal relation between the mass, mefundamen-tallicity and SFR has been found. The relation has been calibrated for metal-rich (oxygen abundances 12+log(O/H)>8.2), and relatively massive galaxies (stellar masses
above109.2 M⊙) atz < 0.1 (Lara-L´opez et al. 2010). At higher
redshifts up toz ≈ 2.5 and for galaxies with lower metallicities the
relation appears to still hold (Mannucci et al. 2010). Strong grav-itational lensing of intrinsically fainter and less massive galaxies allows us to explore the fundamental relation at even lower masses and metallicities. Richard et al. (2011a) and Wuyts et al. (2012b) analysed the rest-frame optical emission lines of lensed galaxies at
z = 1 − 3 with intrinsic low luminosities (0.1 L∗
) and showed that the galaxies are more metal-rich than predicted from extrapolations of mass-metallicity relations.
In this paper, we present shallow spectroscopic observations from VLT/X-shooter of 13 lensed galaxies selected towards mas-sive galaxy clusters at z ∼ 0.4. Section 2 presents the data and
Section 3 notes on each target and their redshift determination. In Section 4 we explore the galaxy properties from their continuum while in Section 5 we derive physical properties based on their emission lines. In Section 6 we present an extension of the cal-ibration at the low-mass, low-metallicity end of the fundamental relation for star forming galaxies. Section 7 presents a summary.
2 OBSERVATIONAL DATA
One of the science goals for the 2ndgeneration VLT instrument X-shooter is to determine redshifts for faint single targets and analyse emission line galaxies atz > 1. X-shooter is a multi-wavelength
cross-dispersed echelle spectrograph which splits up the light by dichroics into three arms: UV-blue (UVB), which covers 3000– 5600 ˚A, visible-R (VIS), which covers 5600–10000 ˚A, and near-IR (NIR), which covers from 1 to 2.5 micron (D’Odorico et al. 2006; Vernet et al. 2011). The slit length of X-shooter is 11′′and the cho-sen slit widths determine the spectral resolution. For the observa-tions the slit widths were set to match the optical seeing measured at the telescope as listed in Table 1. Slit widths of 1.0/0.9/0.9 arc-sec in the UVB, VIS, and near-IR arms, give spectral resolutions of 5100, 8800, and 5600 respectively, while for the 1.3/1.2/1.2 arcsec slit widths, the resolutions are 4000, 6700, and 4300. For all the
observations, the UVB CCD was read out binned by a factor of two in the dispersion direction.
The instrument has proven to be useful for the study of gravita-tional lensed galaxies due to its complete wavelength coverage and high sensitivity throughout the spectral range. Physical properties of lensed galaxies can be derived from short exposures as demon-strated from commissioning data (Dessauges-Zavadsky et al. 2010; Pettini et al. 2010; Christensen et al. 2010). A wealth of infor-mation of the physical properties of galaxies can be gained from the full medium-resolution UV- to near-IR spectral cov-erage for both lensed galaxies such as the 8 o’clock arc (Dessauges-Zavadsky et al. 2010, 2011) or even fainter gamma-ray burst (GRB) host galaxies (Kr¨uhler et al. 2012). With the large wavelength coverage, X-shooter is also ideal to determine faint galaxy redshifts, which is necessary to construct the lens models (e.g. Grillo & Christensen 2011). Due to the simultaneous cover-age, there are no random offsets in the placement of the slit be-tween the three arms, which could be a problem for optical spec-tra and near-IR specspec-tra obtained with different instruments. Such offsets could introduce differences in the flux levels between the UV and near-IR galaxy spectra which are difficult to correct for unless the continuum emission is well detected and can be com-pared with broad-band photometry. In addition, systematic errors in wavelength calibrations could be interpreted as kinematic effects such as outflows. X-shooter is therefore ideal for the combined pur-pose of determining redshift for faint, lensed sources, and allow a characterisation of the physical nature of the lens galaxies.
Accurate mass models of the lensing clusters are required in order to turn them into well-calibrated gravitational telescopes because of the degeneracy between the source redshift and lens mass. To determine redshifts of lensed galaxies does not require high signal-to-noise ratio spectra, and since the UV- selected high-redshift galaxies are expected to be star-forming, and therefore have emission lines that are much stronger than the underlying continuum, a redshift determination can be obtained even for faint (m = 25) galaxies with a short integration time. With fairly short
exposures, we can pinpoint interesting targets for deeper follow-up studies.
2.1 Target selection
Some of the best calibrated cluster lenses are thez < 0.3 Abell
clusters. In this paper, we present spectra of galaxies without pre-viously determined spectroscopic redshifts lensed by Abell 1689, where we aim to determine spectroscopic redshift for galaxies which previously only had photometric redshifts. Partly, we focus on the second large-scale dark matter concentration in the North-East quadrant of the cluster (Limousin et al. 2007), such that the galaxy scale mass substructure can be better constrained in this re-gion.
We also choose to study galaxies lensed by higher redshift clusters. We select targets belonging to the MAssive Cluster Sur-vey (MACS), which are massive X-ray luminous clusters at0.3 < z < 0.7 (Ebeling et al. 2001), and include observations of the
southern equivalent to the MACS with declinations< –40 deg (H.
Ebeling, unpublished). These targets are denoted with the prefix SMACS. Some of the targets are also included in the CLASH sur-vey (Postman et al. 2012), allowing us to investigate in detail galax-ies for which high-quality, high-resolution images are available. Al-though the 16-broad band filter imaging allows detailed investiga-tions of the spectral energy distribution of the galaxies and their spatially resolved properties, more accurate information can be
ob-tained by spectroscopic follow-up observations. The target galaxies are selected from having high total brightness, and from those we investigate regions with the highest surface brightness. This im-plies that we preferentially select UV bright galaxies that are ex-pected to show significant emission lines, because the high surface brightness regions are HIIregions. Thereby, we can most easily de-termine redshifts for the faintest galaxies, and also investigate the kinematics and metal abundances in the emission line regions.
2.2 Spectroscopic observations and data reduction
The observations were done as a part of the X-shooter consortium guaranteed observing time during several different runs in 2010– 2011. A log of the observations can be found in Table 1. The names of the arcs targeted for the spectroscopic analysis are hereafter shortened, such that the names reflect the cluster name only for the MACS clusters, i.e. the arc observed in SMACS J0304.34402 is named M0304, and the arcs in Abell 1689 are denoted ’A’ plus by their IDs, e.g. A4.1. In Table 1 and hereafter we adopt the im-age IDs from Limousin et al. (2007) for Abell 1689 imim-ages, IDs for M0329 in Zitrin et al. (2012a), IDs for M1206 from Zitrin et al. (2012b), and the ID for M2129 in Zitrin et al. (2011).
For target acquisition, relative offsets from bright stars were used, so the location of the target on the slit depends on the accu-racy of the known star coordinates relative to the targets. The slit position angle was not preferentially chosen along the long axis of the extended arcs. In most cases, we chose a perpendicular angle such that nodding the target along the slit would improve the resid-uals from sky emission line subtraction. Further, the angle was cho-sen to avoid nearby objects. The orientations of the slits are over-layed on the panels in Fig. 1. A different procedure was used dur-ing the first run, when the Abell 1689 cluster arcs were observed, where we opted for longer time on target in stare-mode and did not move the target along the slit. In addition, two arcs from different sources were inside the slit. Whereas this procedure did allow us to determine the arc redshifts, the quality of the near-IR spectra after the data reduction was dominated by errors in sky subtraction, in particular near sky emission lines. No separate sky exposures were obtained.
The data was reduced with the ESO pipeline version 1.3.7 (Goldoni et al. 2006; Modigliani et al. 2010) using the physical model reduction chain (Bristow et al. 2008) in both nodding and staring mode. The data reduction works in a similar way for the three arms. First, the bias level is subtracted from the UVB and VIS data (dark current in the case of the near-IR data). The position of the orders on the detectors were traced and a two-dimensional flat field was created. Then a two-dimensional wavelength solution was determined from calibration frames taken the day after the observa-tions. Cosmic rays were rejected from the science frames using the LA Cosmic procedure (van Dokkum 2001) within the pipeline. Fi-nally, the echelle orders were extracted, rectified and merged onto a two-dimensional spectrum using the errors as weights for the re-gion of the overlap between the different orders.
2.3 Further data processing
The data from the pipeline needed a few more processing steps before a full analysis could be done. To determine spatial off-sets along the slit between each exposure, one could rely on FITS header information, or measure offsets directly from the data. We chose the latter, but because the continuum emission was very faint,
this was only possible after binning the 2D data as described in section 2.3.1. Individually reduced two-dimensional spectra were combined using their errors as weights.
One-dimensional spectra were extracted by co-adding rows of data. For each object, the apertures were chosen visually from the binned 2D spectra with an aperture size matching for the three arms. Typically, an aperture size of 1–2′′
was used. Source 8.1 in Abell 1689, where the X-shooter slit was oriented along the arc, was noticeably more extended in the 2D spectrum, and an aperture of 4′′
was used.
Flux calibration was performed with standard procedures in IRAF. Observations of various spectrophotometric standard stars (GD 71, LTT 3218, and EG 274) with a 5′′
wide slit taken at the night of the observations were used to calibrate the transmission in each of the arms. Reference fluxes for these stars covering the UV to the near-IR were taken from Bohlin et al. (2001) and Vernet et al. (2008). A correction for an average atmospheric extinction mea-sured at Paranal (Patat et al. 2011) was applied to the data. M1206, M1311, M2031, and M2129 were observed in non-photometric conditions. Since the fluxes in the X-shooter spectrum were cor-rected to absolute values by the magnitudes measured in HST im-ages, flux calibration errors would be partly mitigated as the line fluxes were corrected for slit losses. Even though the slit orientation was not equal to the parallactic angle, differential slit losses should be minor effect, since X-shooter has an atmospheric dispersion cor-rector in the UVB and VIS arms. The near-IR arm does not have a corrector for atmospheric dispersion, but since the observations were done at airmasses below 1.6 the effect was also minor. The X-shooter pipeline gives as an output the wavelength solution mea-sured in air, which we correct to vacuum heliocentric frame before deriving redshifts. Finally, the spectra were corrected for Galactic reddening using the dust maps of Schlegel et al. (1998).
The extracted and flux-calibrated spectra show small offsets in the continuum flux between the different arms. In particular, the VIS to the near-IR differ by 10–20% in some cases, but given the low signal-to-noise ratios of the spectra, the flux levels were not ad-justed. The continuum emission follows the expectations over the entire wavelength range as illustrated in Fig. 2. In addition to these small offsets, the flux calibration showed increased errors at the edges of the spectral ranges in each arm, where the total transmis-sion is very small due to the dichroic crossover between the arms. The spectra in these affected regions are excluded in Fig. 2.
Emission lines were identified by visual inspection, and line fluxes were measured withngaussfitwithin IRAF, assuming that the line profiles have a Gaussian shape. In some cases of very strong lines, the lines are clearly not Gaussian, but can be fit well with a combination of two Gaussian functions (see also Pettini et al. 2010; Christensen et al. 2010). In those cases the listed fluxes correspond to the sum of the two components. Uncertain-ties of the line width, height, and continuum level are propagated for the derivation of emission line flux uncertainties. Some of the faintest lines have a more uncertain determination of the peak emis-sion wavelength, which implies an apparent shift in redshift com-pared to the brightest lines. The shifts can be up to ∼100 km s−1, but are unphysical if we assume that the lines arise in the same medium. We determine source redshifts from the mean weighted by the line flux, which overcomes the problem of the small variation of redshift. Balmer emission lines are affected by underlying stellar absorption. In order to correct for this, we subtracted a stellar pop-ulation model described in Sect. 4.1 from the galaxy spectrum to get a pure emission line spectrum before fitting the emission lines. Removal of telluric absorption lines for the low
signal-to-Figure 1. Thumbnail HST images of the clusters around the targeted sources. The images were taken with ACS, WFPC2 or WFC3 with either the F606W, F814W or F110W filters, and obtained through the MAST or HLA data archive (http://hla.stsci.edu/). The images have varying sizes between 40 and 90 arcsec on a side with the orientation North up and East left, and with the X-shooter 11′′slit position indicated.
Table 1. Observing log
Cluster Arc ID RA (J2000) Dec (J2000) Slit angle Slit widths UVB/ VIS/ NIR exposures Date (deg) (′′) (s) Abell 1689 4.1 13:11:32.17 –01:20:57.3 –19.4 1.3/1.2/1.2 2×3000 / 2×3000 / 6×520 22–03–2010 Abell 1689 8.1 13:11:32.30 –01:20:50.8 Abell 1689 9.1 13:11:30.30 –01:19:48.33 18.8 1.3/1.2/1.2 2×3000 /2×3000 / 6×520 22–03–2010 Abell 1689 31.1 13:11:30.42 –01:19:51.5 SMACS J0304.3–4402 1.1 03:04:20.29 –44:02:27.8 90 1.0/0.9/0.9 4×900 /4×900 / 4×900 30–08–2011 MACS J0329.6–0211 1.2 03:29:40.18 –02:11:45.8 112 1.0/0.9/0.9 4×1200 /4×1200 / 4×1200 30–08–2011 SMACS J0359.2–7205 1.1 03:59:13.46 –72:05:14.6 49 1.0/0.9/0.9 3×900 /3×900 / 3×900 30–08–2011 MACS J0416.1–2403 1.1 04:16:09.85 –24:03:42.5 –160 1.0/0.9/0.9 8×800 /8×770 / 8×900 13–01–2011 MACS J1115.8+0129 1.1 11:15:51.40 01:29:36.6 –30 1.0/0.9/0.9 4×800 /4×770 / 4×900 12–01–2011 MACS J1206.2–0847 2.1/3.1 12:06:14.47 –08:48:33.3 40 1.3/1.2/1.2 4×1070 / 4×1100 / 4×1200 03–04–2011 MACS J1311.0–0310 1.1 13:11:01.37 –03:10:50.3 90 1.0/0.9/0.9 4×800 / 4×770 / 4×900 03–04–2011 SMACS J2031.8–4036 1.1 20:31:52.89 –40:37:32.6 0 1.0/0.9/0.9 4×800 / 4×770 / 4×900 11–10–2010 MACS J2129.4–0741 1.5 21:29:26.07 –07:41:41.6 0 1.0/0.9/0.9 4×800 / 4×770 / 4×900 11–10–2010
noise ratio data increases significantly the noise in the data. Instead of correcting the full one-dimensional spectra, which would intro-duce additional errors in the spectra, we chose to correct only the emission line fluxes individually when necessary. To correct for this absorption, we used data of bright, hot stars, observed immediately before or after the science exposure and at the same airmass. The instrument setup was the same, and the data were reduced in the same way as the science frames. A one-dimensional spectrum of the star was extracted, normalised, and the 1D science spectrum di-vided by this normalised spectrum. Regions where the atmospheric transmission was less than 5% was set to zero, and when fitting emission lines, these regions were excluded.
2.3.1 Optimal 2D spectral binning
Observations in the near-IR from the ground are heavily affected by the strong sky emission lines which vary with time. However, blue-wards of 2.2 micron, the continuum emission from the sky between the sky lines presents a minor contribution. This is the purpose of the design of X-shooter; at a sufficiently high spectral resolution, one can eliminate the regions of sky lines, and co-add the remaining part of the spectrum to obtain a much deeper detection limit than would otherwise have been possible as long as the detector read noise does not dominate over the background sky emission.
With this basic principle, we can use the X-shooter data to detect very faint objects. In practise, we take the 2D spectra and the associated 2D error spectra and bin the data by any required amount using a weighted mean algorithm. This binning effectively smoothes out any spectral characteristics, so depending on the type of investigation, we choose a binning factor between 1 ˚A/pixel (for investigating absorption lines and very weak emission lines), and
∼200 ˚A/pixel (for investigating the continuum emission from the
faintest targets). The latter flux calibrated one-dimensional spectra for the arcs are presented in Fig. 2.
2.4 High resolution images
Since the targets are lensed by well-studied massive galaxy clus-ters, most of these have extensive high spatial resolution images al-ready available in the HST archive. Both deep and snapshot images with the WFPC2, ACS or WFC3 instruments have been taken. We obtained these images from the HST archive, and used SExtractor (Bertin & Arnouts 1996) to derive the photometry of the sources as listed in Table 2. Up to date zeropoints were used, and the fluxes were corrected to total magnitude measured in the detection band (I band). For the most extended arcs SExtractor was first used to
subtract the extended emission from brighter galaxies in the field to create a residual image free of emission from the lens galaxies. Then we defined a polygon around the extended arc in the deep-est image and derived the magnitude in the other filters using the same polygon as reference. The photometric uncertainties were de-termined from from photon noise measured in the original images before drizzling. In the case of Abell 1689 ID 9.1, the photometry was defined for a point source as the 3σ limiting magnitude in the
measured aperture.
2.4.1 Slit losses
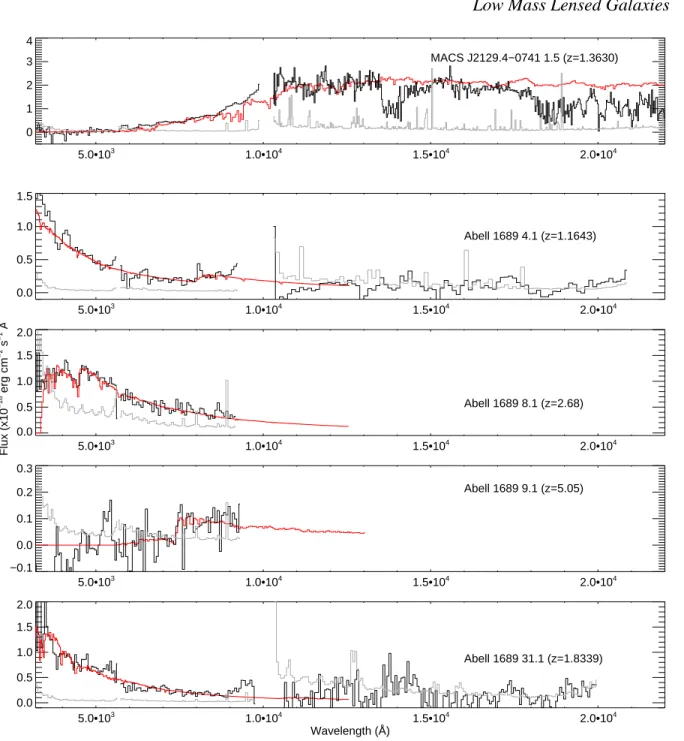
Besides the loss of flux in slit spectra since some emission fall out-side the slit due to the seeing effects and inaccuracy of the center-ing on the slit, the lensed images also experience slit losses due to
Table 3. Lens image slit loss- and image magnification factors,µ
Lens image ID fslit µ
Abell 1689 4.1 2.7±0.1 23.0±3.4 Abell 1689 8.1 2.9±0.7 38.9±4.0 Abell 1689 9.1 1.0±0.1 12.7±2.8 Abell 1689 31.1 1.7±0.1 26.6±3.1 SMACS0304 1.1 3.0±0.1 42.0±8.0 SMACS0359 1.1 3.0±0.1 18.0±6.0 MACS0416 1.1 2.6±0.3 4.6±0.2 MACS1115 1.1 5.0±1.7 16.3±1.4 MACS1206 2.1 5.1±0.2 9.2±0.6 MACS1311 1.1 12.7±5.3 28.0±12.0 SMACS2031 1.1 4.2±0.3 15.8±7.0 MACS2129 1.5 2.1±0.1 9.4±2.0
their extended and arc-like nature. Some of the observed images appear as compact sources even though they are stretched by the lensing effects, while other images are very extended low surface brightness arcs. Therefore we determine in each case the fraction of light falling within the slit relative to the total flux in each band. The flux-calibrated spectrum is multiplied with the respective filter transmission function to derive the magnitude and the slit losses are calculated for each filter. The final, wavelength-independent correc-tion factor to be applied to the spectra, is the weighted average of the factors in all measured bands,fslit, as listed in Table 3, where the weight in each band determined from the sum of the square of the photometric uncertainties in Table 2 and the uncertainty derived from the associated one-dimensional error spectrum.
Properties derived from spectra obtained in non-photometric conditions are partly recovered from the correction of slit losses, since the method we adopt does not discriminate between losses of light falling outside the slit or loss of light due to absorption by clouds. However, since we only apply a constant offset to the flux calibration, a wavelength-dependent error caused by the non-photometric conditions could be introduced. Also, galaxies have colour gradients, but we do not include corrections based on these gradients in this investigation.
2.5 Lens models
High spatial resolution images are crucial information for the anal-ysis of gravitational lensing. The relative projected positions of the lens and source galaxies along with spectroscopic (or photometric) redshifts are necessary ingredients to determine the total mass dis-tribution of the lenses. The lens models allow us to reconstruct the original images of the galaxies in the source plane before lensing, to derive their radius, which is essential to derive dynamical masses.
In this paper, we use mass models constructed using the Lenstool software (Jullo et al. 2007)1 based on the multiple im-ages observed in the HST imim-ages. The detailed Lenstool model of A1689 has been published by Limousin et al. (2007) and the mod-els for the MACS clusters will be presented mod-elsewhere (Richard et al. in preparation). We summarise here the main ingredients of the models. Our starting point is the set of multiple systems identified in the HST images (between 1 and 7 systems) which complete the ones presented by other groups (Ebeling et al. 2009;
5.0•103 1.0•104 1.5•104 2.0•104 0 5 10 15 20 MACS J0304.3−4402 1.1 (z=1.9634) 5.0•103 1.0•104 1.5•104 2.0•104 0 2 4 6 8 SMACS J0359.2−7205 (z=1.0272) 5.0•103 1.0•104 1.5•104 2.0•104 0.0 0.5 1.0 1.5 MACS J0416.1−2403 1.1 (z=1.8960) 5.0•103 1.0•104 1.5•104 2.0•104 −0.1 0.0 0.1 0.2 0.3 0.4 MACS J1115.8+0129 1.1 (z=0.58) 5.0•103 1.0•104 1.5•104 2.0•104 −0.2 0.0 0.2 0.4 0.6 0.8 1.0 MACS J1206.2−0847 2.1 (z=3.0385) 5.0•103 1.0•104 1.5•104 2.0•104 0.0 0.2 0.4 0.6 0.8 Flux (x10 −18 erg cm −2 s −1 Å MACS J1311.0−0311 (z=1.1043) 5.0•103 1.0•104 1.5•104 2.0•104 Wavelength (Å) 0 1 2 3 4 5 SMACS J2031.8−4036 1.1 (z=3.5073)
Figure 2. Binned source spectra with the best fit spectral templates overplotted by the red lines (Sect. 4.1). The grey lines are the error spectra. Regions with very noisy data are omitted, both in the fitting and in the display. In particular, wavelengths at 1µm between the VIS and the near-IR arm are dominated by uncertainties in the flux calibration. See the electronic issue of the paper for a colour version of this figure.
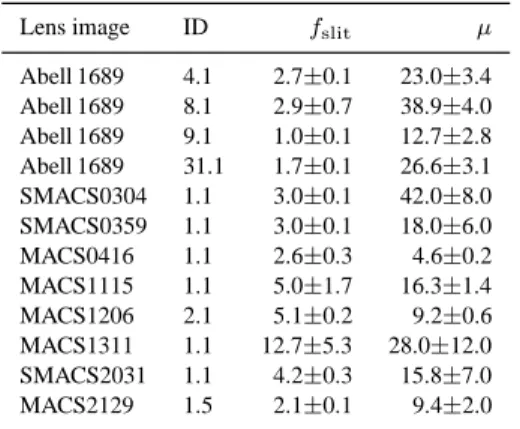
5.0•103 1.0•104 1.5•104 2.0•104 0 1 2 3 4 MACS J2129.4−0741 1.5 (z=1.3630) 5.0•103 1.0•104 1.5•104 2.0•104 0.0 0.5 1.0 1.5 Abell 1689 4.1 (z=1.1643) 5.0•103 1.0•104 1.5•104 2.0•104 0.0 0.5 1.0 1.5 2.0 Flux (x10 −18 erg cm −2 s −1 Å Abell 1689 8.1 (z=2.68) 5.0•103 1.0•104 1.5•104 2.0•104 −0.1 0.0 0.1 0.2 0.3 Abell 1689 9.1 (z=5.05) 5.0•103 1.0•104 1.5•104 2.0•104 Wavelength (Å) 0.0 0.5 1.0 1.5 2.0 Abell 1689 31.1 (z=1.8339)
Figure 2. – continued. The continuum emission in the near-IR for the Abell 1689 arcs, is considerably more noisy compared to the other spectra due to increased sky subtraction errors.
Zitrin et al. 2011; Zitrin et al. 2012b,a). The majority of these sys-tems have been confirmed with a measured spectroscopic redshift, including the ones obtained from X-shooter and presented in this paper. We use the positions and redshifts of these systems to con-strain a multi-component mass distribution described as a paramet-ric model, including both cluster-scale and galaxy-scale compo-nents (see Richard et al. 2010, for more details). The Monte-Carlo Markov Chain sampler created by Lenstool provides us with a fam-ily of best models fitting the constraints, allowing us to derive for each parameter its 1σ error bar. The estimate on the
magnifica-tion factors and their corresponding errors are provided for each target in Table 3. In the case of SMACS0304, the uncertainty in the cluster redshift (estimated between 0.3 and 0.5) is taken into account when deriving the magnification factor of the target 1.1 in
this cluster. With the information of the total flux from the galaxies including the effect of magnification and slit losses, we can derive the absolute properties of the galaxies.
3 SOURCE SPECTRA
In this section we present notes for each of the observed arcs. Ta-ble 4 summarises the measured redshifts for the arcs from emission and absorption lines, as well as redshifts derived from breaks in highly binned spectra, when no clear emission or absorption lines could be distinguished. Individual tables in this section list the de-tected emission lines and their fluxes uncorrected for magnification or slit losses. Typically, only few absorption lines are found by
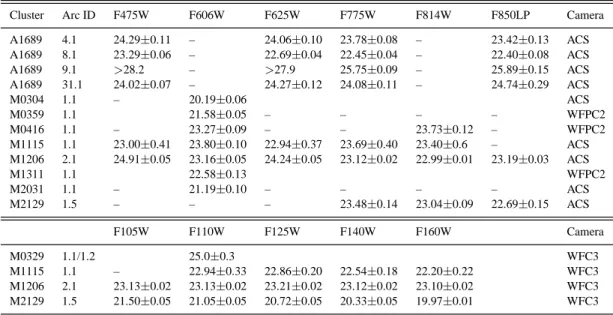
vi-Table 2. Total AB magnitudes of the arcs.
Cluster Arc ID F475W F606W F625W F775W F814W F850LP Camera A1689 4.1 24.29±0.11 – 24.06±0.10 23.78±0.08 – 23.42±0.13 ACS A1689 8.1 23.29±0.06 – 22.69±0.04 22.45±0.04 – 22.40±0.08 ACS A1689 9.1 >28.2 – >27.9 25.75±0.09 – 25.89±0.15 ACS A1689 31.1 24.02±0.07 – 24.27±0.12 24.08±0.11 – 24.74±0.29 ACS M0304 1.1 – 20.19±0.06 ACS M0359 1.1 21.58±0.05 – – – – WFPC2 M0416 1.1 – 23.27±0.09 – – 23.73±0.12 – WFPC2 M1115 1.1 23.00±0.41 23.80±0.10 22.94±0.37 23.69±0.40 23.40±0.6 – ACS M1206 2.1 24.91±0.05 23.16±0.05 24.24±0.05 23.12±0.02 22.99±0.01 23.19±0.03 ACS M1311 1.1 22.58±0.13 WFPC2 M2031 1.1 – 21.19±0.10 – – – – ACS M2129 1.5 – – – 23.48±0.14 23.04±0.09 22.69±0.15 ACS F105W F110W F125W F140W F160W Camera M0329 1.1/1.2 25.0±0.3 WFC3 M1115 1.1 – 22.94±0.33 22.86±0.20 22.54±0.18 22.20±0.22 WFC3 M1206 2.1 23.13±0.02 23.13±0.02 23.21±0.02 23.12±0.02 23.10±0.02 WFC3 M2129 1.5 21.50±0.05 21.05±0.05 20.72±0.05 20.33±0.05 19.97±0.01 WFC3
Table 5. Emission lines from the A1689 arc ID 4.1
line λra λobs z fluxb
[OII] 3727.09 8066.41 1.16427 11.8±0.2 [OII] 3729.88 8072.44 1.16426 15.6±0.2 [NeIII] 3869.84 8375.75 1.16436 3.7±0.5 Hδ 4102.92 8880.27 1.16438 1.8±0.6 Hγ 4341.69 9396.41d 1.16423 5.7±1.1 [OIII] 4960.29 10735.74c 1.16434 15.4±1.9 [OIII] 5008.24 10840.01c 1.16444 39.8±2.4 Hα 6564.63 14208.28d 1.16437 51.5±4.4 Notes.
aRest-frame vacuum wavelengths.
bEmission line flux in units of10−18erg cm−2s−1. cClose to sky line.
dAffected by strong telluric absorption lines.
sual inspection for some of the galaxies, because the S/N level in the continuum is low, and the absorption redshift corresponds to the average of the detected lines. As a consequence of the low S/N levels, the uncertainties of the absorption line redshifts are higher than those based on emission lines.
3.1 Abell 1689 arc ID 4.1
Two different lensed images (source IDs 4.1 and 8.1) were placed within the X-shooter slit. The names of the sources are adopted from Limousin et al. (2007). Source ID 4.1 is reported to havez = 1.1648 (Jullo et al. 2010), and is located at the lower edge of the
slit during the observations, and sky subtraction errors are high in the near-IR arm. From the flux-weighted average of the emission lines in Table 5, we measure the redshiftz = 1.1643 ± 0.0001.
Among the other strong optical emission lines that fall within the spectral range, Hβ is behind a strong sky-line, the
[NII]λλ6548,6583 and [SII]λλ6717,6730 doublets are affected
by telluric absorption lines so their fluxes are below the detection limit.
In the 2D spectrum we detect the emission from a third
ob-ject located 2′′
north of A4.1. An extended early type galaxy is located at RA = 13:11:32.14, DEC = –01:20:55.33 (J2000) in the ACS image, but it is only partly covered by the slit. After rebin-ning the 2D spectrum a clear break is seen at 4400 ˚A, consistent with a Balmer jump at the Abell 1689 redshift. In the spectrum of the third object we detect the CaIIλλ3934,3639 absorption dou-blet atz = 0.170 and a single emission line at 7682 ˚A consistent with Hα at z = 0.1702.
3.2 Abell 1689 arc ID 8.1 (Giant arc)
Despite being a giant arc, the redshift of image ID 8.1 remains to be measured accurately. Broadhurst et al. (2005) give the best fit pho-tometric redshiftzphot= 2.63 ± 0.48 while Halkola et al. (2006)
findzphot = 3.10 ± 0.89 and Limousin et al. (2007) determine z = 2.30 ± 0.21 based on their lens model.
The object is located at the upper edge of the slit, and is af-fected by sky subtraction residuals, which limit our ability to get redshift information from absorption lines. A faint continuum is detected in the binned 2D spectrum. With a binning factor of 200 and 400 pixels in the UVB and VIS arms respectively, any weak and narrow emission or absorption lines are effectively smoothed out. No emission lines are detected above a 3σ level significance in
the unbinned spectrum.
The binned UVB and VIS spectrum of ID 8.1 is extracted within an 4′′
aperture and displayed in Fig. 2. The flux-calibrated spectrum shows no clear Lyman limit break; however we find in-dications of a break at 4470 ˚A. If we in interpret this break as the onset of the Lyα forest, it implies a redshift of z = 2.68 ± 0.04 by
fitting stellar population synthesis spectra as described in Sect. 4.1. The lack of a detected Lyman limit break is due to the high noise level at wavelengths shorter than 3500 ˚A.
3.3 Abell 1689 arc ID 9.1
Source ID 9.1 is recognised as an F625W drop-out in the ACS im-ages, and has a photometric redshift of5.16 ± 0.74 and an AB
magnitude of 25.9 in the F775W band (Broadhurst et al. 2005). Halkola et al. (2006) find a similar photometric redshift 4.97±0.78,
Table 4. Cluster and arc redshifts
Cluster zcluster Arc ID zem zdbreak zabs
A1689 0.181 4.1 1.1643±0.0001a A1689 8.1 2.68±0.04 A1689 9.1 5.05±0.02 A1689 31.1 1.8339±0.0003b 1.8348±0.0012 SMACS J0304.3–4402 0.3–0.5 1.1 1.9634±0.0002 1.9635±0.0005 MACS J0329.6–0211 0.45 1.1/1.2 — SMACS J0359.2–7205 0.296 1.1 1.0272±0.0005 MACS J0416.1–2403 0.420 1.1 1.8960±0.0003 MACS J1115.8+0129 0.355 1.1 0.58±0.02 or 3.51±0.01 MACS J1206.2–0847 0.439 2.1/3.1 3.0385±0.0001c 3.0372±0.0015 MACS J1311.0–0310 0.494 1.1 1.1043±0.00002 SMACS J2031.8–4036 0.331 1.1 3.5073±0.0002 3.5061±0.0013 MACS J2129.4–0741 0.589 1.5 1.3630±0.0004 1.3617±0.0012 Notes.
Cluster redshifts are from Abell et al. (1989) and for M1115 and M1206 in Ebeling et al. (2010), and M2129 in Ebeling et al. (2007). M0359 and M2031 cluster redshifts are based on ESO/EMMI and FORS archive spectra. The redshift of the M0304 cluster is measured from photometry.
Other source spectroscopic redshifts:aJullo et al. (2010) reportz = 1.1648,bBroadhurst et al. (2005) reportz = 1.83,cZitrin et al. (2012b) report
z = 3.033,dRedshifts based on spectral modelling.
while lens models predict a lower redshiftzmodel = 2.69 ± 0.27
(Limousin et al. 2007).
Two sources (IDs 9.1 and 31.1) were located within the X-shooter slit as illustrated in Fig. 1. The spatial offset between source IDs 9.1 and 31.1 projected on the sky is 2.′′
5 as measured in an ACS image. The A9.1 continuum spectrum is faint, and corresponds to an AB magnitude of 26.6 ± 0.4 at ∼8000 ˚A, but is detected in the binned frames illustrated in Fig. 2, where we identify a break at 7381 ˚A. If the break corresponds to the onset of the Lyα forest
it impliesz = 5.05 ± 0.02. No Lyα emission line nor any other
significant spectral features are present at these faint flux levels.
3.4 Abell 1689 arc ID 31.1
The arc ID 31.1 is adopted from Limousin et al. (2007), who argued that the three images of source ID 12 in Broadhurst et al. (2005) are inconsistent with being the same galaxy. The source 31.1 was located close to the edge of the slit, where sky subtraction errors were higher than the average.
A wealth of emission lines are detected as listed in Table 6. Excluding Lyα while weighting the other emission line redshift by
their measured fluxes, we findz = 1.8339 ± 0.0003, consistent
with that reported in Broadhurst et al. (2005) and Limousin et al. (2007). The Lyα line profile is double peaked with a brighter
red than blue component and has an equivalent width of 40 ˚
A. We detect several uncommon emission lines for this source. In particular we draw attention to the OIII] λλ1661,1666 and
CIV λλ1548,1550 doublets, which indicate the presence of a strong ionising source. These lines were also detected in another lensed galaxy (Fosbury et al. 2003; Villar-Mart´ın et al. 2004). The temperature-sensitive [OIII]λ4363 line is rarely detected in
galax-ies atz > 1. Yuan & Kewley (2009) find this line in another lensed
galaxy atz = 1.7, also behind the Abell 1689 cluster. In a separate
paper we present a more detailed analysis of the emission from this unusual galaxy (Christensen et al. 2012).
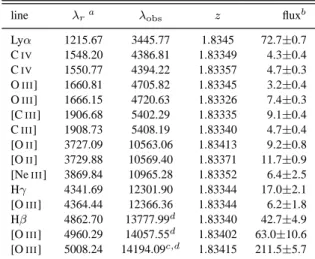
Table 6. Emission lines from the A1689 arc ID 31.1
line λra λobs z fluxb
Lyα 1215.67 3445.77 1.8345 72.7±0.7 CIV 1548.20 4386.81 1.83349 4.3±0.4 CIV 1550.77 4394.22 1.83357 4.7±0.3 OIII] 1660.81 4705.82 1.83345 3.2±0.4 OIII] 1666.15 4720.63 1.83326 7.4±0.3 [CIII] 1906.68 5402.29 1.83335 9.1±0.4 CIII] 1908.73 5408.19 1.83340 4.7±0.4 [OII] 3727.09 10563.06 1.83413 9.2±0.8 [OII] 3729.88 10569.40 1.83371 11.7±0.9 [NeIII] 3869.84 10965.28 1.83352 6.4±2.5 Hγ 4341.69 12301.90 1.83344 17.0±2.1 [OIII] 4364.44 12366.36 1.83344 6.2±1.8 Hβ 4862.70 13777.99d 1.83340 42.7±4.9 [OIII] 4960.29 14057.55d 1.83402 63.0±10.6 [OIII] 5008.24 14194.09c,d 1.83415 211.5±5.7 Notes.
aRest-frame vacuum wavelengths.
bEmission line flux in units of10−18 erg cm−2s−1. cClose to sky line.
dAffected by strong telluric absorption lines.
3.5 SMACS J0304.3–4402 arc ID 1.1
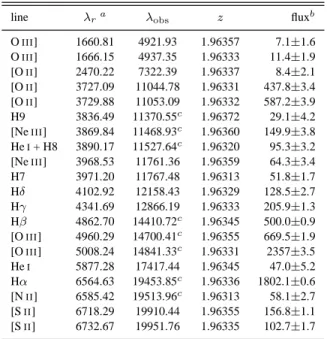
The morphology of the lensed galaxy is complex, and likely con-sists of several components that are in the process of a merger. In each of the lensed image counterparts in the HST image, five indi-vidual regions are visible. The X-shooter spectrum of the source includes three of these regions. Due to blending by the seeing, however, only two regions are spatially distinguishable in the two-dimensional spectrum. Many strong rest-frame optical emission lines are detected from this galaxy atz = 1.9634 ± 0.0002 as
listed in Table 7 including again the OIII]λλ1661,1666 doublet.
The emission lines from the two regions have a velocity offsets of ∼100 km s−1, while the UV continuum appears similar in shape. The emission line fluxes in Table 7 are the total flux in the X-shooter slit summed for the two regions. Even though the
Table 7. Emission lines from the M0304 arc ID 1.1
line λra λobs z fluxb
OIII] 1660.81 4921.93 1.96357 7.1±1.6 OIII] 1666.15 4937.35 1.96333 11.4±1.9 [OII] 2470.22 7322.39 1.96337 8.4±2.1 [OII] 3727.09 11044.78 1.96331 437.8±3.4 [OII] 3729.88 11053.09 1.96332 587.2±3.9 H9 3836.49 11370.55c 1.96372 29.1±4.2 [NeIII] 3869.84 11468.93c 1.96360 149.9±3.8 HeI+ H8 3890.17 11527.64c 1.96320 95.3±3.2 [NeIII] 3968.53 11761.36 1.96359 64.3±3.4 H7 3971.20 11767.48 1.96313 51.8±1.7 Hδ 4102.92 12158.43 1.96329 128.5±2.7 Hγ 4341.69 12866.19 1.96333 205.9±1.3 Hβ 4862.70 14410.72c 1.96345 500.0±0.9 [OIII] 4960.29 14700.41c 1.96355 669.5±1.9 [OIII] 5008.24 14841.33c 1.96331 2357±3.5 HeI 5877.28 17417.44 1.96345 47.0±5.2 Hα 6564.63 19453.85c 1.96336 1802.1±0.6 [NII] 6585.42 19513.96c 1.96313 58.1±2.7 [SII] 6718.29 19910.44 1.96355 156.8±1.1 [SII] 6732.67 19951.76 1.96335 102.7±1.7 Notes.
aRest-frame vacuum wavelengths.
bEmission line flux in units of10−18erg cm−2s−1. cAffected by telluric absorption lines.
Balmer lines are very bright from this source, Lyα emission is
ab-sent, and its (UV) spectrum appears similar to the cB58 spectrum (Pettini et al. 2000). A more detailed investigation is presented in Christensen et al. (2012).
3.6 MACS J0329.6–0211 arc ID 1.1/1.2
The two mirrored lensed images with IDs 1.1. and 1.2, which have a photometric redshift ofz = 6.18+0.07
−0.05(Zitrin et al. 2012a), were
targeted by the observations, which were carried out by both nod-ding and offsetting along the slit. The galaxy has a high surface brightness region at the edges pointing towards each other, and a more elongated lower surface brightness region in the extended arcs. The slit orientation covered only the high surface brightness regions, where the brightest image ID 1.2 has a magnitude of 25.0 AB mag in the F110W image (see Zitrin et al. 2012a, for photo-metric data of all lensed images).
We detect neither emission lines nor the continuum emission even in a highly binned 2D spectrum. With the faintness of the galaxy, we do not expect to detect the continuum emission even with a very large binning factor, but aim instead for a detection of a single emission line. We would be able to detect Lyα in the
VIS arm to a 3σ significance level of 5 × 10⁻¹⁸ erg cm−2s−1 assuming a typical line width of 50 km s−1. We cannot exclude that an emission line happens to fall directly at the wavelength of a strong sky emission line given the uncertainty of the photometric redshift. In that case, the 3σ detection limit could be much higher: ∼2 × 10⁻¹⁶ erg cm−2s−1.
3.7 SMACS J0359.2–7205 arc ID 1.1
Emission lines from this arc are listed in Table 8. No unusual strong UV emission lines are detected even though its low redshift (z =
Table 8. Emission lines from the M0359 arc ID 1.1
line λra λobs z fluxb
[OII] 3727.09 7558.09 1.02788 97.7±3.2 [OII] 3729.88 7560.08 1.02690 137.9±3.4 [NeIII] 3968.53 8048.88 1.02818 5.0±1.7 Hδ 4101.74 8317.41 1.02778 11.0±2.5 Hγ 4341.69 8800.95 1.02708 37.1±1.6 Hβ 4862.70 9856.80 1.02702 95.4±1.4 [OIII] 5008.24 10152.15 1.02709 87.9±4.0 [NII] 6549.91 13276.12c 1.02692 23.8±3.8 Hα 6564.63 13306.85c 1.02705 369.1±0.9 [NII] 6585.42 13348.02c 1.02690 55.4±4.4 [SIII] 9533.20 19324.30c 1.02705 56.4±4.0 Notes.
aRest-frame vacuum wavelengths.
bEmission line flux in units of10−18 erg cm−2s−1. cAffected by telluric absorption lines.
Table 9. Emission lines from the M0416 arc ID 1.1
line λra λobs z fluxb
[OII] 3727.09 10793.11 1.89585 17.2±1.4 [OII] 3729.88 10801.18 1.89585 24.5±1.4 Hβ 4862.70 14081.70c 1.89586 27.4±2.1 [OIII] 4960.29 14367.79c 1.89656 27.2±2.8 [OIII] 5008.24 14503.75c 1.89598 100.2±4.2 Notes.
aRest-frame vacuum wavelengths.
bEmission line flux in units of10−18 erg cm−2s−1. cAffected by strong telluric absorption lines.
1.0272 ± 0.0005) and the wavelength coverage would allow for
detection of the [CIII],CIII] doublet. [OIII]λ4959 lies in a very
noisy region where the transmission of the NIR arm is low and is not detected.
3.8 MACS J0416.1–2403 arc ID 1.1
Emission lines detected from this arc atz = 1.48960 ± 0.0003
are listed in Table 9. Hβ and the [OIII]λλ4959,5007 doublet are
strongly affected by telluric absorption lines, and the correction for the atmospheric absorption implies a correction factor between 3 and 10. The flux uncertainty only reflects the emission line fitting, since the error for the correction for telluric lines is not propagated. Again, no strong UV emission lines are detected, because even the strongest rest-frame optical lines are relatively faint.
3.9 MACS J1115.8+0129 arc ID 1.1
The image of the source is a very low surface brightness arc. The X-shooter slit was oriented across the arc so the slit losses were substantial.
We do not detect any emission lines in either of the arms. The continuum emission is the faintest among our sample, and is only recognisable after binning the spectrum by a factor>20 along the
dispersion. The binned extracted spectrum in Fig. 2 is extracted with an aperture of 1′′.
5. The NIR spectrum is also very faint, but the continuum emission is detected in the binned spectrum although it
20210 20220 20230 20240 20250 Wavelength (Å) 0.0 0.5 1.0 1.5 2.0 0.0 0.5 1.0 1.5 2.0 Flux (x10 −17 erg cm −2 s −1 Å −1 )
Figure 3. Upper panels: Two-dimensional X-shooter spectrum around the single emission line detected for the M1206 source, and the corresponding region around the source in an HST/ACS/F606W image. The two source IDs 2.1 and 3.1 are separated by 2.′′3 and are seen in both panels. Source
2.1 to the North-East in Fig. 1 (upper part in this image) has a compact morphology, and source 3.1 to the South-Western one is more extended. The one-dimensional spectra in the middle and lower panels are extracted for each of the sources and are corrected for telluric absorption lines.
is too faint to be detected in theK band. Between the UVB and VIS
spectra, there appears to be a break, which we can interpret either as the Balmer decrement atz ≈ 0.5, or a higher redshift for the onset
of the Lyα forest at z ≈ 3.5. The exact wavelength of the break
is sensitive to the binning of the data; a smaller binning suggests a higher break wavelength, and thus a higher redshift. Leaving the redshift as a free parameter in HyperZ (Bolzonella et al. 2000), we determine the galaxy redshiftz = 0.58 ± 0.02 or z = 3.51 ± 0.01.
The physical properties of the galaxy derived in Sect. 4 depend on the assumed redshift, and we suggest that the lowest redshift is valid one based on the lensing model.
3.10 MACS J1206.2–0847 arc IDs 2.1 and 3.1
The conditions during the observations were poor with chang-ing seechang-ing and thin cirrus clouds. The slit orientation was chosen such that the two components, denoted by source IDs 2.1 and 3.1 in Zitrin et al. (2012b), which are separated by 2′′.
3, were placed within the slit. The two sources have the same redshift (Zitrin et al. 2012b).
We only detect a single, but remarkably bright emission line at 20220 ˚A, as illustrated in Fig. 3, and a break in the contin-uum around 3700 ˚A. The line is identified as [OIII]λ5007 at z = 3.038. At this redshift, all the other strong rest-frame
opti-cal emission lines ([OII]λλ3727,3730, Hβ, and [OIII]λ4959) fall
at the wavelengths of sky emission lines or are affected by telluric absorption. At weaker significance, we detect absorption lines at
z = 3.0372±0.0015 in the binned spectra illustrated in Fig. 4. The
marked lines are the strongest UV lines detected in other high red-shift galaxies, such as in the cB58 galaxy (Pettini et al. 2002). It ap-pears that Lyα is seen in emission at the red wing of a damped Lyα
absorption trough, however, the emission line is less significant, and cannot be discerned in the unbinned one- or two-dimensional spectra. The inferred redshift is consistent with that measured with low-resolution optical spectra only (Zitrin et al. 2012b).
The emission line profile of the compact north-east image ID 2.1 appears to be double-peaked, while the source ID 3.1 only shows one as illustrated in Fig. 3. The separation of the two
emis-4400 4600 4800 5000 5200 5400 5600 0.0 0.2 0.4 0.6 0.8 1.0 Ly α
SiII 1260 SiII 1304 CII 1334
5600 5800 6000 6200 6400 6600 6800 Wavelength (Å) 0.0 0.5 1.0 1.5 Flux (x10 −18 erg cm −2 s −1 Å −1 )
SIV 1393 SIV 1403 CIV 1548 CIV 1550
Figure 4. Section of the UVB and VIS spectra of the M1206 source ID 2.1 binned by 10 and 20, respectively, to a dispersion of 2.5 ˚A pixel−1. Typical strong UV absorption lines seen in high redshift galaxies are marked at the redshiftz = 3.0385.
Table 10. Emission lines from the M1206 arc. Source IDs are adopted from (Zitrin et al. 2012b).
line λra λobs z fluxb
Source ID 2.1:
[OIII] 5008.24 20217.87 3.03696 83.4±1.4 [OIII] 5008.24 20225.77 3.03854 101.9±1.8 Source ID 3.1: [OIII] 5008.24 20226.02 3.03859 119.7±1.2
Notes.
aRest-frame vacuum wavelengths.
bEmission line flux in units of10−18 erg cm−2s−1.
sion components in the 2.1 source is 7.9±0.3 ˚A corresponding to a velocity separation of 117±5 km s−1.
The emission line fluxes in Table 10 include the uncertainties from fitting Gaussian profiles to the observations, but they do not include the uncertainty due to the non-photometric conditions dur-ing the observations. The line fluxes are derived after correction for telluric lines, which absorb between 40 and 60% of the emission.
3.11 MACS J1311.0–0310 arc ID 1.1
From the emission lines listed in Table 11 we derive a weighted redshift average ofz = 1.10433 ± 0.00002. At this redshift Hα
and [NII] fall in the region between theJ and H bands where
telluric absorption is severe. The observing conditions were non-photometric, which affect the absolute values of the emission lines. We note that the ratios of emission lines is most likely not affected, because the transmission derived from the spectrophotometric stan-dard star observed during the night appeared similar in shape to that of other nights.
3.12 SMACS J2031.8–4036 arc ID 1.1
Several emission lines are detected from this arc as listed in Ta-ble 12, and the flux-weighted average redshift isz = 3.5073 ± 0.0002. Most lines are not affected by telluric absorption, but
Table 11. Emission lines from the M1311 arc
line λra λobs z fluxb
[OII] 3727.09 7843.14 1.10436 8.0±1.3 [OII] 3729.88 7848.85 1.10432 12.0±0.4 Hβ 4862.70 10232.73 1.10433 30.6±2.6 [OIII] 5008.24 10539.05 1.10434 13.9±2.4
Notes.
aRest-frame vacuum wavelengths.
bEmission line flux in units of10−18erg cm−2s−1.
Table 12. Emission lines from the M2031 arc
line λra λobs z fluxb
Lyα 1215.67 5480.80 3.50845 173.7±0.5 NIV] 1486.50 6700.85 3.50780 7.6±0.9 OIII] 1660.81 7485.15 3.50693 2.9±0.6 OIII] 1666.15 7509.46 3.50707 8.8±0.7 [CIII] 1906.68 8594.04 3.50733 12.0±0.5 CIII] 1908.73 8603.54 3.50747 8.4±0.9 [OII] 3727.09 16800.18 3.30759 14.4±1.6 [OII] 3729.88 16811.01 3.50712 15.5±1.3 [NeIII] 3869.84 17442.96 3.50741 14.8±2.1 HI(H7) 3971.20 17898.76 3.50714 6.0±1.0 Hβ 4862.70 21917.47 3.50726 37.7±1.3 [OIII] 4960.29 22357.68 3.50733 61.9±0.9 [OIII] 5008.24 22573.68 3.50731 205.2±0.5 Notes.
aRest-frame vacuum wavelengths.
bEmission line flux in units of10−18erg cm−2s−1.
the flux after the correction is applied. Apart from that, telluric ab-sorption and sky emission lines affect our ability to detect Hγ and
Hδ, which fall in the region between the H and K bands.
Again in this case, the Lyα emission line profile is
double-peaked, and a wealth of information can be derived from the UV emission lines, which is presented in a separate paper (Christensen et al. 2012). The redshift listed in Table 12 for Lyα
reflects the redshift of the bluest wavelength of the red peak as iden-tified by visual inspection.
At the low S/N per pixel in the UVB and VIS arms, we can only identify several Lyman forest absorption lines, and SiIIλ1206 and SIVλλ1394,1403 at z = 3.5. A detailed analysis of the ab-sorption lines requires a spectrum with a higher S/N measured in the continuum.
3.13 MACS J2129–0741 arc ID 1.5
The galaxy cluster MACS J2129.4–0741 atz = 0.589 shows a
galaxy lensed in six distinct images. Zitrin et al. (2011) predict a source redshift ofz = 1.0 − 1.5 based on their lens model. The
galaxy is red, has colours similar to the lens galaxies, and its mor-phology is consistent with being an early type galaxy.
For the X-shooter observations, we targeted the isolated, southern-most image of the six. Although it is not the brightest of the images, source blending and background subtraction is not a problem at this location. In the extracted spectra we find weak oxygen emission lines listed in Table 13. These lines imply a red-shiftz = 1.3630 ± 0.0004. At this redshift, absorption lines from
CaIIλλ3934, 3969 are detected after telluric absorption lines
be-Table 13. Emission lines from the M2129 arc
line λra λobs z fluxb
[OII] 3727.09 8805.93 1.36251 8.6±1.2 [OII] 3729.88 8814.78 1.36315 7.5±1.1 [OIII] 5008.24 11834.63 1.36314 36.5±1.7
Notes.
aRest-frame vacuum wavelengths.
bEmission line flux in units of10−18 erg cm−2s−1.
8000 8500 9000 9500 Wavelength (Å) 0 1 2 3 4 5 Flux (x10 −18 erg cm −2 s −1 Å −1 )
[OII] H10 H9 H8 CaII CaII Hδ
Figure 5. Section of the VIS and near-IR spectra of the M2129 arc ID 1.5 binned to a dispersion of 5.2 and 12 ˚A pixel−1, respectively. Detections of CaII3934,3969 lines and absorption lines from the Balmer series of hydrogen atz = 1.3617 are indicated. Also a faint emission line from the [OII]λ3727 doublet is visible in this binned version.
tween 9300 and 9500 ˚A are corrected for, and several Balmer series absorption lines are also detected (see Fig. 5).
4 PHYSICAL PROPERTIES FROM THE CONTINUUM
EMISSION
In this section we derive physical properties based on the contin-uum spectra from the sources.
4.1 Stellar population fit
To determine the stellar masses of the galaxies, along with other parameters, we use spectral energy distribution fitting (SED) meth-ods. Conventionally, SED fits make use of sparsely sampled photo-metric data from broad or narrow band imaging data, whereas we here are dealing with the entire spectral range from the observed UV to near-IR. Since the spectra have low S/N ratio, we first bin the data by a factor between 100 and 1000, depending on the ini-tial quality of the spectra, giving resolutions in the range ∼20–200. The binned spectra and the associated error spectra are shown in Fig. 2.
We compare the spectra with a large set of model spectra from Bruzual & Charlot (2003). We extract spectral templates with 0.2, 0.4 and 1.0 solar metallicities, and star formation histories de-scribed as an instantaneous burst or exponentially declining star formation rates (SFR) with e-folding time scales of 10, 50, 100, 300, 500, and 1000 Myr, and exponentially increasing SFRs with time scales of 10, 50 and 500 Myr. The initial mass function (IMF) is either a Salpeter (Salpeter 1955), or a Chabrier IMF (Chabrier 2003) with lower and upper mass cutoffs of 0.1 and 100 M⊙,
χ2=X λ
((fobs,λ−fmodel,λ)/σobs,λ)2,
where the sum is taken over all photometric points,λ in the spectra.
In practise, there is no significant distinction between the quality of the fits between the two IMFs. We therefore choose to only use the Chabrier IMF to derive the stellar masses for consistency. If a Salpeter IMF is selected instead, the stellar mass is a factor1.7
higher due to the flattening of the Chabrier IMF below 1 M⊙.
To determine the best fit spectral template, the flux at each (binned) wavelength is converted to an AB magnitude, and we use a modified version of HyperZ (Bolzonella et al. 2000), which al-lows us to include for each object a catalogue which contains up to 500 individual photometric data points. From all the photomet-ric points between 3000–22000 ˚A, we exclude the wavelengths around 1 micron, where the flux calibration causes inaccuracies at the wavelengths where the dichroic splits the light between the VIS and near-IR arms. We also exclude the regions between theJ–H
andH–K bands which are strongly affected by telluric absorption.
HyperZ also allows to determine the best fit reddening as an addi-tional parameter. Here we use a starburst galaxy extinction curve (Calzetti et al. 2000) as input. We do not constrain the reddening with that determined from the Balmer decrements where available (see Sect. 5.2), because the stars may not experience the same amount of reddening as the gas. For starburst galaxies, Calzetti (2001) finds that the radiation from stars and ionised gas experi-ence different extinctions and that the stellar reddening is on the average 44% of that in the gas phase. The flux attenuation blue-wards of Lyα is taken into account using the prescription for the
transmission in the intergalactic medium in Madau (1995). For the galaxies with known spectroscopic redshifts, their redshifts are fixed in the template fitting, while in two cases (MACS 1115 and Abell 1689 ID 8.1), the best fit was also used to derive the photometric redshift. We do not constrain the template metallicities to the ones best matching the nebular abundances de-rived in Sect. 5.4, because these may not be the same, as older stel-lar populations, if present, may have lower metallicities reflecting the lower abundances of the gas at their time of formation. The out-put gives the best fit template which allows us to derive the ages, metallicities, and reddening as listed in Table 14. The best fit spec-tra are overplotted on Fig. 2. One of the outputs of HyperZ is a scaling factorb allowing the galaxy stellar mass to be derived: M∗= b(1 + z)4πD2L/L⊙,bol,
whereL⊙,bolis the solar bolometric luminosity (3.826×1033erg s−1) andDLis the luminosity distance, where we assume a flat cosmology withΩΛ= 0.72 and H0= 73 km s−1Mpc−1. The
de-rived stellar mass is magnification dependent and is sensitive to slit losses. Table 14 lists the corrected stellar masses including the cor-rection factors in Table 3. Uncertainties for the parameters (mass, age, reddening) are determined by adding to the initial spectrum the error spectrum multiplied by a random number normalised to a Gaussian distribution withσ = 1. A thousand fits are performed
for each galaxy spectrum, and the standard deviation of the fitted values are taken as the uncertainties for the parameters.
In all cases the best fit templates are obtained with a model of an instantaneous burst of star formation. Such models are ar-tificial in the sense that this would mean that there is no current on-going star formation, which is not correct because the galaxies show strong emission lines. Other templates that produce accept-able fits are those with a small value ofτ = 10 Myr, while in a
few cases, templates extracted from a constant star formation rate is also a valid solution. In a few cases, an exponentially increasing
SFR also produces an acceptable fit. With these alternative fits the stellar masses remain the same as those listed in Table 14 to within
±10–20% uncertainty.
As usually the case for SED fitting, there is a strong degen-eracy between the age of the stellar population and the reddening. For any given spectrum, a similar good fit can be obtained with a younger population combined with more reddening of the template. The galaxy ages as obtained by the best fits are generally small (∼< 100 Myr), and the reddenings are small as well, such that the
allowed parameter space of reddening-age values is limited. One concern is that, if the ages are underestimated by the SED fit, the stellar masses will be as well. It is common in the literature to only include templates in the SED fits that are older than the typical dy-namical timescale for galaxies, i.e. older than a few 10 Myr (e.g. Wuyts et al. 2012b). For the lensed galaxies in this study, the re-sulting fits when forcing the age to be older than 20 Myr, the fits deteriorate significantly bluewards of the Lyα wavelengths.
Simi-larly, if we fit the spectra with templates of a constant star formation rate and a lower limit for the age of a few times 10 Myr, the fits at UV wavelengths deteriorate, while the rest of the spectrum can be fitted well with an older template. We therefore choose to not con-strain the possible template ages in the fitting. Another issue is that an underlying older stellar population can add to the total stellar mass, while not be detected because it does not contribute signifi-cantly to the UV radiation. Since theK-band fluxes of the galaxies
are small, we argue that a significantly more massive older stellar population is not present. To better constrain the exact masses of an underlying older stellar populations in the galaxies, deep rest-frame near-IR images are needed to fit the SED with a larger wavelength range.
4.2 Absolute magnitudes
A relevant question to ask given the heterogeneous sample, is what their magnitudes are relative to a typical galaxy at the same redshift. To calculate this, we use the best fit model spectrum to derive the magnitudes at rest-frame 1500 ˚A, and compare these to the values ofM∗
AB, which depends on the redshift (Arnouts et al. 2005). We
use the best fit templates, rather than the observed spectra because of the low S/N ratio in the spectra. The resulting absolute magni-tudes and that compared withM∗
AB(z) are listed in Table 15. The
errors reflect the uncertainties in the magnification factor and slit losses.
For the galaxies with a low UV-flux characteristic for an evolved stellar population, neither their UV absolute magnitude nor their UV SFRs derived in Sect. 5.5, are relevant for comparing with star forming galaxies at a given redshift selected in a uniform way from large surveys. When the spectra show evidence for older stellar populations it is more reasonable to compare the relative lu-minosities at rest-frame visual wavelengths. Table 15 lists the ab-solute magnitudes and luminosities of the galaxies at rest-frame 6500 ˚A corrected for magnification and slit losses. Again the best fit template is used to determine the luminosities. For the Abell 1689 targets with poor near-IR spectra, and M2031 atz = 3.5, the
6500 ˚A flux is based on the best fit template spectra at wavelengths redwards of the measured spectrum. The redshift dependent char-acteristic magnitudes (M∗
AB) defined by the luminosity function of
galaxies in the rest-framer′
band are adopted from Gabasch et al. (2006).
Comparing the relative rest-frame UV and optical luminosi-ties, we see that most galaxies are UV bright. This is by selection, since the observations targeted galaxies with both high total
bright-Table 14. Best spectral fit parameters from Sect. 4.1. The masses, SFRs, and magnitudes are corrected for slit losses and lens magnification factors.
Arc Z/Z⊙ Age E(B − V )stars logM∗ UV SFR UV SSFR
(Myr) (mag) (M⊙) (M⊙yr−1) (Gyr−1)
A4.1 0.2 4±3 0.10±0.02 6.97±0.08 0.4±0.1 40±11 A8.1 0.2 4±3 0.07±0.08 7.85±0.15 1.6±0.7 23±11 A9.1 1.0 90±50 0.00±0.02 9.79±0.13 0.6±0.2 0.09±0.04 A31.1 0.2 4±2 0.17±0.04 7.70±0.10 1.0±0.2 20±6 M0304 0.4 57±6 0.17±0.02 10.57±0.08 11.6±2.3 0.30±0.02 M0359 0.4 110±18 0.15±0.03 9.62±0.13 1.5±0.5 0.36±0.05 M0416 1.0 32±14 0.00±0.08 8.70±0.16 0.9±0.2 1.8±0.8 M1115 1.0 400±260 0.00±0.06 7.83±0.22 0.007±0.003 0.10±0.06 M1206 1.0 20±13 0.00±0.03 9.23±0.25 3.7±0.6 2.2±1.7 M1311 1.0 140±20 0.15±0.09 9.14±0.21 0.3±0.2 0.2±0.1 M2031 0.2 4±3 0.00±0.03 9.16±0.21 18.0±8.2 13±6 M2129 1.0 4700±1500 0.07±0.06 11.39±0.12 0.003±0.001 10−5
ness and high surface brightness regions, which at higher redshifts implies a high UV surface brightness. The only exception in our sample is the M2129 arc, which was known to be an old evolved system based on its red colour and its morphology.
5 PHYSICAL CONDITIONS FROM EMISSION LINES
In this section we present properties of the lensed galaxies, which have sufficiently bright emission lines for a derivation of physical quantities. Diverse characteristics of the galaxies are expected, be-cause the galaxies are not selected with a known redshift, nor ap-pearance, hence we cannot derive a uniform set of properties for all sources with the current data set. All the physical properties derived in this section are summarised in Table 16. When line ra-tios are considered, we do not apply any correction for slit losses and magnification factors, since we assume that the emission lines come from the exact same region.
5.1 Kinematics
5.1.1 Line widths
We derive the mean velocity dispersion (σ) from all the emission
line widths, excluding Lyα when detected, and weighted with their
associated uncertainties. The measured line widths are corrected for instrumental resolution by measuring the widths of nearby un-blended sky lines, and subtracting the widths in quadrature. The results are listed in Table 16. To determine the dynamical masses of the galaxies, their sizes need to be measured after lens model-ing and source reconstruction, and will be presented elsewhere (J. Richard in prep.). Although not included in Table 16 because only few lines are detected, we can still determine the velocity disper-sion of the emisdisper-sion lines from M2129 ID 1.5 to be 147±17 km s−1, and 40±3 km s−1for M1206 ID 2.1. The small velocity dis-persions derived from the emission lines agree with the small stellar masses determined from the SED fits.
5.1.2 Velocity offsets
High-redshift galaxies show velocity offsets between Lyα
emis-sion and absorption lines, which are generally interpreted as galaxy scale outflows caused by feedback from star formation. Detailed
studies have used the Lyα line to measure the emission line
red-shift in comparison to rest-frame UV absorption lines arising in the interstellar medium (ISM) of the LBGs and found relative off-sets of several 100 km s−1 (Shapley et al. 2003), but also fainter galaxies identified by GRBs appear to have large velocity shifts (Milvang-Jensen et al. 2012). In a sample of 8 Lyα selected
galax-ies velocity offsets of 145+45−23 km s−1between the systemic red-shifts from rest-frame optical emission lines and the Lyα lines have
been measured (Hashimoto et al. 2012). These small velocity off-sets are similar to the offoff-sets determined from the two Lyα
emit-ting galaxies in this study. Since in the reference frame of the out-flowing gas, photons bluewards of the Lyα line centre are shifted
into resonance, the photons escape only after having diffused to the red wing. Verhamme et al. (2006) find that Lyα experiences about
twice the velocity shift of the true outflow velocity in low hydrogen column density LBGs.
Some Lyα lines have a prominent blue cutoff in the spectral
profile while others show both a blue and a much stronger red com-ponent. Observed at lower spectral resolution, the intrinsic red-shift of the Lyα lines is difficult to determine. A better approach
is to compare the ISM lines with other emission lines than Lyα,
preferably measured with the same instrument to avoid systematic offsets. X-shooter spectra of the 8 o’clock arc show that the UV absorption lines and optical emission lines have redshifts consis-tent with each other (Dessauges-Zavadsky et al. 2011), but since the broad ISM absorption lines span a range of velocities relative to the systemic one, a galaxy scale outflow of 120 km s−1is likely. When outflows have been observed in galaxies, their ISM absorp-tion lines are blueshifted with respect to the systemic redshift.
Table 4 lists both redshifts derived from emission and ab-sorption lines. The abab-sorption line redshifts are measured by fit-ting Gaussian functions and are less accurate because the S/N per pixel is low. Only for the sources with the brightest UV continuum can we measure reliably the redshifts from absorption lines. Even though the continuum is relatively bright, we find no significant ISM lines in the M0359 spectrum since atz = 1.0 most strong
lines are bluewards of the UVB spectrum. Strong low-ionisation lines that are relatively easily detected and are not blended include SiIIλ1260, SiIIλ1304, CIIλ1334, and SiIIλ1526, and among the high-ionisation species we detect SIVλλ1393,1402 and CIV
λλ1548,1550. LBG spectra show velocity offsets between high
and low-ionisation lines (Shapley et al. 2003), as well as offsets between emission and absorption lines indicative of galaxy scale outflows. Only in M0304 do we detect several high- and low