HAL Id: hal-00318405
https://hal.archives-ouvertes.fr/hal-00318405
Submitted on 29 Nov 2007
HAL is a multi-disciplinary open access
archive for the deposit and dissemination of
sci-entific research documents, whether they are
pub-lished or not. The documents may come from
teaching and research institutions in France or
abroad, or from public or private research centers.
L’archive ouverte pluridisciplinaire HAL, est
destinée au dépôt et à la diffusion de documents
scientifiques de niveau recherche, publiés ou non,
émanant des établissements d’enseignement et de
recherche français ou étrangers, des laboratoires
publics ou privés.
the resulting radiative impact at a tropical coastal
station ? Part 1: Microphysical and optical properties
K. Krishna Moorthy, S. Suresh Babu, S. K. Satheesh
To cite this version:
K. Krishna Moorthy, S. Suresh Babu, S. K. Satheesh. Temporal heterogeneity in aerosol characteristics
and the resulting radiative impact at a tropical coastal station ? Part 1: Microphysical and optical
properties. Annales Geophysicae, European Geosciences Union, 2007, 25 (11), pp.2293-2308.
�hal-00318405�
© European Geosciences Union 2007
Geophysicae
Temporal heterogeneity in aerosol characteristics and the resulting
radiative impact at a tropical coastal station – Part 1: Microphysical
and optical properties
K. Krishna Moorthy1, S. Suresh Babu1, and S. K. Satheesh2
1Space Physics Laboratory, Vikram Sarabhai Space Centre, Trivandrum, India
2Centre for Atmospheric and Oceanic Sciences, Indian Institute of Sciences, Bangalore, India
Received: 2 November 2006 – Revised: 23 August 2007 – Accepted: 18 October 2007 – Published: 29 November 2007
Abstract. In Part 1 of this two-part paper, we present the re-sults of extensive and collocated measurements of the colum-nar and near-surface (in the well mixed region) properties of atmospheric aerosol particles at a tropical coastal loca-tion, Trivandrum (8.55◦N; 76.97◦E), located close to the southwest tip of Indian peninsula. These are used to evolve average, climatological pictures of the optical and micro-physical properties and to delineate the distinct changes as-sociated with the contrasting monsoon seasons as well as the transition from one season to the other. Our observa-tions show a dramatic change in the columnar aerosol opti-cal depth (AOD) spectra, being steep during winter monsoon season (WMS, months of December through March) and be-coming quite flat during summer monsoon season (SMS, June through September). The derived ˚Angstr¨om exponent (α) decreases from a mean value of 1.1±0.03 in WMS to 0.32±0.02 in SMS, signifying a change in columnar aerosol size spectrum from an accumulation mode dominance in WMS to a coarse mode dominance in SMS. The compos-ite aerosols near the surface follow suit with the share of the accumulation mode to the total mass concentration de-creasing from ∼70% to 34% from WMS to SMS. The over-all mass burden also decreases in tandem. The changes in α are well correlated to those in the accumulation fraction of the mass concentration. Long-term measurements of the concentration of aerosol black carbon (BC), show prominent annual variations, with its mean value decreasing from as high as 6 µg m−3in WMS to 2 µg m−3in SMS. Correspond-ingly, its mass mixing ratio to the composite aerosols comes down from 11% to 4%. The changes in AOD and α are significantly positively correlated to those of BC concentra-tion. The columnar properties are, in general well associated with the features near the surface. The implications of these changes to the optical properties and single scattering albedo Correspondence to: K. Krishna Moorthy
(krishnamoorthy k@vssc.gov.in)
and the resulting impact on direct radiative forcing are exam-ined in the companion paper (Part 2).
Keywords. Atmospheric composition and structure (Aerosols and particles; Biosphere-atmosphere interactions; Transmission and scattering of radiation)
1 Introduction
Microphysical and optical properties of atmospheric parti-cles (such as aerosol optical depth (AOD), size distribution, single scattering albedo (SSA), phase function and so on) are important in determining their direct radiative forcing or abil-ity to modify the Earth’s radiation budget (e.g., Charlson et al., 1992). Aerosols (used throughout the paper to mean the particulate phase of atmospheric aerosol system) influence the radiative forcing directly by scattering and absorbing the solar radiation (Charlson et al., 1992) and indirectly by alter-ing cloud optical properties, albedo, and lifetime (Twomey, 1977; Lohmann and Feichter, 2005). Aerosol forcing esti-mates still remain highly uncertain (IPCC, 2001) because of the large variability in their properties (which arises mainly from patchy sources, sinks, and short residence time in the troposphere where they are in abundance), that are not char-acterized with adequate accuracy (spatially and temporally), despite the concerted efforts in the last few decades (Charl-son et al., 1992; Haywood et al., 1997; Satheesh et al., 1999; Russell et al., 1999; Babu et al., 2002; Huebert et al., 2003; Moorthy et al., 2005a). This calls for detailed understanding of how the microphysical properties of these particles un-dergo systematic changes during the course of a year, over and above the more random variations at considerably short-time scales. Such systematic changes can be brought about by the changes in the airmass types and prevailing meteorol-ogy (e.g., Smirnov et al., 1994; Moorthy et al., 2003a). This calls for long-term and collocated measurements of several,
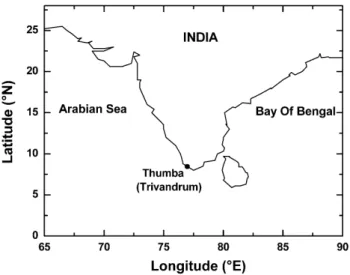
Figure 1. Location map of the observation site
Fig. 1. Location map of the observation site.
if not all, aerosol parameters that are important for aerosol ra-diative forcing estimates. These essentially include spectral AODs, size distribution, SSA, and scattering phase function (P (θ )). Such assessments will provide more realistic inputs to climate modelers.
With this intention, a systematic, all season, investiga-tion using a long database, which will smooth out short-term perturbations, has been undertaken at Trivandrum (8.55◦N, 76.9◦E, 3 m a.m.s.l. (above mean sea level)), a sparsely industrialized, semi-urban, tropical coastal location at the southwest tip of Indian peninsula. The coastal nature of this station has implications from several standpoints. India has a long coastline extending over 7500 km. More than 50% of its over one-billion population resides in the coastal ar-eas and the resulting anthropogenic activities will contribute significantly to the aerosol loading, which gets modified by the natural processes associated with the monsoons. Sea spray aerosols are produced only at the sea surface, while the primary production of rural, and most of the anthropogenic aerosols take place over the land and these two types have distinct physical and radiative properties. On either side of the coastline, these two types of aerosols are mixed and are supplemented by secondary production (in presence of the high humidity). In addition, the mesoscale processes such as land/sea breezes lead to a thorough vertical and horizon-tal mixing of these aerosols within the atmospheric boundary layer with consequent changes in their microphysical prop-erties. Above all, the large-scale changes in the atmospheric circulation system and contrasting rainfall pattern occurring at this location associated with the Indian monsoon, as it changes from the northeast winter monsoon season (WMS, months of December through March) to the southwest sum-mer monsoon season (SMS, June through September), will result in contrasting airmass types and significant changes in the aerosol properties. The change over from one to the
other is gradual and during this period (inter-monsoon sea-son, (IMS, April and May)) and post monsoon season (PMS, October and November)) the aerosol properties will be more complex.
In Part 1 of this two-part paper, we examine the micro-physical properties of aerosols based on the long-term and collocated measurements over a period of ∼4 years. These data are used to build-up a climatological model and to de-lineate the seasonal distinctiveness and the temporal hetero-geneity. The impact of these changes in direct radiative forc-ing will be examined in Part 2 of this paper.
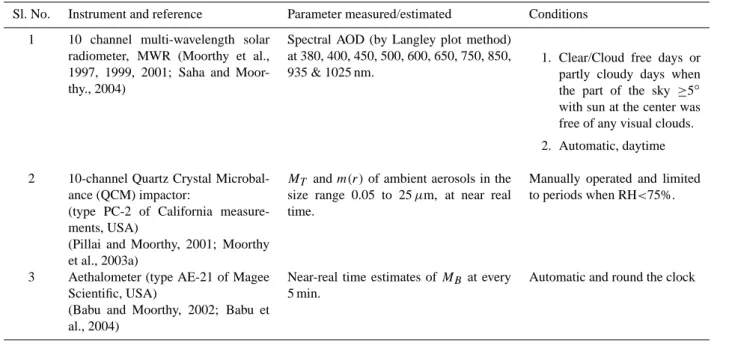
2 Experimental setup and database
Collocated measurements of spectral AOD (at 10 wave-lengths from UV (Ultraviolet) through near IR (Infrared)), total mass concentration (MT) and mass size distribution
[m(r)] of composite aerosols in the well-mixed region near the surface, and mass concentration (MB) of aerosol black
carbon (BC) were carried out from Trivandrum (TVM). The actual study site was in a fishing village, Thumba (8.55◦N, 76.97◦E, 3 m a.m.s.l.) and located within the Thumba Equa-torial Rocket Launching Station. The site is characterized by a flat coastal terrain, free from proximity to any major indus-trial and urban activities. The experimental site was ∼500 m due east of the Arabian Sea coast and ∼10 km northwest of the urban area of TVM (Fig. 1). Being within the rocket launching station, human activity is highly subdued over an extent of ∼±3 km along the coast and about 1 km across it centered about the measurement site. The instruments used for this investigation are listed in Table 1, along with refer-ences to earlier publications on the instrument details, data analysis techniques, and error budget, which are not exten-sively described in this paper. The measurements spanned over 4 years from January 2000 to December 2003. Sup-plementary data on meteorological parameters such as wind speed, direction, temperature, and relative humidity (RH) were obtained from instruments mounted on a meteorolog-ical tower (∼17 m above ground level), located near the me-teorological facility of the rocket launching station, ∼600 m away. Daily total rainfall was also measured at the same me-teorological facility.
The MWR (Multi-Wavelength Radiometer), mounted on the rooftop of the building (∼4 m above ground level), was used to estimate spectral AODs, on days when unobstructed solar visibility was available for 3 h or more, following the Langley plot technique (Shaw et al., 1973) and subtracting the contribution due to molecular scattering and absorption from the total atmospheric optical depth. Application of this technique to the MWR data analysis is described in several earlier papers (Satheesh and Moorthy, 1997; Moorthy et al., 1999, 2001; Saha and Moorthy, 2004). In most cases the entire measurements made, with the MWR, over a day is considered as a single set and the mean AOD is deduced
Table 1. Instrument details and parameters obtained.
Sl. No. Instrument and reference Parameter measured/estimated Conditions 1 10 channel multi-wavelength solar
radiometer, MWR (Moorthy et al., 1997, 1999, 2001; Saha and Moor-thy., 2004)
Spectral AOD (by Langley plot method) at 380, 400, 450, 500, 600, 650, 750, 850, 935 & 1025 nm.
1. Clear/Cloud free days or partly cloudy days when the part of the sky ≥5◦ with sun at the center was free of any visual clouds. 2. Automatic, daytime
2 10-channel Quartz Crystal Microbal-ance (QCM) impactor:
(type PC-2 of California measure-ments, USA)
(Pillai and Moorthy, 2001; Moorthy et al., 2003a)
MT and m(r) of ambient aerosols in the
size range 0.05 to 25 µm, at near real time.
Manually operated and limited to periods when RH<75%.
3 Aethalometer (type AE-21 of Magee Scientific, USA)
(Babu and Moorthy, 2002; Babu et al., 2004)
Near-real time estimates of MBat every
5 min.
Automatic and round the clock
following the Langley plot method. However, on some days the Langley plots showed distinctly different slopes for the forenoon (FN) and afternoon (AN) parts of the same day and on such days these were considered as two independent data sets and the mean optical depths are deduced for each set (following Langley technique) separately for FN and AN. The temporal stability (statistical) of the Langley intercept was used to ensure the stability of the instrument. The typ-ical uncertainty in the AOD estimates varied from 0.02 to 0.03 at different wavelengths, the higher values occurring at the shorter wavelengths.
For the Quartz Crystal Microbalance (QCM, which is a 10 channel cascade impactor) and the Aethalometer, ambient air was drawn from a height of 4 m above the ground level. The measurements of total mass concentration (MT) and mass
size distribution [m(r)] of the composite aerosols (in the size range 0.05 to 25 µm) were made using QCM. Generally, the QCM measurements were made on 4 to 5 days a month and on each day the sampling was done at (nearly) hourly inter-vals, with the sampling duration varying between 3 to 5 min, depending on the aerosol loading (so that all the channels registered a minimum frequency shift of greater than 2 Hz, Pillai and Moorthy, 2001). Details of the sampling and typi-cal error budget are given in earlier papers (Pillai and Moor-thy, 2001; Pillai et al., 2002: Moorthy et al., 2003a). Typical errors in the QCM-estimated total mass concentrations were in the range 15 to 20%; the error tending to the higher side for lower MT. Due to the affinity of quartz to water, the QCM
measurements are not reliable when relative humidity (RH) exceeds 75% and as such, the instrument was operated only during periods when the ambient RH<75%.
Measurements of the mass concentrations (MB) of
at-mospheric BC particles were made using an aethalometer (Model AE-21 of Magee Scientific, USA), operated contin-uously at a flow rate of 3 l min−1(LPM) and a timebase of 5 min; so that MB estimates are available at every 5 min,
round the clock. The aethalometer estimates MB by
mea-suring the change in the transmittance of its quartz fiber filter tape due to deposition of particles aspirated from the ambient. The aethalometer is a simple and rugged instru-ment, suitable for field experiments of long duration, and provided data almost without break. However, several re-ports are available in the recent literature on uncertainties in the aethalometer estimated BC (for e.g., Weingartner et al., 2003; Arnott et al., 2005; Sheridan et al., 2005; Corrigan et al., 2006). Most of these studies have shown that there ex-ists no unique method for accurate, field measurement of the mass concentration of BC, and that all the available methods are species-specific and instrument-specific (Hitzenberger et al., 2006). Several experiments were carried out to correct the aethalometer data for its inherent uncertainties and also to compare the estimated values of BC with those from other collocated measurements (Weingartner et al., 2003; Arnott et al., 2005; Hitzenberger et al., 2006). Measurements of BC mass concentration by aethalometry have two known imped-iments. The first one is the amplification factor arising due to multiple scattering in the quartz fiber matrix of the tape and is normally called the C-factor (Weingartner et al., 2003). The second one arises from the deposition of scattering material along with BC on to the filter tape producing the “shadow-ing effect” (the R-factor) (We“shadow-ingartner et al., 2003; Arnott et al., 2005). Other uncertainties due to rapid changes in
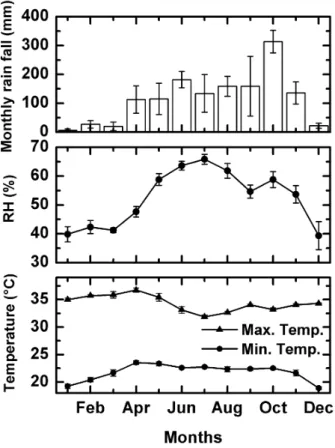
Fig. 2. Annual variation of monthly total rainfall, monthly mean
values (averaged over 2000 to 2003) of relative humidity and max-imum and minmax-imum temperatures at Trivandrum.
sampling conditions and those due to instrument noise can be considerably reduced by using long averaging periods as in the present case. By applying an empirically derived cor-rection routine based on laboratory and field absorption mea-surements made in conjunction with a photo acoustic pho-tometer, Arnott et al. (2005) have developed a correction procedure for aethalometer which was used by Corrigan et al. (2006) for aethalometer observations from MCOH (Mal-dives Climate Observatory at Hanimadhoo) and found that uncertainty in the retrieved absorption coefficients ranges be-tween 5% to 40% depending on the BC mass-load. Inter-comparing the aethalometer with other different techniques, Hitzenberger et al. (2006) have shown that even though the instantaneous values are somewhat species-specific (nature of the BC particles) and instrument-specific, the average con-centrations inferred by various techniques tend to agree with in the instrumental uncertainties for aged (away from strong sources) aerosols. In our studies, there were no prominent sources of BC anywhere near the sampling site and also we have used very long (monthly and seasonal) averages. Such averaging also helped to reduce the uncertainties due to rel-ative humidity and instrument noise. As detailed in Nair et al. (2007), in our measurements we have used a correction factor of 1.9, which is close to the factor of 2.14±0.21
sug-gested by Weingartner et al. (2003) for aged, rural aerosols. Considering all the above we attribute an uncertainty of 20% to the long-term averaged (monthly) BC used in this study, but acknowledge that this systematic uncertainty might be higher.
3 Prevailing meteorology
Being a tropical, coastal location, situated close to the ge-ographic equator, seasonal changes are not as perceptible at Trivandrum as at the temperate latitudes. The most important synoptic meteorological process relevant to this location is the extensive and widespread rainfall during the Indian sum-mer monsoon and the associated changes in the general cir-culation pattern (which almost reverses from a weak north-easterly in winter to a strong southwesterly in summer) and the large north south excursion of the Inter Tropical Con-vergence Zone (ITCZ) (Das, 1986; Asnani, 1993). This is modulated by the mesoscale land/sea breezes arising out of the coastal proximity (Narayanan, 1967), which is percepti-ble during November to March. While the general circulation is a synoptic scale activity extending from June to October, the land/sea breeze is a mesoscale process occurring almost daily but confined within the boundary layer (Moorthy et al., 1993). Compared to these mesoscale land/sea breezes, the synoptic changes associated with the monsoon activity would produce more significant changes in the aerosol characteris-tics that would prevail for longer duration. During December to March, the prevailing atmospheric circulation in the lower troposphere is primarily from the inland continental regions directed towards the ocean, constituting a continental airmass type. This flow is generally dry because these winds arrive from the dry continental interiors and will be richer in con-tinental, accumulation mode aerosols, which would have a significant anthropogenic component too. In sharp contrast to this, during the period from June to September, the prevail-ing winds are directed from the ocean (Arabian Sea). These winds are quite strong (>10 m s−1) and have a long track over the sea and thus bring in a lot of moisture. This marine airmass will also be richer in marine (sea spray) aerosols that have a different size spectrum and chemical characteristics (with a dominant coarse mode associated with sea salt parti-cles) and are of natural origin. During this season, the skies are generally cloudy and rainfall is strong and widespread re-sulting in a significant wet removal of aerosols (Moorthy et al., 1991). The annual variation of monthly total rainfall at TVM (averaged over the study period) is shown in the top panel of Fig. 2 followed by monthly mean values of RH, as well as maximum and minimum temperatures respectively in the panels below.
Based on the above, as well as the climatological pattern of synoptic winds (for e.g., Asnani, 1993; Pillai and Moor-thy, 2001) the following four distinct seasons are consid-ered for aerosol characterization, namely the winter monsoon
Figure 3. Polar graphs showing wind speed and wind direction for (a) Winter Monsoon Season
Fig. 3. Polar graphs showing wind speed and wind direction for (a) Winter Monsoon Season (WMS; months of December through March) (b) Inter Monsoon Season (IMS; April and May), (c) Summer Monsoon Season (SMS; June through September) and (d) Post Monsoon
Season (PMS; October and November). Wind direction refers to the direction of wind arrival. The percentage indicates the percentage of points located in a given quadrant. The clear transformation from WMS to SMS is easily discernible.
season (WMS, December to March); the inter monsoon sea-son (IMS, April and May); the summer monsoon seasea-son (SMS, June to September) and post monsoon season (PMS, October and November). In Fig. 3 we have shown the sea-sonal distribution of prevailing winds (winds at 850 hPa level obtained from the radiosonde ascents made twice a day (at 00:00 GMT and 12:00 GMT) at TVM) grouped into seasons as above for all the four years. In the figure, wind speeds in-crease radially outwards while the angle measured clockwise with respect to north show the direction of wind arrival. The 850 hPa level is chosen to represent the prevailing wind fields unaffected by any orographic influences. Based on Figs. 2 and 3 and other climatological patterns, the distinctiveness of each season is discussed below.
3.1 Winter Monsoon Season (WMS)
This is climatologically, the driest season of the year for TVM (as well as the northern hemispheric regions in Indian longitudes), with very little or insignificant rainfall (∼5% of the annual). The RH generally remains between 40% and 60% signifying the prevalence of a dry environment despite the coastal proximity. The interiors are still drier with RH dropping to as low as 15% in the central peninsula (Moorthy et al., 2005b). The minimum temperatures are, in general, the lowest observed during the year (in the range 18 to 22◦C) and the diurnal variation in temperature (1T = the differ-ence between maximum and minimum temperature) exceeds 15◦C on an average, and go as high as 17◦C, at times. The prevailing winds (Fig. 3a) are generally weak (<∼6 m s−1)
northerly or northeasterlies (for >70% of the time) signifying an airmass directed from the interior continental India, which is drier. During this season, ITCZ is located climatologically at ∼5◦S or beyond (Waliser and Gautier, 1993). Examina-tion of the winds and OLR (Outgoing Longwave RadiaExamina-tion) from the NCEP (National Centers for Environmental Predic-tion) data also revealed that the ITCZ was between 5◦S to 10◦S during these months in all the years considered. This season, thus, is considered as the WMS, even though it is much warmer and humid at TVM than the conventional win-ter experienced at the northern parts of India. The anticy-clonic circulation over the continent is conducive for a ver-tical confinement of aerosols. The sky is mostly clear and cloud free and rainfall is scanty.
3.2 Inter-Monsoon Season (IMS)
The WMS gradually gives way to warmer and more hu-mid IMS extending from April to May during which the winds undergo a transition. The anticyclonic subsidence still prevails and the skies are clear to partly cloudy; but the winds shift more to northerly and northwesterly direc-tion (for >50% of the time) with moderately high speeds ranging from 5 to 15 m s−1(Fig. 3b). As such, the airmass type is a mixture, transforming from the continental type to the marine type. The ITCZ migrates gradually to the north (Asnani, 1993) and is located between equator and 5◦N. The mean land temperature increases and the diurnal variation de-creases (1T ∼12 to 13◦C). Ambient RH is higher and has a positive gradient (at ∼50 to 70%). The rainfall increases dur-ing this period. The total rainfall durdur-ing these two months is ∼16% of the annual.
3.3 Summer Monsoon Season (SMS)
The onset of Indian summer monsoon occurs over TVM climatologically on June 1, accompanied with the change in winds to northwesterly; directed from the sea to land (for >97% of the period, Fig. 3c). This marine airmass brings with it vast amount of moisture, cloudiness, and pre-cipitation. The wind speeds are high, with mean value of ∼12.3±4.7 m s−1 and peak speeds reaching as high as ∼25 m s−1. The maximum temperature decreases and 1T lies in the range 9 to 11◦C at times dropping down to 4◦C. The RH remains high (and exceeds 80% quite frequently). This season, extending from June to September, provides much of the rainfall (∼47% of the annual). During this sea-son ITCZ is located beyond 10◦N. The rainfall gradually
spreads northward from June, covering entire India by be-ginning of July.
3.4 Post-Monsoon Season (PMS)
During this season (October and November), the winds start shifting again to northerly or northeasterly (47% of time) with moderate speeds ranging from 5 to 15 m s−1(Fig. 3d).
The extent of cloudiness decreases. The temperature starts increasing and 1T lies in the range 10 to 12◦C and RH
de-creases. However, rainfall still continues to be significant (∼32% of the annual). (In fact the mean rainfall was highest in the month of October during the study period.) This post monsoon season is also a transition season; but it has more intense rainfall associated with it compared to IMS. This season is also characterized by weakening of low-pressure center over the sub-continent. At the same time, the low-pressure center is prominent over the Bay of Bengal making it a seat for generation of depression and cyclones, which bring-in the rainfall over these parts. The ITCZ starts mi-grating to the south.
4 Results and discussion
In the following we examine how the optical and microphys-ical properties of aerosols respond distinctly to these large-scale natural processes; which are seasonal and repeat the seasonality from year to year.
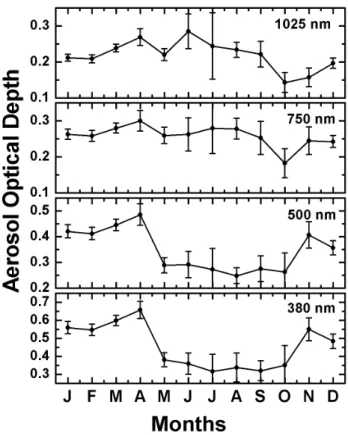
4.1 Spectral Aerosol Optical Depth
Spectral AOD is a key parameter in estimating the extent to which aerosols directly influence the radiative balance of the Earth-Atmosphere system and is dependent on the columnar abundance, size distribution and refractive index of aerosols. Spectral AODs, estimated from each MWR data set are ex-amined for the temporal and spectral characteristics. 4.1.1 Annual variation of AOD
The spectral AOD showed significant annual variations, with distinct spectral dependence. Despite, the nature of the vari-ation was similar in all the years, indicating a regular pat-tern. In view of this, the individual AOD estimates were grouped in to the calendar months, without discriminating them in terms of the year and the monthly mean values and their standard deviations are estimated. This would smooth out the inter-annual variations and the short scale fluctuations and will bring out a climatological mean pattern amenable for inputting into radiation models. This smoothed annual variation is shown in Fig. 4, at four representative wave-lengths (380, 500, 750 and 1025 nm) spanning over the spec-tral range covered by the MWR. Here each point corresponds to the monthly mean AOD, irrespective of year, and the ver-tical line through each point represents the standard error. When the mean values are to be compared, it is customary to use the standard error, which represents the range over which the mean value would vary, if it were estimated from a num-ber of different ensembles drawn from a population; smaller the error, the more closer is the ensemble mean to the popu-lation mean. On the other hand the standard deviation is used to comment on the spread of values with in an ensemble. The shorter lengths of the error bars during WMS indicate smaller
Table 2. Mean AOD at 380, 500, 750 and 1025 nm for different seasons.
Season AOD380 AOD500 AOD750 AOD1025 Number of data points
WMS (Dec, Jan, Feb and March) 0.58±0.02 0.43±0.01 0.27±0.01 0.21±0.01 282 IMS (April and May) 0.53±0.04 0.40±0.03 0.28±0.02 0.25±0.01 61 SMS (June, July, Aug and Sep) 0.35±0.03 0.29±0.03 0.29±0.03 0.27±0.02 41 PMS (Oct and Nov) 0.51±0.06 0.38±0.04 0.23±0.03 0.15±0.02 19
day-to-day and year-to-year variabilities of AOD during this season compared to SMS. Main features are
1. In the visible (short) wavelengths, the AODs are gen-erally high during January, February months. Subse-quently they increase gradually to reach a peak in April and dropdown to the low values in May. Thereafter, the AODs remain nearly steady at the low values until Oc-tober before recovering.
2. In contrast to this, the annual variations are weaker in the NIR wavelength regime (compared to those at the shorter (visible) wavelength regime (such as 380 to 500 nm)). While the AODs at the shorter wavelength show a sharp decrease in May and remain low until Oc-tober, at the NIR wavelengths the AODs continue to be moderately high. In other words, the AOD spectrum changes its shape from winter to summer.
The seasonal mean values of AOD (obtaining by grouping them into the four seasons considered here) at these four wavelengths are given in Table 2. The contrasting differences in aerosol characteristics as the season changes are seen from the changes in the magnitude and the wavelength variation of the AOD.
4.1.2 Spectral variations and Angstr¨om parameters The AOD spectra contain information on the columnar size distribution of aerosols as they are related through
τp(λ) = r2 Z
r1
π r2Qext(r, λ, m)nc(r)dr (1)
where τp(λ) is the aerosol optical depth, Qextis the Mie
ex-tinction efficiency parameter (which is function of particle size (r), refractive index (m) and wavelength (λ)), nc(r) is
the columnar size distribution, and r1and r2are the lower and
upper radii limits. Qextincreases from a low value for small
values of r/λ to reach a peak value (∼4) for r∼λ and then approaches 2 for higher values of r (McCartney, 1976). Thus maximum contribution to τp comes from particles in a size
distribution whose radii are comparable to the wavelength of the radiation. Higher values of AOD at shorter wavelength, thus, imply higher relative abundance of smaller particles in
Fig. 4. Temporal variations of the monthly mean (averaged over
2000 to 2003) Aerosol Optical Depth (AOD) at Trivandrum, at four selected wavelengths; two in the visible and two in the near infrared. The vertical lines through the points represents the standard devia-tion of the mean.
the aerosol size spectrum (i.e. compared to the case of lower values of AOD at the same wavelengths). The simplest way to quantify these spectral changes in AOD is to estimate the
˚
Angstr¨om parameters ( ˚Angstr¨om, 1964) using the equation
τp(λ) = βλ−α (2)
The ˚Angstr¨om wavelength exponent (α) is an indicator of the size distribution, being higher when the columnar aerosol size spectrum has higher relative dominance of accumulation mode aerosols (size <1 µm), while β is a measure of the aerosol loading. The simplicity of the expression enables its use in radiative forcing calculation. Following Eq. (2), α and
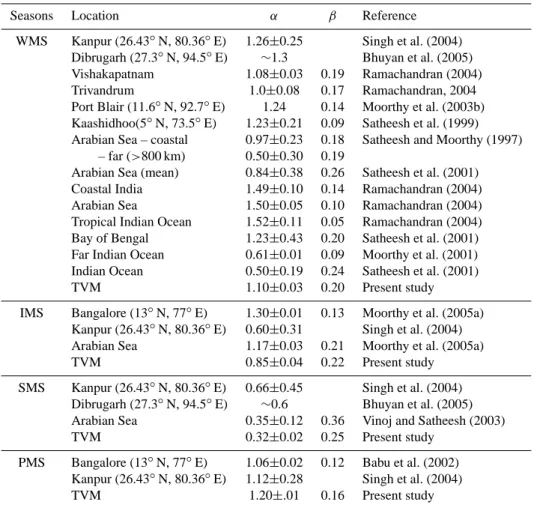
Table 3. ˚Angstr¨om parameters over various Indian locations as well as marine locations around India along with that observed during the present study.
Seasons Location α β Reference WMS Kanpur (26.43◦N, 80.36◦E) 1.26±0.25 Singh et al. (2004)
Dibrugarh (27.3◦N, 94.5◦E) ∼1.3 Bhuyan et al. (2005) Vishakapatnam 1.08±0.03 0.19 Ramachandran (2004) Trivandrum 1.0±0.08 0.17 Ramachandran, 2004 Port Blair (11.6◦N, 92.7◦E) 1.24 0.14 Moorthy et al. (2003b) Kaashidhoo(5◦N, 73.5◦E) 1.23±0.21 0.09 Satheesh et al. (1999) Arabian Sea – coastal 0.97±0.23 0.18 Satheesh and Moorthy (1997)
– far (>800 km) 0.50±0.30 0.19
Arabian Sea (mean) 0.84±0.38 0.26 Satheesh et al. (2001) Coastal India 1.49±0.10 0.14 Ramachandran (2004) Arabian Sea 1.50±0.05 0.10 Ramachandran (2004) Tropical Indian Ocean 1.52±0.11 0.05 Ramachandran (2004) Bay of Bengal 1.23±0.43 0.20 Satheesh et al. (2001) Far Indian Ocean 0.61±0.01 0.09 Moorthy et al. (2001) Indian Ocean 0.50±0.19 0.24 Satheesh et al. (2001) TVM 1.10±0.03 0.20 Present study IMS Bangalore (13◦N, 77◦E) 1.30±0.01 0.13 Moorthy et al. (2005a)
Kanpur (26.43◦N, 80.36◦E) 0.60±0.31 Singh et al. (2004) Arabian Sea 1.17±0.03 0.21 Moorthy et al. (2005a) TVM 0.85±0.04 0.22 Present study SMS Kanpur (26.43◦N, 80.36◦E) 0.66±0.45 Singh et al. (2004)
Dibrugarh (27.3◦N, 94.5◦E) ∼0.6 Bhuyan et al. (2005) Arabian Sea 0.35±0.12 0.36 Vinoj and Satheesh (2003) TVM 0.32±0.02 0.25 Present study
PMS Bangalore (13◦N, 77◦E) 1.06±0.02 0.12 Babu et al. (2002) Kanpur (26.43◦N, 80.36◦E) 1.12±0.28 Singh et al. (2004) TVM 1.20±.01 0.16 Present study
β are derived from the individual AOD spectra (from January 2000 to December 2003) by least squares fitting the AOD spectra, in a log-log scale. For this we have used AODs at all the 10 wavelengths (in the MWR).
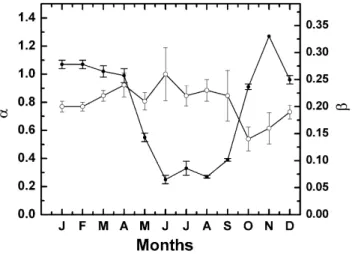
Climatological monthly mean values of α and β are then obtained by grouping the individual estimates into monthly ensembles and averaging. The annual variations of mean α and β are shown in Fig. 5. It very clearly shows the dramatic transformation in the aerosol spectra, from an accumulation-mode domination during WMS, (revealed by high values of α (>1) and steep AOD spectra) to an increased coarse mode domination in the SMS (characterized by a low value of α (<0.5) and flat AOD spectra). Interestingly, the high-est value of α (∼1.3) occurred in the month of November (PMS). However, β values did not show large changes, even though it tended to be higher during SMS, and lower during PMS. The seasonal transformations of the AOD spectra are shown in Fig. 6, where the individual points are the AODs averaged over the season, irrespective of the year. Perform-ing the regression analysis on the seasonal mean AOD
spec-trum, seasonal mean ˚Angstr¨om parameters are evaluated and are given in Table 3 along with the values reported, in the recent years, over Indian landmass and the adjoining oceans by several investigators along with relevant references. From Table 3 it is evident that the high values of α (>1.0) are a consistent feature over most of the Indian landmass during WMS; of course, local variations occur depending on region-specific industrial/urban activities or coastal or arid nature of the sites. In contrast, the low values of α in SMS is anal-ogous to that seen over far oceanic environments in winter or over the extensively dust infested region of northern India (Kanpur); in both the cases there is an increased influence of natural, coarse mode, aerosols.
Extensive measurements over different environments have shown that the high values of α are typically associated with continental aerosols (Hess et al., 1998) or over oceans ad-jacent to continents and influenced by a continental airmass (Hoppel et al., 1990; Satheesh and Moorthy, 1997; Moorthy et al., 2005a), whereas over remote marine environments, far away from continents and under the influence of a marine
airmass, the AOD spectra tend to become flat (Hoppel et al., 1990; Smirnov et al., 2002; Moorthy et al., 2001). Exam-ining our results in the light of the above, it is clear that the columnar aerosol properties over TVM closely resemble that of a typical marine environment during the SMS, while it behaves almost like a polluted and anthropogenically influ-enced continental site during WMS, with the synoptic tran-sition periods (IMS and PMS) coming in between. We now examine the features of the composite aerosols near the sur-face, based on the QCM data, in the above perspective. 4.2 Composite aerosol characteristics
The QCM provided near-real-time measurements of size seg-regated mass concentration as well as total mass concentra-tion (MT=
10
P
i=1
mci) where mci is the mass concentration in
the ith size-bin. Grouping the individual MT estimates into
monthly ensembles (irrespective of year) and averaging, the monthly mean (climatological) values of MT were estimated.
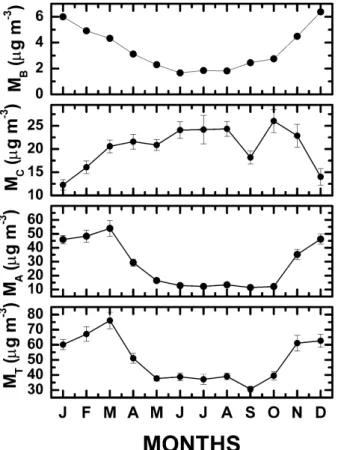
The annual variation of these climatological monthly mean MT values (shown in the bottom panel of Fig. 7) closely
re-sembles that of AOD at the shorter wavelengths (shown in the bottom two panels of Fig. 4). High values (MT≥60 µg m−3)
occur during the WMS; with MT gradually increasing from
January to reach as high as 70 µg m−3 by March. Subse-quently, MT decreases rapidly during April–May (IMS) to
reach a low value by June. During the entire SMS (June to September) it remains at the low level (35–40 µg m−3) and increases thereafter through the PMS (October–November) to reach high values (∼60 µg m−3) again by December.
The dry land condition, low relative humidity, large di-urnal variation in the ambient temperature, the rather cloud free skies, and the continental nature of the prevailing air-mass are all highly conducive for the high aerosol loading during WMS. The continental nature of the airmass during this period is favorable for the transport of aerosols from drier and densely populated continental regions lying upwind to the site, where the accumulation mode aerosols are known to dominate in winter (Moorthy et al., 2005b). The scanty rainfall (∼5% of annual and even less upwind) and very low cloud cover during this period renders scavenging process to be very weak. Consequently, the aerosols have their longest atmospheric residence time during this season; conducive for long-distance transport (Ramanathan et al., 2001). In con-trast, the extensive cloudiness and rainfall during SMS re-sults in an effective wet scavenging of the particles, result-ing in a rapid decrease in their concentration. It may be re-called that for aerosols in the size range 0.1 to 1.0 µm, wet removal is the chief removal mechanism (Flossmann et al., 1985; Saha and Moorthy, 2004). A part of this loss is re-plenished by fresh marine aerosol particles, produced by the strong monsoon winds over the ocean, and advected over to the coastal landmass. Moreover, the land remains wet, the sky is generally cloudy and diurnal variation in temperatures
α β
α β
Fig. 5. The temporal variation of monthly mean values of Angstr¨om
parameters (α and β) averaged irrespective of year. The solid circles correspond to α values and open circles correspond to β values. The vertical lines through the points represents the standard deviation of the mean.
is the lowest in the year during this season, all being unfavor-able for local production of continental aerosols/dust. Thus the composite aerosols undergo significant seasonal changes in their characteristics.
Further, at the coastal location there would be at least two strong aerosol components; one of continental origin and the other of marine origin; each dominating in distinct size regime and during different parts of the year. The continental component would be richer in accumulation mode aerosols (e.g., Moorthy et al., 2003a) while the marine component will have a strong coarse mode (radius >1.0 µm). As such, the total aerosol mass concentration (MT) is separated into
MA (mass concentration in the accumulation mode, radius
from 0.05 to 1 µm) and MC(mass concentration in the coarse
mode, >1 µm) such that MT=MA+MC. The MA and MC,
estimated from each QCM samples are averaged to obtain the mean representative values for each month similar to MT.
The month-to-month variation of MA and MC are shown in
the middle panels of Fig. 7. There is a very close similarity in the annual variations of MAand MT, which indicates that
MA is a significant component of MT in all seasons. On the
other hand, variation of MC is nearly opposite in nature to
that of MA. The above changes are categorized in terms of
the 4 seasons considered in this study and the seasonal mean values of MT, MA and the share of MA to MT are given
in Table 4. It very clearly shows that the size spectrum of composite aerosols undergoes a transformation from an ac-cumulation mode domination (when MAaccounts for ∼70%
of MT) in WMS to a coarse mode domination in SMS when
the share of MAto MT is only ∼34% (Table 4).
From the mass-size distribution, an estimate of the effec-tive radius (Reff), which is the ratio of the volume to the area
λ
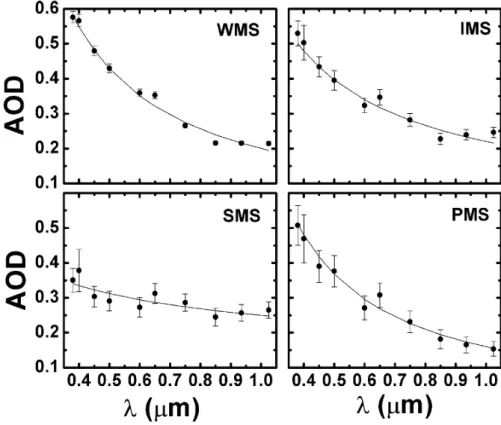
Fig. 6. The mean spectral aerosol optical depth (AOD) during the four seasons (Winter Monsoon Season – WMS (December through
March), Inter Monsoon Season – IMS (April and May), Summer Monsoon Season – SMS (June through September) and Post Monsoon Season – PMS (October and November)) considered in this study. Each point corresponds to the seasonal mean value of AOD at a particular wavelength (λ) and the vertical line through the point corresponds to the standard deviation of the mean.
Table 4. Seasonal changes in the characteristics of composite aerosols. MT and MArefer to total as well as accumulation mass
concentrations respectively. Seasons MT (µg m−3) MA(µg m−3) (MA/MT) Reff WMS 56.24±1.6 39.29±1.4 0.70 0.17±0.004 IMS 38.50±1.2 18.71±0.9 0.49 0.22±0.007 SMS 32.31±0.8 11.00±0.4 0.34 0.24±0.006 PMS 43.18±2.0 18.96±1.3 0.44 0.22±0.01
2001) and is given in the last column of Table 4. It showed a gradual increase in Reff from 0.17 µm in the WMS to
0.24 µm in SMS and decrease subsequently, in-line with the changes in the concentration of coarse mode aerosols. As Reff of polydispersion represents the radius of an equivalent
monodispersion, which will have the same scattering proper-ties as the polydispersion, the above trend in Reff is in line
with that of the AOD spectra. These changes occurring at near the surface are well in line with changes in columnar AOD and α seen in Figs. 4 and 5 thereby indicating a gen-eral resemblance in the aerosol columnar properties to those at the near surface.
4.3 Aerosol black carbon
In characterizing the absorbing properties of aerosols at a given region, aerosol black carbon has a very significant role. BC is the most light absorbing aerosol species present in the atmosphere and being mostly in the fine size range and chem-ically inert, has a fairly long atmospheric life time of about 7 to 10 days (Reddy and Venkataraman, 1999), particularly during dry seasons. Longer residence times would lead to higher concentrations. The aethalometer data was used to characterize BC at TVM.
4.3.1 Annual variations
BC mass concentration near India is known to undergo strong annual variation associated with changes in prevailing mete-orology (Babu and Moorthy, 2002). In order to understand the climatological trend, monthly mean values of MB were
estimated by averaging the individual observations on each month irrespective of the year as was done for the compos-ite aerosols. The month-to-month variation of this, shown in the top panel of Fig. 7, reveals very large annual varia-tion, by a factor ∼4. High MBvalues (6 µg m−3) occur
Fig. 7. Annual variation of monthly mean values of total mass
concentration (MT), accumulation mode mass concentration (MA),
coarse mode mass concentration (MC) and black carbon mass
con-centration (MB) (respectively in the panels from the bottom to the
top) at the near surface level. The vertical line through each point represents the standard deviation of the mean.
depleted to 1.5 µg m−3 during the months of SMS. There-after MBgradually increases during PMS and regain its high
value in WMS. During the SMS, when MB is lowest,
av-erage MB level is still at 1.5 µg m−3, which means that the
BC concentration is significantly high at this location. (Such high BC has implications to the aerosol forcing, as will be evident in the second part of this paper.) The seasonal mean values of MB and its median values are given in Table 5. It
shows the distribution of MBis skewed; with more frequent
occurrence of values lower than the mean. This is mainly due to the exceptionally high concentrations of BC occur-ring in the morning hours (just after sunrise), associated with fumigation effect in the atmospheric boundary layer (for ex-ample, Babu and Moorthy, 2002) and in the evening, during the neutral conditions, before the sea breeze reverses to land breeze.
As our study region is not industrialized, the sources of BC would mainly be automobile exhaust and local domes-tic activities combined with BC advected from the inland re-gions. There are no combustion sources that are of seasonal
Table 5. The mean and median values of black carbon mass
con-centrations (MB) observed in each seasons and the mass fraction of
black carbon (FBC) to the total aerosol mass.
Seasons Mean MB(µg m−3) Median of MB(µg m−3) FBC
WMS 5.68±0.021 4.13 10.7
IMS 2.62±0.014 2.15 6.5
SMS 2.01±0.006 1.44 4.0
PMS 3.46±0.019 2.34 6.5
in nature. The advection, of course, has strong seasonal de-pendence as is seen earlier. Several forest fires of moderate strength occur every year during the WMS period over the forest land lying a few hundred kilometers north-east (up-wind) of Trivandrum, mainly due to the dry prevailing con-ditions and it is likely that a part of these emissions would be advected to this location by the favorable wind direction, during this season.
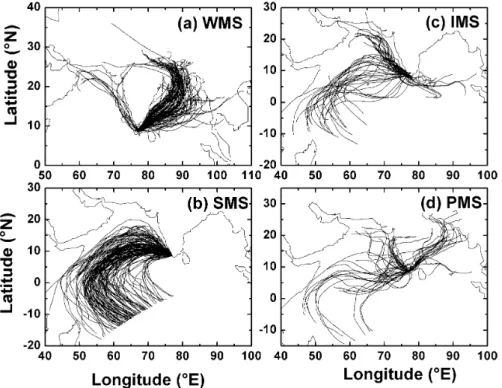
To examine the role of long-range transport of BC to TVM, from the adjoining regions, 5-day airmass back trajectories were computed using Hybrid Single Particle Legrangian Integrated Trajectory (HYSPLIT, http://www.arl. noaa.gov/ready/hysplit4.html) model of National Oceanic and Atmospheric Administration (NOAA). Mass plots of these trajectories (arriving at 500 m a.g.l. (above ground level) at TVM) for each season are shown in Fig. 8. In the figure, the panels (a) and (b) show the contrasting seasons WMS and SMS, while (c) and (d) shows the periods of tran-sition. It can be seen that during WMS, when the MBvalues
are high, most of the trajectories show advection either from the Indo-Gangetic plain or from the East Asia across the Bay of Bengal. There is some significant advection from the west coast of India and Arabia also. In sharp contrast to this, dur-ing SMS all the trajectories are of oceanic nature and reach TVM without any continental overpass. As such, MB
val-ues are the lowest of the year during this season. During the transition months, the trajectories show different types of advection with consequent impact on MB. During IMS
(transition from WMS to SMS) Fig. 8c shows that majority of the trajectories have a long history over the ocean and only less than 30% of the trajectories have a continental or close to continental history (either West Asia, West Coastal India or over Srilanka). Unlike this, in PMS we have significant advection from the Indo-Gangetic plain, central peninsular India, west coast of India and east coast of Africa. Only less than 25% of the trajectories are purely oceanic in na-ture. This result in seasonal mean BC during PMS being significantly higher than that during IMS, even though both are transition periods. Similar effects of long range trans-port of aerosols from the IGP to the east coast of India have been reported by Niranjan et al. (2005) and at Ahmedabad in western part of India by Ganguly et al. (2006). Corrigan et al. (2006) have also reported impact of continental advection
Fig. 8. Mass plots of the trajectories (arriving at 500 m a.g.l. (above ground level) at TVM) for each season. In the figure, panels (a) and (b)
show the contrasting seasons WMS (December through March) and SMS (June through September), while (c) and (d) shows the periods of transition, IMS (April and May) and PMS (October and November).
on aerosol concentration at Maldives. All these indicate that long-range transport has an important role in determining the BC concentration at TVM.
4.3.2 BC mass fraction (FBC)
The share of BC to the composite aerosol mass is important in assessing the radiative impacts of aerosols. Simultaneous estimates of MT and MBare used to obtain the mass fraction
(the mass-mixing ratio, FBC) of BC (=MB/MT).
Consider-ing the uncertainties in the QCM measurements along with those of MB, the overall uncertainties in the mass fraction
would be in the range 14 to 18% (Babu and Moorthy, 2002). The seasonal mean values of FBCare given in the last
col-umn of Table 5. It shows that the share of BC to the com-posite aerosols varies by a factor of ∼2.5 over the year. But the more important point is that FBC is high when both MB
and MT are also high and it occurs during the WMS when
the sky is rather clear and cloud free. This implies that BC is a major component of the aerosol system when the aerosol burden is high.
INDOEX measurements have reported 14% of BC in fine aerosol (dry mass at diameters <1 µm) and 10% of BC in coarse aerosol (dry mass at diameters between 1 µm and 10 µm) in the marine boundary layer (Lelieveld et al., 2001; Ramanathan et al., 2001). Based on the campaign mode ob-servation over an urban location Bangalore, during the PMS
of 2001, Babu et al. (2002) reported an FBC value of 11%.
Similarly, Tripathi et al. (2005) reported a range of values for FBC between 7 and 15% over Kanpur (in the Northern
India) during December (WMS) 2004. BC mass fraction in the range of 10 to 15% were reported during ACE-2, IN-DOEX and TARFOX (Novakov et al., 2000; Ramanathan et al., 2001; Satheesh et al., 2002) while over tropical western Pacific Liley et al. (2002) reported BC to contribute as much as 25% to the composite. From measurements at Bangalore, Babu et al. (2002) reported large amount of BC; both in abso-lute terms as well as in the fraction to the total aerosol mass (∼11%) and fine aerosol mass (∼23%). In the present study, we notice that, though FBCremain consistently high (≥10%)
during WMS the absolute values are lower than those re-ported for northern Indian region. Moreover, the values in Table 5 indicate that FBC undergoes a rapid decrease (by a
factor of >2.5) to as low as 4% in SMS. This will have its implications on the aerosol single scattering albedo, which in turn will affect the radiative forcing.
4.4 Association between near surface and columnar prop-erties
Generally atmospheric aerosols are produced very close to the surface (except the secondary generation process from precursor gases) and are then distributed spatially by winds, turbulence, diffusion and other atmospheric
α
Fig. 9. The monthly mean values of total mass concentration of composite aerosols and columnar AOD at 500 nm (the bottom panel) and ratio of accumulation mode mass concentrations to total (MA/MT) and the ˚Angstr¨om wavelength exponent (α) (top panel).
The vertical line through the point represents the standard deviation of the mean.
processes. Hence, the major share of the aerosol loading at a location has a direct dependence on the composite aerosol concentration at the surface, except when transport process becomes significant at higher level. Thus, for estimating the radiative forcing due to aerosols by incorporating the aerosol properties estimated from near surface measurements, it is important to understand how well the near surface aerosol properties are related to columnar aerosol properties. With this view, we examine the association between the composite (surface) aerosol features and AOD, on an average basis. 4.4.1 Composite aerosol characteristics and Columnar
AOD
In Fig. 9, the annual variation of the climatological mean of AOD at 500 nm is compared with that of MT in the bottom
panel and the ˚Angstr¨om component α (which is predomi-nantly a measure of the relative abundance of smaller par-ticles) with the accumulation mode fraction Af (estimated
as MA/MT) in the top panel. A very close association is
evident in both the figures all through, except in April, Oc-tober and November, which are the transition months. This implies that the surface features are broad indicators to the columnar properties for most part of the year. In the tran-sition seasons, particularly during IMS, long-range transport processes have a strong influence on the columnar proper-ties, because advection generally occur at elevated layer at ∼2 to 3 km (Muller et al., 2001). Based on shipboard mea-surements, Moorthy et al. (2005a) have shown that changes in direction of advection significantly affects the AOD over coastal Arabian Sea, adjacent to TVM, but the near sur-face concentrations are not influenced. Similarly, the exten-sive rainfall associated with the return monsoon also would
γ
Fig. 10. Scatter plot showing the variation of aerosol optical depth(AOD) with black carbon mass concentration (MB) at (a) 380 nm
and (b) 1025 nm. Here N is the number of days on which simul-taneous observation of spectral AOD and MBis available and γ is
the correlation coefficient.
probably affect the vertical heterogeneity of aerosol in PMS. Such associations between surface concentration and column AOD have been reported by others also during field cam-paigns. Based on INDOEX observation, Parameswaran et al. (1999) have reported an association between the aerosol optical depth at 500 nm and near surface total aerosol mass concentration with a correlation coefficient of ∼0.74 over the Arabian Sea and northern Indian Ocean during continental airmass period (January to March). From investigation over Barbados, Smirnov et al. (2000) reported that the monthly averages of dust concentration and columnar AOD at 870 nm are strongly correlated with a coefficient of 0.93.
4.4.2 BC concentration and Columnar AOD
It was noticed earlier that BC contributes from ∼4% to as much as 10 to 11% to the composite mass during different seasons. Earlier studies have shown that a 6% of BC contri-bution to the composite aerosols mass can be associated with as much as an 11% contribution to the AOD (Satheesh et al., 1999). Here, we examine the association of AOD and α with MB. Figure 10 shows the scatter plot of daily mean BC
con-centration (MB) with the simultaneous daily mean AOD at
two wavelengths, 380 nm (the shortest wavelength used in MWR) and 1025 nm (the longest wavelength used in MWR).
α γ
Fig. 11. Scatter plot showing the variation of Angstrom exponent
(α) with black carbon mass concentration (MB). Here N is the
number of days on which simultaneous observation of spectral AOD and MBis available and γ is the correlation coefficient.
The plot contains 109 individual observation pairs combining all the seasons. Despite a fair amount of scatter, (which is ex-pected due to several reasons such as, (a) BC is not the only species contributing to AOD; (b) Temporal changes in the composite aerosol concentrations are not one to one corre-lated with those of BC; (c) BC measurements are made near the surface while AOD is in the column; (d) BC share to the composite aerosols undergoes a large variation with season and (e) the large amount of coarse sea spray aerosols which are added to the composite aerosols in SMS do not have any BC component) some interesting pattern is seen in Fig. 10. At 380 nm, the variation of AOD is positively correlated with MB with a correlation coefficient of +0.38 (which is
signif-icant) where as at 1025 nm AOD is very weakly negatively correlated with MB.
Thus BC has a significant role in determining the AOD at short wavelengths, which is influenced by the accumulation mode aerosols (radius <1 µm). At the longer wavelengths, the AOD is more dependent on coarse aerosols (such as sea salt). It is also well established that most of the BC mass re-sides in the sub-micron size range (particle radius <1 µm). In view of the above observations, in Fig. 11 we examine the association between α and MB. It shows a high positive
correlation with a coefficient of 0.69. This result is very im-portant because the points in Fig. 11 are representative of all seasons and it implies that BC has a significant role in the enhancement of α at TVM, irrespective of the season.
5 Conclusions
Collocated measurements of spectral aerosol optical depth; total as well as size segregated mass concentrations of near surface aerosols; and aerosol black carbon mass concentra-tion are made over a period of four years at Trivandrum, a tropical coastal station on the southwestern tip of India. These are used to characterize the optical and microphysical properties of aerosols and to examine the changes in them associated with the changes in prevailing meteorology. The main findings are:
1. Aerosol optical depth showed large annual varia-tion with high values during Winter Monsoon Sea-son (WMS; months of December through March) and low values during Summer Monsoon Season (SMS; June through September) at short (visible) wavelengths and an opposite pattern at longer (near infrared) wave-lengths.
2. The columnar AODs transform from a steep spectra dur-ing WMS to shallow spectra in SMS with a transition in Inter Monsoon Season (IMS; April and May) and re-covering back to WMS through Post Monsoon Season (PMS; October and November). Correspondingly the Angstr¨om wavelength exponent (α) decreases from a high value (∼1.1) in WMS to the least value in SMS (0.32). During the transition period α is moderate in IMS and while it is the highest in PMS. These changes suggest a change in the aerosol environment from a polluted continental type with significant anthropogenic share to a cleaner marine like environment with signifi-cant share of natural aerosols.
3. Composite aerosols, in well-mixed region near the sur-face, also depict distinct changes in their characteris-tics with changes in the synoptic meteorology. The to-tal mass concentrations decreases drastically by a factor of ∼2 in SMS from the high WMS values. Associated with this, the mass size distribution changes from accu-mulation mode (radius <1 µm) domination in WMS to coarse mode (radius >1 µm) domination in SMS. 4. Although BC mass concentration (MB) measurements
have considerable systematic uncertainties due to in-strument limitations, there is a significant seasonal de-pendence in MB. The aerosol BC concentration as well
as its mass mixing ratio decrease from very high values in WMS (respectively 5.6 µg m−3and 11%) to very low
values (1.5 µg m−3and 4%) in SMS.
5. Columnar (AOD and α) and near surface features (e.g. composite aerosol mass concentration, accumulation mode fraction and BC mass concentration) are well as-sociated during WMS and SMS, but deviate during the transition seasons.
Such distinct and significant temporal changes in the aerosol characteristics definitely have consequent impact on aerosol radiative forcing. This aspect is examined in Part 2 of this paper.
Acknowledgements. This work was done as a part of the Aerosol
Radiative Forcing over India (ARFI) project of ISRO-GBP. We thank P. S. Pillai and A. Saha for observational support. We thank the anonymous reviewers for several useful comments.
Topical Editor F. D’Andrea thanks B. V. KrishnaMurthy and another anonymous referee for their help in evaluating this paper.
References
˚
Angstr¨om, A.: The parameters of atmospheric turbidity, Tellus, 16, 64–75, 1964.
Asnani, G. C.: Tropical Meteorology, Vol.1 and Vol.2, Indian Insti-tute of Tropical Meteorology, Pashan, Pune, 1012 pp, 1993. Arnott, W. P., Hamasha, K., Moosmuller, H., Sheridan, P. J., and
Ogren, J. A.: Towards aerosol light-absorption measurements with a 7-wavelength aethalometer: Evaluation with a photoa-coustic instrument and 3-wavelength Nephelometer, Aerosol Sci. and Technol., 39(1), 17–29, 2005.
Babu, S. S. and Moorthy, K. K.: Aerosol black carbon over a trop-ical coastal station in India, Geophys. Res. Lett., 29(23), 2098, doi:10.1029/2002GL015662, 2002.
Babu, S. S., Satheesh, S. K., and Moorthy, K. K.: Aerosol radiative forcing due to enhanced black carbon at an urban site in India, Geophys. Res. Lett., 29(18), 1880, doi:10.1029/2002GL015826, 2002.
Babu, S. S., Moorthy, K. K., and Satheesh, S. K.: Aerosol Black Carbon over Arabian Sea during Inter Monsoon and Summer Monsoon Seasons, Geophys. Res. Lett., 31, L06104, doi:10.1029/2003GL018716, 2004.
Bhuyan, P. K., Gogoi, M. M., Moorthy, K. K.: Spectral and tem-poral characteristics of aerosol optical depth over a wet tropical location in North East India, Adv. Space Res., 35, 1423–1429, 2005.
Charlson, R. J., Schwartz, S. E., Hales, J. M., Cess, R. D., Coakley, J. A., Hansen, J. E., and Hofmann, D. J.: Climate forcing by anthropogenic aerosols, Science, 255, 423–430, 1992.
Corrigan, C. E., Ramanathan, V., and Scauer, J. J.: Im-pact of monsoon transitions on the physical and optical properties of aerosols, J. Geophys. Res., 111, D18208, doi:10.1029/2005JD006370, 2006.
Das, P. K.: Monsoons, Fifth IMO Lecture, WMO No. 613, World Meteorological Organisation, 1986.
Flossmann, A. I., Hall, W. D., and Pruppacher, H. R.: A theoretical study of the wet removal of atmospheric pollutants, I, The re-distribution of aerosol particles captured through nucleation and impaction scavenging by growing cloud drops, J. Atmos. Sci., 42, 583–606, 1985.
Ganguly, D., Jayaraman, A., and Gadhavi, H.: Physical and op-tical properties of aerosols over an urban location in western India: Seasonal variabilities, J. Geophys. Res., 111, D24206, doi:10.1029/2006JD007392, 2006.
Haywood, J. M., Roberts, D. L., Slingo, A., Edwards, J. M., and Shine, K. P.: General circulation model calculations of the direct radiative forcing by anthropogenic sulphate and fossil-fuel soot aerosol, J. Climate, 10, 1562–1577, 1997.
Hess, M., Koepke, P., and Schultz, I.: Optical properties of aerosols and clouds: The software package OPAC, B. Am. Meteor. Soc., 79, 831–844, 1998.
Hitzenberger, R., Petzold, A., Bauer, H., Ctyroky, P., Pouresmaeil, P., Laskus, L., and Puxbaum, H.: Intercomparison of Thermal
and Optical measurement Methods for Elemental Carbon and Black Carbon at an Urban Location, Environ. Sci. Technol., 6377–6383,2006.
Hoppel, W. A., Fitzgerald, J. W., Frick, G. M., and Larson, R. E.: Aerosol size distribution and optical properties found in the ma-rine boundary layer over the Atlantic ocean, J. Geophys. Res., 95, 3659–3686, 1990.
Huebert, B. J., Bates, T., Russell, P. B., Shi, G., Kim, Y. J., Kawa-mura, K., Carmichael, G., and Nakajima, T.: An overview of ACE-Asia: Strategies for quantifying the relationships between Asian aerosols and their climatic impacts, J. Geophys. Res., 108, 8633, doi:10.1029/2003JD003550, 2003.
Intergovernmental Panel on Climate Change (IPCC), Climate Change 2001: The Scientific Basis, Contribution of Working Group I to the Third assessment report of the Intergovernmental Panel on Climate Change, edited by: Houghton, J. T., Ding, Y., Griggs, D. J., Noguer, M., vander Linden, P. J., Dai, X., Maskell, K., and Johoson, C. A., Cambridge University Press, Cambridge, 2001.
Lelieveld, J., Crutzen, P. J., Ramanathan, V., et al.: The Indian Ocean Experiment: Widespread air pollution from South and Southeast Asia, Science, 291, 1031–1036, 2001.
Liley, B. J., Baumgardner, D., Kondo, Y., Kita, K., Blake, D. R., Koike, M., Machida, T., Takegawa, N., Kawakami, S., Shirai, T., and Ogawa, T.: Black carbon in aerosol during BIBLE B, J. Geophys. Res., 108(D3), 8399, doi:10.1029/2001JD000845, 2002.
Lohmann, U. and Feichter, J.: Global indirect aerosol effects: a re-view, Atmos. Chem. Phys., 5, 715–737, 2005, http://www.atmos-chem-phys.net/5/715/2005/.
McCartney, E. J.: Optics of the atmosphere, John Wiley, New York, 246–253, 1976.
Moorthy, K. K., Nair, P. R., and Murthy, B. V. K.: Size distribution of coastal aerosols: effects of coastal sources and sinks, J. Appl. Meteorol., 30, 844–852, 1991.
Moorthy, K. K., Murthy, B. V. K., and Nair, P. R.: Sea-breeze front effects on boundary layer aerosols at a tropical coastal station, J. Appl. Meteorol., 32, 1196–1205, 1993.
Moorthy, K. K., Satheesh, S. K., and Murthy, B. V. K.: Investiga-tions of marine aerosols over the tropical Indian Ocean, J. Geo-phys. Res., 102, 18 827–18 842, 1997.
Moorthy, K. K., Niranjan, K., Narasimhamurthy, B., Agashe, V. V., and Murthy, B. V. K.: Aerosol Climatology over India, 1. ISRO GBP MWR Network and Database, Scientific Report, ISRO GBP, SR 03 99, Indian Space Research Organization, In-dia, 1999.
Moorthy, K. K., Saha, A., Prasad, B. S. N., Niranjan, K., Jhurry, D., and Pillai, P. S.: Aerosol optical depths over peninsular In-dia and adjoining oceans during the INDOEX campaigns: Spa-tial, temporal and spectral characteristics, J. Geophys. Res., 106, 28 539–28 554, 2001.
Moorthy, K. K., Pillai, P. S., and Babu, S. S.: Influence of changes in Prevailing Synoptic conditions on the Response of Aerosol Characteristics to Land/Sea breeze circulation at a coastal sta-tion, Boundary Layer Meteorol., 108, 145–161, 2003a.
Moorthy K. K., Babu, S. S., and Satheesh, S. K.: Aerosol spectral optical depths over the Bay of Bengal: Role of transport, Geophys. Res. Lett., 30(5), 1249, 53-1 to 53-4, doi:10.1029/2002GL016520, 2003b.
Moorthy, K. K., Babu, S. S., and Satheesh, S. K.: Aerosol charac-teristics and radiative impacts over the Arabian Sea during inter-monsoon season: Results from ARMEX field campaign, J. At-mos. Sci., 62, 192–206, 2005a.
Moorthy, K. K., Sunilkumar, S. V., Pillai, P. S., Parameswaran, K., Nair, P. R., Ahmed, Y. N., Ramgopal, K., Narasimhulu, K., Reddy, R. R., Vinoj, V., Satheesh, S. K., Niranjan, K., Rao, B. M., Brahmanandam, P. S., Saha, A., Badarinath, K. V. S., Kiranc-hand, T. R., and Latha, K. M.: Wintertime Spatial Characteristics of Boundary Layer Aerosols over Peninsular India., J. Geophys. Res., 110, D08207, doi:10.1029/2004JD005520, 2005b. Muller, D., Franke, K., Wagner, F., Althausen, D., Ansmann, A.,
and Heintzenberg, J.: Vertical profiling of optical and physical particle properties over the tropical Indian Ocean with six wave-length lidar, 1, Seasonal cycle, J. Geophys. Res., 106, 28 567– 28 575, 2001.
Nair, V. S., Krishnamoorthy, K., Alappattu, D. P., Kunhikrishnan, P. K., George, S., Nair, P., Babu, S. S., Abish, B., Satheesh, S. K., Tripathi, S. N., Niranjan, K., and Badrinath. K.: Wintertime aerosol characteristics over the Indo Gangetic Plain (IGP): Im-pacts of local boundary layer processes and long-range transport, J. Geophys. Res., 112, D13205, doi:10.1029/2006JD008099, 2007.
Narayanan, V.: An observational study of the sea breeze at an equa-torial coastal station, J. Appl. Meteorol., 18, 497–504, 1967. Niranjan, K., Rao, B. M., Brahmanandam, P. S., Madhavan, B.
L., Sreekanth, V., and Moorthy, K. K.: Spatial characteristics of aerosol properties over the northeastern parts of peninsular India, Ann. Geophys., 23, 3219–3227, 2005, http://www.ann-geophys.net/23/3219/2005/.
Novakov, T., Bates, T. S., and Quinn, P. K.: Shipboard measure-ments of concentrations and properties of carbonaceous aerosols during ACE-2, Tellus Sr. B, 52(2), 228–238, 2000.
Parameswaran, K., Nair, P. R., Rajan, R., and Ramana, M. V.: Aerosol loading in coastal and marine environments in the In-dian Ocean region during winter season, Curr. Sci., 76, 947–955, 1999.
Pillai, P. S. and Moorthy, K. K.: Aerosol mass-size distributions at a tropical coastal environment: Response to measoscale and synoptic processes, Atmos. Environ., 35, 4099–4112, 2001. Pillai, P. S., Babu, S. S., and Krishna Moorthy, K.: A study of PM,
PM10 and PM2.5 concentration at a tropical coastal station, At-mos. Res., 61, 149–167, 2002.
Ramachandran, S.: Spectral aerosols characteristics during the northeast monsoon over the Arabian Sea and the tropical Indian Ocean: 2. Angstrom parameters and anthropogenic influence, J. Geophys. Res., 109, D19208, doi:10.1029/2003JD004483, 2004. Ramanathan, V., Crutzen, P. J., Lelieveld, J., et al.: Indian Ocean Experiment: An integrated analysis of the climate forcing and effects of the great Indo-Asian haze, J. Geophys. Res., 106, 28 371–28 398, 2001.
Reddy, M. S. and Venkataraman, C.: Direct radiative forcing from anthropogenic carbonaceous aerosols over India, Current Sci-ence, 76, 1005–1011, 1999.
Russell, P. B., Hobbs, P. V., and Stowe, L. L.: Aerosol properties and radiative effects in the United States East Coast haze plume: An overview of Tropospheric Aerosol Radiative Forcing Obser-vational Experiment (TARFOX), J. Geophys. Res., 104, 2213– 2222, 1999.
Saha, A. and Moorthy, K. K.: Impact of Precipitation on Aerosol Spectral Optical Depth and Retrieved Size Distributions: A Case Study, J. Appl. Meteorol., 43(6), 902–914, 2004.
Satheesh, S. K. and Moorthy, K. K.: Aerosol characteristics over coastal regions of the Arabian Sea, Tellus, 49B, 417–428, 1997. Satheesh, S. K., Ramanathan, V., Jones, X. L., Lobert, J. M.,
Podogorny, I. A., Prospero, J. M., Holben, B. N., and Leob, N. G.: A Model for the natural and anthropogenic aerosols for the tropical Indian ocean derived from Indian ocean Experiment data, J. Geophys. Res., 104(D22), 27 421–27 440, 1999. Satheesh, S. K., Moorthy, K. K., and Das, I.: Aerosol spectral
op-tical depths over Bay of Bengal, Indian ocean and Arabian Sea, Curr. Sci., 81, 1617–1625, 2001.
Satheesh, S. K., Ramanathan, V., Holben, B. N., Moorthy, K. K., Loeb, N. G., Maring, H., Prospero, J. M., and Savoie, D.: Chemical, microphysical, and radiative effects of Indian Ocean aerosols, J. Geophys. Res., 107, 4725, doi:10.1029/2002JD002463, 2002.
Shaw, G. E., Regan, J. A., and Herman, B. M.: Investigations of at-mospheric extinctions using direct solar radiation measurements made with a multiple wavelength radiometer, J. Appl. Meteor., 12, 374–380, 1973.
Sheridan, P. J., Arnott, W. P., Ogren, J. A., et al.: The Reno Aerosol Optics Study: An evaluation of aerosol absorption measurement methods, Aerosol Sci. Technol., 39, 1–16, 2005.
Singh, R. P., Dey, S., Tripathi, S. N., Tare, V., and Holben, B.: Variability of aerosol parameters over Kanpur, northern India, J. Geophys. Res., 109, D23206, doi:10.1029/2004JD004966, 2004. Smirnov, A., Royer, A., O’Neill, N. T., and Tarussov, A.: A study of the link between synoptic airmass type and atmospheric optical parameters, J. Geophys. Res., 99, 20 967–20 982, 1994. Smirnov, A., Holben, B. N., Savoi, D., et al.: Relationship between
column aerosol optical thickness and in situ ground based dust concentrations over Barbados, Geophys. Res. Lett., 27, 1643– 1646, 2000.
Smirnov, A., Holben, B. N., Kaufman, Y. J., Dubovik, O., Eck, T. F., Slutsker, I., Pietras, C., and Halthore, R. N.: Optical properties of atmospheric aerosol in maritime environment, J. Atmos. Sci., 59, 501–523, 2002.
Tripathi, S. N., Dey, S., Tare, V., and Satheesh, S. K.: Aerosol black carbon radiative forcing at an industrial city in northern India, Geophys. Res. Lett., 32, L08802, doi:10.1029/2005GL022515, 2005.
Twomey, S.: Atmospheric aerosols, Elsevier, Amsterdam-Oxford-New York, 278, 1977.
Vinoj, V. and Satheesh, S. K.: Measurements of aerosol opti-cal depth over Arabian Sea during summer monsoon season, Geophys. Res. Lett., 30(5), 1263, doi:10.1029/2002GL016664, 2003.
Waliser, D. E. and Gautier, C.: A satellite-derived climatology of the ITCZ, J. Climate., 6, 2162–2174, 1993.
Weingartner, E., Saathoff, H., Schnaiter, M., Strit, N., Bitnar, B., and Baltensperger, U.: Absorption of light by soot particles: de-termination of the absorption coefficient by means of aethalome-ters, J. Aerosol Sci., 34, 1445–1463, 2003.

![[PDF] Apostila de bootstrap 4 cours PDF [ES] | Cours Bootstrap](data:image/gif;base64,R0lGODlhAQABAIAAAP///wAAACH5BAEAAAAALAAAAAABAAEAAAICRAEAOw==)