HAL Id: insu-02928459
https://hal-insu.archives-ouvertes.fr/insu-02928459
Submitted on 2 Sep 2020
HAL is a multi-disciplinary open access
archive for the deposit and dissemination of
sci-entific research documents, whether they are
pub-lished or not. The documents may come from
teaching and research institutions in France or
abroad, or from public or private research centers.
L’archive ouverte pluridisciplinaire HAL, est
destinée au dépôt et à la diffusion de documents
scientifiques de niveau recherche, publiés ou non,
émanant des établissements d’enseignement et de
recherche français ou étrangers, des laboratoires
publics ou privés.
Interpretation of Cluster data on chorus emissions using
the backward wave oscillator model
V. Yu. Trakhtengerts, A. G. Demekhov, E.E. Titova, B. V. Kozelov, O.
Santolik, D Gurnett, Michel Parrot
To cite this version:
V. Yu. Trakhtengerts, A. G. Demekhov, E.E. Titova, B. V. Kozelov, O. Santolik, et al.. Interpretation
of Cluster data on chorus emissions using the backward wave oscillator model. Physics of Plasmas,
American Institute of Physics, 2004, 11 (4), pp.1345-1351. �10.1063/1.1667495�. �insu-02928459�
Physics of Plasmas 11, 1345 (2004); https://doi.org/10.1063/1.1667495 11, 1345
© 2004 American Institute of Physics.
Interpretation of Cluster data on chorus
emissions using the backward wave
oscillator model
Cite as: Physics of Plasmas 11, 1345 (2004); https://doi.org/10.1063/1.1667495
Submitted: 25 August 2003 . Accepted: 24 November 2003 . Published Online: 24 March 2004 V. Y. Trakhtengerts, A. G. Demekhov, E. E. Titova, B. V. Kozelov, O. Santolik, D. Gurnett, and M. Parrot
ARTICLES YOU MAY BE INTERESTED IN
Electron holes in phase space: What they are and why they matter
Physics of Plasmas 24, 055601 (2017); https://doi.org/10.1063/1.4976854 Electron-acoustic solitary waves in the Earth's inner magnetosphere
Physics of Plasmas 25, 022905 (2018); https://doi.org/10.1063/1.5007907 Parameter spaces for linear and nonlinear whistler-mode waves
Interpretation of Cluster data on chorus emissions using the backward
wave oscillator model
V. Y. Trakhtengerts and A. G. Demekhov Institute of Applied Physics, Nizhny Novgorod, Russia E. E. Titova and B. V. Kozelov
Polar Geophysical Institute, Apatity, Russia O. Santolik
Charles University, Prague, Czech Republic D. Gurnett
University of Iowa, Iowa City, Iowa M. Parrot
CNRS/LPCE, Orleans, France
共Received 25 August 2003; accepted 24 November 2003; published online 24 March 2004兲
The measurements of chorus emissions by four closely separated Cluster spacecraft provide important information concerning the chorus generation mechanism. They confirm such properties of the wave source as their strong localization near the equatorial cross section of a magnetic flux tube, an almost parallel average wave-vector direction with respect to the geomagnetic field, and an energy flux direction pointing outward from the generation region. Inside this region, Cluster discovered strong temporal and spatial variations in the amplitude with correlation scale lengths of the order of 100 km across the magnetic flux. The wave electric field reached 30 mV/m, and the maximum growth and damping rates are of the order of a few hundreds of s⫺1. These and other properties of the detected chorus emissions are discussed here in relation with the backward wave oscillator mechanism. According to this mechanism, a succession of whistler wave packets is generated in a small near-equatorial region with temporal and spatial characteristics close to the Cluster data. Amplitudes and frequency spectra, as well as dynamical features of the Poynting flux of chorus are estimated and compared with the Cluster measurements. © 2004 American Institute
of Physics. 关DOI: 10.1063/1.1667495兴
I. INTRODUCTION
Chorus is the most wide-spread type of natural discrete electromagnetic ELF/VLF emissions, which accompany the main and recovery phases of magnetic storms.1,2Apparently, it is the most important type of electromagnetic emssions in the magnetosphere, providing precipitation of bulk energetic electrons from radiation belts3,4 and essentially contributing to the acceleration of MeV electrons.5
At the same time, chorus emissions remain the most in-triguing signals among natural ELF/VLF radiation. They consist of a succession of discrete elements with rising fre-quency, with a repetition period of T⬃0.1– 1 s. According to ground-based observations the typical duration of a chorus event is 0.5–1 h or more. Satellite measurements6,7show that chorus is generated in a narrow region near the equatorial cross section of a magnetic flux tube, and appears as whistler waves whose wave vector kជ is close to the direction of the magnetic field Hជ. As a rule, chorus is accompanied by hiss emissions which serve as a lower frequency background for the discrete elements. For more detailed information about chorus emissions one can refer to Refs. 1, 2, and 8.
It is generally accepted that the generation mechanism of chorus is connected with the cyclotron instability 共CI兲 of
radiation belt 共RB兲 electrons. The similarity of the spectral forms of chorus elements and of triggered ELF/VLF emis-sions has stimulated the application of the theory of triggered signals to explain chorus generation. Helliwell9 suggested a phenomenological model of the generation of discrete emis-sions, based on the second-order cyclotron resonance. This model stimulated further analytical10 and computational11 studies共see Ref. 12 for more detail兲. New step in the quan-titative theory of chorus generation was made in Ref. 13, where the backward wave oscillator 共BWO兲 generation mechanism was suggested.
Backward-wave oscillators are well known in electronics,14 but application of this knowledge to the mag-netospheric conditions is not trivial. The matter of fact is that laboratory BWOs use beams of electron oscillators共electrons gyrating in the magnetic field兲 with small dispersion in both perpendicular (v⬜) and parallel (v储) velocities with respect
to the geomagnetic field:⌬v⬜/v⬜Ⰶ1 and ⌬v储/v储Ⰶ1. Under
RB conditions, such beams are absent. However, it was shown in Ref. 13 that not only delta-like distribution func-tion but also sufficiently sharp gradients共step-like deforma-tions兲 in the velocity space can lead to the BWO generation regime. According to Ref. 15, such step-like features appear naturally upon the development of the cyclotron instability
PHYSICS OF PLASMAS VOLUME 11, NUMBER 4 APRIL 2004
1345
共CI兲 of RB and generation of noise-like ELF emissions.
Actually, if there is an upper-frequency cutoff max in the spectrum of noiselike emissions, then it follows from the cyclotron resonance condition
⫺H⫽k储v储, 共1兲
that the resonant particles occupy the region bounded from below in the equatorial values of the field-aligned velocity:
兩v储L兩⭓兩v储兩⫽
冏
H⫺ k储冏
⭓冏
HL⫺max k储L冏
. 共2兲Here, H is the electron gyrofrequency, and the subscript
‘‘L’’ denotes the values in the equatorial plane. In the reso-nant region, the distribution function is isotropized due to the velocity diffusion, while this process is absent in the non-resonant region. Therefore, a step is formed at the boundary
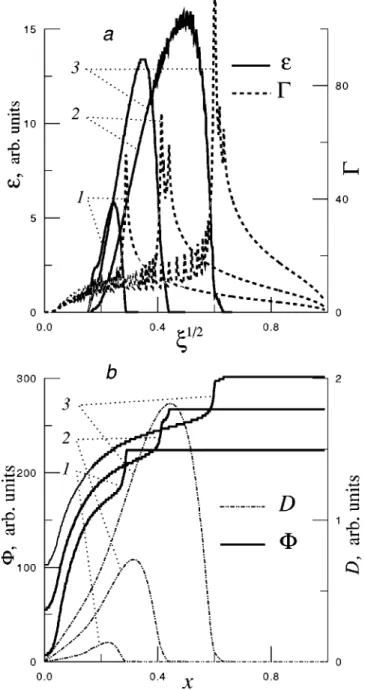
v储L⫽(max⫺HL)/k储L. This is shown in Fig. 1 on the
ex-ample of numerical calculation.15 Upper panel shows the whistler wave energy density 共兲 and gain ⌫共兲, where
⫽1⫺0/, 0⫽HL/*, and *⫽(pL/HL)2(v/c)2.
Lower panel shows the angle distribution and pitch-angle diffusion coefficient D (x⫽sinL, where L is the
equatorial pitch angle兲. The snapshots are taken for subse-quent time moments during generation of a noise-like emis-sion in the simulation. One can see that a moving sharp step is formed in this case, accompanied by excitation of higher-frequency noise-like emissions.
II. BASIC FEATURES OF THE BWO GENERATION MODEL OF CHORUS EMISSIONS
The BWO model of chorus generation is based on a specific modulation of the distribution function of energetic electrons in the course of CI development, which leads to the appearance of a coherent energetic electron clusters and gen-eration of discrete ELF/VLF electromagnetic emission. This interaction manifests itself as the absolute cyclotron instabil-ity which develops in the local region near the equatorial cross section of the magnetic flux tube. The length lBWO of
the generation region along the magnetic field line is equal to9,12,13,16
lBWO⯝1.76共RE
2
L2/6兲1/3, 共3兲 where is the wavelength, RE is the Earth’s radius, and L is
the McIlwain parameter. The factor 1.76 was obtained in numerical study of the linear BWO theory in the parabolic magnetic field.16 At the initial stage of chorus generation, such a specific evolution is seen as a step-like deformation function of the energetic electrons in field-aligned velocities
共Fig. 1兲. In the case of a step-like distribution function, the
absolute instability is realized, if the wave growth rate␥step for the step-like distribution function 共Fig. 1兲 of energetic electrons exceeds some threshold value␥thr. The growth rate
of the absolute共BWO兲 instability is equal to13
␥BWO⫽ 2 8T0Q共Q⫺1兲. 共4兲 Here, Q⫽␥step ␥thr ⫽ 2lBWO 共vgvstep兲1/2 ␥step 共5兲
is the dimensionless parameter showing the excess of the threshold, which is proportional to the hydrodynamic growth rate ␥step⫽0.25ph⬜b1/2, ␥thr⫽/T0, T0⫽lBWO
冉
1 vg ⫹ 1 vstep冊
, 共6兲ph⫽(4e2Nh/m)1/2, Nh is the density of energetic
elec-trons, ⬜⫽u⬜ 0/c, u⬜ 0 is the characteristic velocity across the magnetic field, b⫽⌬Nh/Nh is the relative height of the
step, which is typically about 10%–20% in our simulations, and vg and vstep are the group velocity and velocity at the
step, respectively.
FIG. 1. Formation of sharp drops共steps兲 in the velocity space 共from Ref. 15兲.
If the inequality ␥step⬎␥thr is satisfied, then the
ampli-tude of a whistler wave which is in cyclotron resonance with the step, grows exponentially in time in the local region near the equatorial cross section with the growth rate given in共4兲. This absolute instability is due to the phase bunching of step electrons, which produces a positive feedback between a whistler-mode wave and a hot-plasma mode supported by the energetic electron ‘‘beam.’’
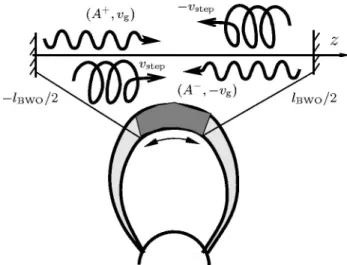
Actually, if the step is formed, two ‘‘beams’’ of energetic electrons appear with a sharp front in the field-aligned veloc-ity component, which move in ⫾z directions 共Fig. 2兲 with the velocities ⫾vstep and generate chorus independently in
opposite directions. If the growth rate ␥BWO is sufficiently large, the nonlinear phase bunching effects result in the tran-sition from the growing phase of the wave amplitude to the damping phase. This corresponds to some bifurcations in the generation regimes, with transition from the stationary to the periodic one, and then to a stochastic regime.14Chorus gen-eration can be associated with the two latter regimes.
Dynamics of these regimes is described by the wave equation with nonlinear current of energetic electrons 共see, e.g., Ref. 10兲.
There is a rich experience in computer modeling of cy-clotron whistler-mode generation, based on this equation
共e.g., Refs. 11, 17, and 18兲. However, a computer simulation
of the BWO regime with the step-like distribution is rather complicated and has not been realized yet. The situation is simplified in the case of a model with wave-particle interac-tion in two discrete points located symmetrically to the equa-tor, z1,2⫽⫾lBWO/2, where the cyclotron resonance is
ful-filled 共Fig. 2兲. Theoretical and experimental studies of the laboratory BWOs with the initial electron distribution as
␦-function in the velocity space (F⬀␦(v⬜⫺v⬜0)␦(v储
⫺v储0)) showed that the two-point interaction model
pre-serves the basic qualitative and many quantitative features of the BWO generation, which are observed in distributed BWO systems.14Similar model can be obtained for the step-like distribution function. Leaving the details for a separate paper, we write the final nonlinear equation for the whistler
wave amplitude in the following form共for chorus propagat-ing in the⫹z direction兲:
A⫹共lBWO/2,t兲⫽qA⫹共lBWO/2,t⫺T0兲
⫻关1⫺共A⫹共l
BWO/2,t⫺T0兲兲
2兴, 共7兲
where A⫹(lBWO/2,t) is the dimensionless chorus amplitude at the point z⫽lBWO/2, and the parameter q is related to the BWO growth rate as
q⫽1⫹2␥BWOT0⫽1⫹ 2
8 Q共Q⫺1兲 共8兲
关see Eqs. 共4兲–共6兲 for notations兴.
For the opposite direction,
A⫺共⫺lBWO/2,t
⬘
兲⫽qA⫺共⫺lBWO/2,t⬘
⫺T0兲⫻关1⫺共A⫺共⫺l
BWO/2,t
⬘
⫺T0兲兲2兴.共9兲
As q increases, Eqs. 共7兲 and 共9兲 demonstrate the transition between all the above-mentioned generation regimes, i.e., from the stationary generation with constant amplitude at 1
⬍q⬍2, to a regime with periodic amplitude modulation at q⬎2, and to the stochastic generation at q⬎2.3.
The amplitude兩H⬃⫾兩 of the wave magnetic field is related with A⫾ as follows: 兩H⬃⫾兩⫽2 3/2 phmvstep 2 ku⬜ 0e lBWO b1/2A⫾, 共10兲 where k is the wave vector (kជ储Hជ0), and the other notations
have been introduced above.
It is clear from Eqs. 共7兲 and 共9兲 that the saturation am-plitude is
A⫾⬃1. 共11兲
Using the definitions共4兲 to 共6兲 and 共10兲, we can obtain from
共11兲 the maximum value of 兩H⬃兩 for q⯝2,
兩H⬃兩m⯝ ␦m ek⬜␥BWO
2
, 共12兲
where ␦⯝6 for /HL⯝0.5, ⬜⫽u⬜ 0/c, and ␥BWO
⯝2/(4T
0) 关see 共4兲兴.
It is also possible to estimate the characteristic chorus amplitude in a different way. In the case of the absolute instability, such an estimate can be obtained from the relation12
⍀tr/␥BWO⯝32/共3兲, 共13兲
where␥BWOis determined by共4兲 and the trapping frequency
⍀tr is equal to
⍀tr⫽共k u⬜ 0HL兩H⬃兩/HL兲1/2. 共14兲
From共13兲 and 共14兲 we have
兩H⬃兩⫽
10m
ek⬜␥BWO 2
. 共15兲
As one could expect, the estimates共12兲 and 共15兲 are close to each other.
FIG. 2. Schematic picture of magnetospheric BWO.
1347 Phys. Plasmas, Vol. 11, No. 4, April 2004 Interpretation of Cluster data on chorus emissions . . .
Equations共7兲 and 共9兲 describe the dynamics of the wave amplitude at the base frequency, corresponding to the step velocity, and determine retriggering of the next element at this frequency. Formation of the entire chorus element is related to the sideband instability,19which results in the gen-eration of new frequencies.17 Rigorous consideration of the chorus element formation requires sophisticated computer simulations of the complete problem, which are beyond the scope of this paper. We restrict ourselves to the qualitative consideration, suggesting that a chorus element is formed as a succession of sidebands separated from each other by the frequency interval⌬ f ⬃⍀tr/(2) and growing with the tem-poral rate␥BWO. Taking into account共13兲, we obtain
df
dt⬃⌬ f␥BWO⬃0.5␥BWO
2 . 共16兲
This estimation is close to the one which follows from the optimum condition for cyclotron interaction of an electron with a whistler wave in an inhomogeneous magnetic field.10,12
In the following sections, we use the obtained relations for the discussion of specific chorus data from Cluster.
III. PROPERTIES OF VLF DYNAMICS IN THE MAGNETOSPHERIC BWO
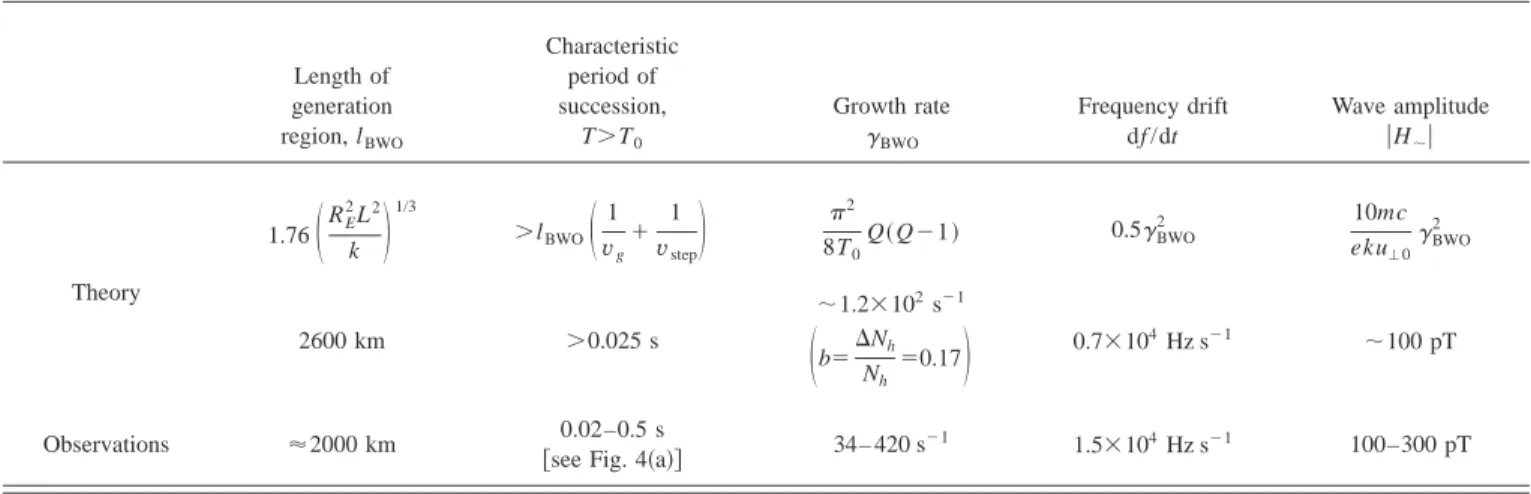
Relations共3兲 to 共4兲, 共12兲, and 共16兲 allow one to deter-mine the basic parameters of chorus emission. These param-eters are given in Table I, which summarizes their analytical expressions, their estimates for the particular values of the magnetic field, the cold plasma density and the radiation electron parameters, and their comparison with Cluster data
FIG. 3. Upper panel, dynamic spec-trum of VLF waves observed by Clus-ter 1 during its pass through the equa-torial region on April 18, 2002
关electric field fluctuations recorded by
the WBD instrument 共Ref. 20兲兴. Middle panel, Parallel component of the Poynting vector normalized by its standard deviation from the measure-ment of the STAFF–SA instrumeasure-ments on board the four Cluster spacecraft
共spacecraft indicated by different
col-ors兲 共Ref. 20兲. Position is given on the bottom for Cluster 1: R, radial dis-tance; MLat, magnetic dipole latitude; MLT, magnetic local time. Lower panel, Poynting flux (A⫹)2⫺(A⫺)2 共in arbitrary units兲 resulted from
simu-lations performed using the discrete model共7兲–共9兲.
TABLE I. Summary of chorus parameters in the BWO model. Numerical estimates are obtained for the event shown in Fig. 3 and studied experimentally in Ref. 20. Basic parameters are L⫽4.4, cold plasma density Nc⬃2 cm⫺3, and/HL⬇0.45 关see Fig. 3共a兲兴. From that, we obtain the resonant parallel energy
Wres⫽(m/2)((HL⫺)/k)2⯝62 keV and the wavelength ⬃26 km. The flux density of energetic electrons is assumed to be S⬃4⫻108cm⫺2s⫺1.
Length of generation region, lBWO Characteristic period of succession, T⬎T0 Growth rate ␥BWO Frequency drift df /dt Wave amplitude 兩H⬃兩 Theory 1.76
冉
RE 2 L2 k冊
1/3 ⬎lBWO冉
1 vg⫹ 1 vstep冊
2 8T0 Q共Q⫺1兲 0.5␥BWO 2 10mc eku⬜0␥BWO 2 2600 km ⬎0.025 s ⬃1.2⫻102s⫺1冉
b⫽⌬Nh Nh ⫽0.17冊
0.7⫻104Hz s⫺1 ⬃100 pT Observations ⬇2000 km 0.02–0.5 s关see Fig. 4共a兲兴 34– 420 s⫺1 1.5⫻104Hz s⫺1 100–300 pT
for the event studied experimentally in Ref. 20. The dynamic frequency spectrum and the normalized Poynting vector for this event are represented in Figs. 3共a兲 and 3共b兲, respectively.24 Below, we discuss these estimates and com-pare the experiment and theory in more detail.
A. Space–time evolution
Equations共7兲–共9兲 allow us to consider the dynamics of chorus generation. Computer simulations of this dynamics are shown in Fig. 3共c兲. Here, the center of the source region (z⫽0) was placed at GMlat⫽1°. To calculate the wave am-plitude as seen by a satellite moving along the magnetic field line, we generate time series for amplitudes A⫾ at the start-ing points ⫿lBWO/2, respectively, and assume that the
am-plitudes remain constant while the waves propagate from their starting points. The amplitude is zero upstream of the starting point, i.e., A⫹(z⬍⫺lBWO/2)⫽A⫺(z⬎lBWO/2)⫽0. This scheme yields both amplitudes at any time and at any point z, so we can recalculate them onto the satellite trajec-tory.
For the simulations, the value of q must be chosen. Here, we assume that the step sharpness and amplitude fluctuate randomly, and specify q as a random value distributed uni-formly within some range. There are several processes which can lead to a random variation in the parameters of the step. The shortest time scale of such a variation can be related to the reabsorption of a chorus element outside the generation region; this time scale can be of the same order as T0.
Varia-tions in q can also be related to bounce-oscillaVaria-tions of ener-getic electrons with time scales Tbⱗ1 s. Longer time scales
arise due to the finite time of transverse correlation of the electron distribution, which is about the drift time through the BWO source region. According to Ref. 21, the transverse size of the chorus source is about 70–100 km, which yields the drift time about 4 – 6 s for 60 kev electrons. Source varia-tions can also take place due to the magnetic field fluctua-tions. Such variations have been reported, e.g., in Ref. 7 and had time scales of several seconds. As it is discussed in the next section, the assumption of a random variation in q is important to explain temporal characteristics of the emis-sions.
For the result shown in Fig. 3共c兲, the distribution of q variations was assumed uniform within the range 关0.3,2.3兴
共note that the threshold value of q⫽1 corresponds to the
relative height of the step b⫽17%, see Table I兲, and the time scale of q variations was chosen about 4 s. These calcula-tions represent fairly well the chorus dynamics observed by Cluster, as it crossed the equator, moving along the magnetic field line关Fig. 3共b兲兴. The most important quantitative aspect of this agreement is the good coincidence between the esti-mated and observed sizes of the chorus source. The latitudi-nal extent of the source is about 3°, if we use the parameters shown in Table I. If shorter time scales are allowed for the q variation, then the simulated spikes become more frequent, but the overall picture remains the same. Note that the simple discrete model used here does not take into account the am-plitude variation along the group ray path and averaging over the detector timescale. Qualitatively, these factors together lead to a smooth variation of the parallel component of the
Poynting flux from negative values on the one side of the source region to positive ones, on the other side.
B. On–off intermittency of the VLF chorus
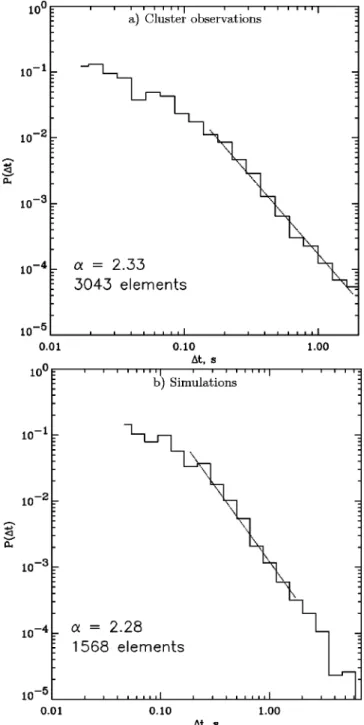
Statistical analysis of chorus spectrograms obtained from Cluster data 共Fig. 3兲 revealed interesting regularities in the distribution of time intervals between chorus elements. This distribution, shown in Fig. 4共a兲, could be approximated by the power-law function
P⬀共⌬t兲⫺␣, 共17兲
FIG. 4. Distribution of time intervals between chorus elements as seen by Cluster and simulated using the discrete BWO model. On–off intermittency manifests itself by the power-law behavior of the distribution, P⬀(⌬t)⫺␣.
1349 Phys. Plasmas, Vol. 11, No. 4, April 2004 Interpretation of Cluster data on chorus emissions . . .
where P is the probability density for the time interval ⌬t between chorus elements. Fitting observations to the power-law function yields ␣⯝2.33.
Such a dependence does not follow from the model共7兲 to共9兲 if the coefficients are assumed to be constant. In real-ity, the parameter q changes in time both regularly and ran-domly. Calculations show that the power law for P(⌬t) is obtained if q varies randomly in time. In our calculations, q was changing as a random value distributed uniformly within the interval 关0.3–2.3兴. In this case, the power-law exponent
␣⯝2.28 is close to the experimentally obtained one. Here,
we allowed the time scales of the q variation to be as short as the BWO characteristic time T0. The possible nature of such
variations is discussed in Sec. III A. Actually, the obtained power law for P(⌬t) corresponds to the well-known ‘‘on– off’’ intermittency regime22 with some features specific for the discrete BWO model. More detailed analysis of this problem is presented in Ref. 23. Note that the chosen short-est time scale of the q variation determines the lower limit (⌬t)min in the power-law dependence of P(⌬t), and the
power-law exponent is determined mainly by the minimum value of q.
C. Fine structure in wave dynamics
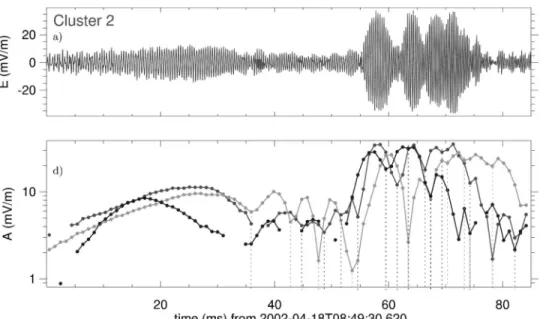
Figure 5 shows fine structure of the same event as in Fig. 3 with temporal resolution of 1 ms.24 One can see some pulses 共satellites兲 varying with characteristic time scale
⬃10 ms. According to the BWO model, the nonlinear stage
of chorus generation is determined by trapping of energetic particles at the step-like feature, which leads to sideband formation at time scale of about ␥BWO⫺1 . Subsequent bursts are then generated with frequency shift of about ⍀tr/(2)
one from another.
Therefore, one can expect temporal modulation in VLF wave amplitude, which is confirmed by the plots shown above. Using the parameters specified in Table I, we obtain
⍀tr⬃102– 103 s⫺1, which corresponds to the temporal scale
of fine structure ⬃6 – 60 ms.
D. Relation between chorus and hiss emissions
Figure 6 shows an example of good correlation between chorus and hiss emissions, where groups of chorus elements ( f⫽2 – 3 kHz) are observed simultaneously with separate hiss bursts at a lower frequency.24This corresponds
qualita-FIG. 5. Panels共a兲 and 共d兲 from Fig. 6 in Ref. 20, representing fine structure of a chorus element.
FIG. 6. An example of good correla-tion between chorus and hiss emis-sions in Cluster data.
tively to the BWO model.12 However, it is noteworthy that such close correlation between chorus and hiss is not always present in Cluster observations. We think that sharp gradients in the phase space, which are needed for switching on the absolute instability, can appear at the developed phase of the BWO generation due to the reabsorbtion of a chorus ele-ment, as it propagates along the magnetic flux tube from its central cross section and interacts with new incoming elec-trons. It would be important to find experimental evidences of such effects.
IV. CONCLUSIONS
The BWO generation model is a good candidate to ex-plain quantitatively chorus emissions at frequencies below
fH/2, observed by Cluster satellites. Within the framework of this model, it is possible to explain the properties of the chorus source, such as its location and the direction of the energy flux, the chorus growth rate, the frequency drift, and the amplitude.
At the same time, some principal questions remain un-clear. First, it concerns relation between chorus and hiss emissions and formation of a step-like distortion at the elec-tron distribution function.
The second question is which processes determine the correlation of chorus emissions across the geomagnetic field, in particular, whether there are whistler mode ducts in the generation region.
It is important to study the chorus emissions at frequen-cies f⬎ fH/2, in particular, to check if there is a relation
between the chorus above and below fH/2.
In the field of theory, computer simulations of the step formation using nonquasilinear approach are needed, such as hybrid simulations.18 In this approach, chorus generation should be a part of the common process of the cyclotron instability development.
ACKNOWLEDGMENTS
A.D. and V.T. acknowledge support from the Russian Foundation for Basic Research共Grant No. 02-02-17109兲 and from the Program for Basic Research of the Russian Acad-emy of Sciences. Part of this work was done during the visit of V.T., A.D., E.T., B.K., and O.S. to Sodankyla¨ Geophysical Observatory, supported by the EU LAPBIAT program, and during the visit of E.T. and V.T. to Bern, Switzerland, sup-ported by International Space Science Institute. O.S. and
M.P. acknowledge discussions of the STAFF data with N. Cornilleau-Wehrlin, C. Harvey, M. Maksimovic, and Y. de Conchy. We thank P. De´cre´au and P. Canu for estimating the plasma density from the data of the Whisper experiment, and the access to the spin-resolution data of the FGM magnetic field experiment 共PI A. Balogh兲 used for reference. The WBD research was supported by the NASA Goddard Space Flight Center under Grant No. NAG5-9974. O.S. acknowl-edges additional support from Grants Nos. ME 650 and GACR 202/03/0832.
1
R. A. Helliwell, Rev. Geophys. 7, 281共1969兲.
2
S. S. Sazhin and M. Hayakawa, Planet. Space Sci. 40, 681共1992兲.
3R. B. Horne and R. M. Thorne, Geophys. Res. Lett. 30, 1527共2003兲. 4J. L. Roeder, J. R. Benbrook, E. A. Bering, and W. R. Sheldon, J. Geophys.
Res. 90, 10975共1985兲.
5
N. P. Meredith, M. Cain, R. B. Horne, R. M. Thorne, and R. R. Anderson, J. Geophys. Res. 108, 1248共2003兲.
6M. J. LeDocq, D. A. Gurnett, and G. B. Hospodarsky, Geophys. Res. Lett. 25, 4063共1998兲.
7
M. Parrot, O. Santolik, N. Cornilleau-Wehrlin, M. Maksimovic, and C. Harvey, Ann. Geophys. 21, 473共2003兲.
8R. A. Helliwell, Whistlers and Related Ionospheric Phenomena共Stanford
University Press, Palo Alto, CA, 1965兲.
9R. A. Helliwell, J. Geophys. Res. 72, 4773共1967兲. 10
Y. Omura, D. Nunn, H. Matsumoto, and M. J. Rycroft, J. Atmos. Terr. Phys. 53, 351共1991兲.
11D. Nunn, Y. Omura, H. Matsumoto, I. Nagano, and S. Yagitani, J.
Geo-phys. Res. 102, 27083共1997兲.
12V. Y. Trakhtengerts, Ann. Geophys. 17, 95共1999兲. 13
V. Y. Trakhtengerts, J. Geophys. Res. 100, 17205共1995兲.
14N. S. Ginzburg and S. P. Kuznetsov, Relativistic HF Electronics共Inst. of
Appl. Phys., Gorky, USSR, 1981兲, pp. 101–144, in Russian.
15V. Y. Trakhtengerts, M. J. Rycroft, and A. G. Demekhov, J. Geophys. Res. 101, 13293共1996兲.
16
A. G. Demekhov, D. Nunn, and V. Y. Trakhtengerts, Phys. Plasmas 10, 4472共2003兲.
17D. Nunn, Comput. Phys. Commun. 60, 1共1990兲.
18D. Nunn, A. G. Demekhov, V. Y. Trakhtengerts, and M. J. Rycroft, Ann.
Geophys. 21, 481共2003兲.
19D. Nunn, Planet. Space Sci. 22, 349共1974兲.
20O. Santolik, D. A. Gurnett, J. S. Pickett, M. Parrot, and N.
Cornilleau-Wehrlin, J. Geophys. Res. 108, 1278共2003兲.
21
O. Santolı´k and D. A. Gurnett, Geophys. Res. Lett. 30, 1031共2003兲.
22
J. F. Heagy, N. Platt, and S. M. Hammel, Phys. Rev. E 49, 1140共1994兲.
23B. V. Kozelov, E. E. Titova, A. A. Lubchich, V. Y. Trakhtengerts, and J.
Manninen, Geomagn. Aeron. 43, 593共2003兲.
24See EPAPS Document No. E-PHPAEN-11-032404 for color versions of
Figs. 3, 5, and 6 of this paper. A direct link to this document may be found in the online article’s HTML reference section. The document may also be reached via the EPAPS homepage 共http://www.aip.org/pubservs/ epaps.html兲 or from ftp.aip.org in the directory /epaps/. See the EPAPS homepage for more information.
1351 Phys. Plasmas, Vol. 11, No. 4, April 2004 Interpretation of Cluster data on chorus emissions . . .