HAL Id: hal-00317316
https://hal.archives-ouvertes.fr/hal-00317316
Submitted on 8 Apr 2004
HAL is a multi-disciplinary open access
archive for the deposit and dissemination of
sci-entific research documents, whether they are
pub-lished or not. The documents may come from
teaching and research institutions in France or
abroad, or from public or private research centers.
L’archive ouverte pluridisciplinaire HAL, est
destinée au dépôt et à la diffusion de documents
scientifiques de niveau recherche, publiés ou non,
émanant des établissements d’enseignement et de
recherche français ou étrangers, des laboratoires
publics ou privés.
Impact of absorbing aerosols on the simulation of
climate over the Indian region in an atmospheric general
circulation model
A. Chakraborty, S. K. Satheesh, R. S. Nanjundiah, J. Srinivasan
To cite this version:
A. Chakraborty, S. K. Satheesh, R. S. Nanjundiah, J. Srinivasan. Impact of absorbing aerosols on
the simulation of climate over the Indian region in an atmospheric general circulation model. Annales
Geophysicae, European Geosciences Union, 2004, 22 (5), pp.1421-1434. �hal-00317316�
SRef-ID: 1432-0576/ag/2004-22-1421 © European Geosciences Union 2004
Annales
Geophysicae
Impact of absorbing aerosols on the simulation of climate over the
Indian region in an atmospheric general circulation model
A. Chakraborty, S. K. Satheesh, R. S. Nanjundiah, and J. Srinivasan
Centre for Atmospheric and Oceanic Sciences, Indian Institute of Science, Bangalore 560012, India
Received: 16 April 2003 – Revised: 30 November 2003 – Accepted: 11 December 2003 – Published: 8 April 2004
Abstract. The impact of anthropogenic absorbing aerosols
(such as soot) on the climate over the Indian region has been studied using the NCMRWF general circulation model. The absorbing aerosols increase shortwave radiative heating of the lower troposphere and reduce the heating at the surface. These effects have been incorporated as heating of the lower troposphere (up to 700 hPa) and cooling over the continen-tal surface based on INDOEX measurements. The heating effect is constant in the pre-monsoon season and reduces to zero during the monsoon season. It is shown that even in the monsoon season when the aerosol forcing is zero, there is an overall increase in rainfall and a reduction in surface tem-perature over the Indian region. The rainfall averaged over the Tropics shows a small reduction in most of the months during the January to September period.
The impact of aerosol forcing, the model’s sensitivity to this forcing and its interaction with model-physics has been studied by changing the cumulus parameterization from the Simplified Arakawa-Schubert (SAS) scheme to the Kuo scheme. During the pre-monsoon season the major changes in precipitation occur in the oceanic Inter Tropical Conver-gence Zone (ITCZ), where both the schemes show an in-crease in precipitation. This result is similar to that reported in Chung et al. (2002). On the other hand, during the mon-soon season the changes in precipitation in the continental region are different in the SAS and Kuo schemes. It is shown that the heating due to absorbing aerosols changes the verti-cal moist-static stability of the atmosphere. The difference in the precipitation changes in the two cumulus schemes is on account of the different responses in the two parameteriza-tion schemes to changes in vertical stability.
Key words. Atmospheric composition and structure (aerosols and particles) – Meteorology and atmospheric dynamics (tropical meteorology; precipitation)
Correspondence to: A. Chakraborty
(arch@caos.iisc.ernet.in)
1 Introduction
There has been serious concern recently regarding anthro-pogenic absorbing aerosols, such as soot on large-scale en-vironment. The Indian subcontinent is considered to be a major source of this anthropogenically generated pollutants during the period January to March. Observational studies of Satheesh et al. (1999) have shown that these aerosols can be noticed as far as the southern Indian Ocean. This anthro-pogenic aerosol loading has a distinct seasonal cycle with a maximum before the Indian summer monsoon season and a minimum during the monsoon season (June to September), due to the leaching effect of rain. The anthropogenic aerosols increase again during the post-monsoon period. Aerosols can cool (negative forcing) or warm (positive forcing) the atmosphere depending upon the relative dominance of the absorbing aerosols. Recent investigations over the tropical Indian Ocean have shown that inspite of its small contribu-tion to optical depth (∼11%) soot plays an important role in determining the overall radiative forcing (Satheesh and Ra-manathan, 2000). However, when the amount of absorbing aerosols such as soot are significant, aerosol optical depth and chemical composition are not the only determinants of aerosol radiative effects, but the type of surface below is also important. When the amount of soot is large over land (where surface reflection is high), aerosol forcing can be positive (Satheesh, 2002). Recent experiments over Bangalore, an urban site in India, have shown that atmospheric forcing is as high as +28 Wm−2and surface forcing is −23 Wm−2(Babu
et al., 2002). The effect of soot absorption is significantly larger over land compared to that over ocean because the re-flectance of land is much higher (15 to 25%) and the radiation reflected from the surface below will interact with the aerosol more than once due to reflection from below. Hence, the ef-fect of these anthropogenic absorbing aerosols is twofold: i) they increase the absorption of the incoming shortwave ra-diation in the lower troposphere (up to about 3 km) and ii) reduce the absorption at the surface. This leads to cooling of the surface and heating of the lower troposphere.
1422 A. Chakraborty et al.: Aerosol and Indian Monsoon
Fig. 1. Prescribed aerosol forcing to the model: a) Heating rate of the lowest 7 model layers. Lower troposphere forcing was assumed to be
uniform in the lowest 7 model layers; b) Column integrated forcing F(A) prescribed in the model in the lowest 7 layers; c) Surface forcing F(S) prescribed; and d) Area mean lower troposphere and surface forcing. Forcing was kept constant from 1 January to 15 April and linearly approached zero by 15 May. The area mean ratio R = F(S)/F(A) equals 0.77 for those grid points where F(A) exceeds 3 Wm−2and F(S) has nonzero value.
In a recent study Chung et al. (2002) examined the impact of these aerosols on the circulation, precipitation and sur-face exchange patterns over the Indian Ocean region during the January–March period using the NCAR CCM3 general circulation model (GCM). They have suggested that precip-itation increases in the near-equatorial Indian Ocean region but decreases over the global tropics from January to March, due to the presence of this aerosol-related radiative heat-ing/cooling. They did not, however, study the impact of the absorbing aerosol on the strength of the subsequent Indian summer monsoon. Menon et al. (2002) have studied the im-pact of anthropogenic aerosols over the South Asian and East Asian regions on the Indian summer monsoon. They have used, however, a time invariant aerosol radiative forcing, i.e. aerosol radiative forcing is the same during the pre-monsoon, monsoon and post-monsoon seasons. This is an unrealis-tic assumption, since there is a strong seasonal variation of anthropogenic aerosol (Satheesh and Srinivasan, 2002). Ad-ditionally, these simulations were performed with a coarse resolution GCM (the GISS GCM at 4◦×5◦horizontal reso-lution). The impact of nonabsorbing aerosols, such as the sulphate aerosols, has been studied by Boucher et al. (1998). They found that the strength of the Indian summer monsoon reduced with the inclusion of sulphate aerosols. They also found that the response to sulphate aerosol forcing was dif-ferent from that of the 1987/88 ENSO sea surface tempera-ture forcing. Meehl et al. (1996) have also studied the impact of climate change due to an increase in greenhouse gases and aerosols.
In this paper we study the impact of the soot-aerosol re-lated radiative heating in the period prior to Indian summer monsoon on the pre-monsoon and monsoon climate. We have introduced the radiative effects of soot aerosol as the heating of the lower troposphere (up to about 3 km) and cooling of the surface. The sensitivity of the model results with aerosol forcing to the cumulus parameterization used has been examined. The aerosol radiative forcing used in the present study is obtained from an aerosol model that has been developed based on measured radiative fluxes at the top of the atmosphere and at the surface over tropical Indian Ocean (Satheesh et al., 1999) during the INDOEX (INDian Ocean EXperiment).
INDOEX forcing over the ocean was estimated by inte-grating surface measurements at island locations, as well as on board ships, measurements using aircraft, and satellite data (Ramanathan et al., 2001). The aerosol forcing over land were estimated using aerosol transport models (Ramanathan et al., 2001).
2 Model description
The global atmospheric general circulation model used in this study is a version of the National Centre for Medium Range Weather Forecasting (NCMRWF), which is a modi-fied form of the research version of National Meteorologi-cal Center (NMC, now NCEP) global spectral model (Sela,
1982, 1988), with a triangular truncation at 80 waves (T-80). The model has 128 global Gaussian grids in the north-south direction (resolution ∼1.41◦) and 256 equally spaced grids in the east-west direction (resolution ∼1.41◦). It has 18 vertical sigma levels, with more closely spaced levels near the surface and at the tropopause. The simplified Arakawa-Schubert (SAS) scheme (Grell, 1993) was used for convec-tion parameterizaconvec-tion. With a view to understanding the in-teraction between model physics and aerosol radiative ef-fects, we have conducted another set of simulations both with and without aerosol forcing and using the Kuo cumu-lus parameterization scheme (Anthes, 1977). The model’s shortwave radiation scheme is based on Lacis and Hansen (1974) and the longwave radiation scheme is based on Fels and Schwarzkopf (1981). It uses a simple one layer bucket model for the surface hydrology calculation (Pan and Mahrt, 1986). The gravity wave drag parameterization is from Pier-rehumbert (1987). The model’s ability to simulate the Indian monsoon and the impact of orography has been discussed by Chakraborty et al. (2002).
3 Experimental details
Our present study uses an ensemble of seasonal simulations with the NCMRWF model. Errors in seasonal integration of a GCM can be either due to the deficiency of the model’s physics or due to errors in the initial data. Ensemble tech-nique can be used to reduce the second source of error sub-stantially (Brankovic and Palmer, 1997). NCEP reanalysis (Kalnay et al., 1996) data from 1–5 January (at 00 GMT) were used as the initial condition for the five ensemble mem-bers (both control and perturbed). Sea Surface Temperature (SST) was specified by interpolating the monthly mean val-ues for 1998 from Reynolds and Smith (1995) to the model run time. The mean orography from the NCEP re-analysis data set was used in all the simulations. The ensemble mean results are presented in this paper. Studies have shown that the simulation of the tropical rainfall is sensitive to model physics (Rajendran et al., 2002a, b). Therefore,with a view to understand the importance of model physics, such as the cumulus parameterization scheme and its interaction with aerosol forcing, two more (with and without aerosol forcing) ensemble simulations were conducted with the Kuo cumulus parameterization scheme.
Figure 1 shows the prescribed aerosol radiative forcing to the model. We have assumed a constant heating profile in the lower troposphere, from near surface to about 3 km (σ =0.735 of the model), which corresponds to the lowest 7 model sigma layers. Figure 1a shows the heating rate due to aerosol forcing in each of the lowest 7 model lay-ers. The column integrated forcing F (A) is illustrated in Fig. 1b. Reduction of surface flux due to aerosol, F (S), as prescribed in the model is shown in Fig. 1c. We have not in-troduced surface forcing over the ocean where SST was pre-scribed from Reynolds and Smith (1995) for the model year 1998. We have assumed a constant forcing from 1 January
1424 A. Chakraborty et al.: Aerosol and Indian Monsoon
Fig. 2. March–April 1998 (top) and July–August 1998 (bottom) mean precipitation from Xie-Arkin data (left) and control simulation with
SAS cumulus convection of NCMRWF model (right).
to 15 April. The forcing reduces linearly to zero by 15 May. We have incorporated a diurnally averaged aerosol radiative effect (heating/cooling) in the GCM. The time series of the area mean forcing for the grids where F (A) exceeds 3 Wm−2 and F (S) has nonzero values is shown in Fig. 1d. The ra-tio R=F (S)/F (A) was about 0.77 in this experiment. These lower troposphere and surface forcing are very similar to that used in the R∼0.9 case in Chung et al. (2002), which they believed to be the most realistic one among their three exper-iments.
The use of the lower value of R is justified on the basis of the interaction between absorbing aerosols and the lower reflecting surface. Inclusion of measured aerosol properties in the radiative transfer model have shown that the ratio of surface to atmospheric radiative forcing is ∼1.53 for Indian Ocean aerosols (Satheesh and Ramanathan, 2000). The con-tribution of black carbon mass fraction to composite aerosol mass over the Indian Ocean was ∼6% (with a single scat-tering albedo of ∼0.9). These estimates are over the ocean where surface reflectance is very low. If the same aerosol system were present over the land, the effect of soot absorp-tion would be significantly larger because the reflectance of the land is much higher and the radiation reflected from the
surface below would have interaction with the aerosol again (Satheesh, 2002). A sensitivity study in this regard (assum-ing that both soil and vegetation constitute land surface) has demonstrated that over land the presence of a similar aerosol system, such as that observed over Indian Ocean (reported in Satheesh et al., 1999), would have the ratio of surface to atmospheric radiative forcing as small as ∼0.92 (Satheesh, 2002). From extensive measurements of aerosol spectral op-tical depths, black carbon and size segregated aerosol con-centration over Indian landmass, Babu et al. (2002) have shown that black carbon contributes about 11% of the total aerosol mass. Thus, the aerosol absorption over the Indian landmass is higher vis-`a-vis over the Indian Ocean. Based on observations Babu et al. (2002) have reported values of sin-gle scattering albedo as low as ∼0.73 and a ratio of surface to atmospheric radiative forcing in the range of 0.75 to 0.82. This low value of the ratio over land is due to the combined effect of higher aerosol absorption as well as higher surface reflection. Hence, our choice of surface to atmosphere radia-tive forcing of about 0.77 is consistent with observations.
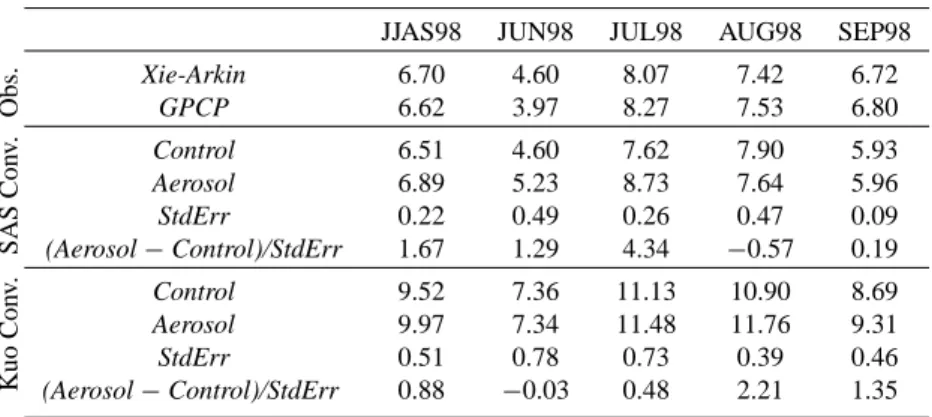
Table 1. Monthly mean precipitation (mm day−1) over the Indian region (68.2◦–90.7◦E, 8.4◦–28.0◦N, land) from observation and GCM simulations. The standard error (StdErr) is for the control ensemble.
Obs. SAS C on v. K uo Con v.
JJAS98 JUN98 JUL98 AUG98 SEP98
Xie-Arkin 6.70 4.60 8.07 7.42 6.72 GPCP 6.62 3.97 8.27 7.53 6.80 Control 6.51 4.60 7.62 7.90 5.93 Aerosol 6.89 5.23 8.73 7.64 5.96 StdErr 0.22 0.49 0.26 0.47 0.09 (Aerosol − Control)/StdErr 1.67 1.29 4.34 −0.57 0.19 Control 9.52 7.36 11.13 10.90 8.69 Aerosol 9.97 7.34 11.48 11.76 9.31 StdErr 0.51 0.78 0.73 0.39 0.46 (Aerosol − Control)/StdErr 0.88 −0.03 0.48 2.21 1.35 4 Results
Figure 2 shows the March–April (top) and July–August (bot-tom) mean precipitation from observation (Xie and Arkin, 1997) (left) and NCMRWF control simulation with SAS cu-mulus convection scheme (right). The model simulates the high precipitation belt in both the seasons realistically, except for the maxima in the northern Bay of Bengal during July– August. In Table 1 monthly and seasonal mean values of precipitation over the Indian land mass (68.2◦–90.7◦E, 8.4◦– 28.0◦N, land parts only, we shall call this region as the Indian region) is presented for the June–September period from ob-servations and NCMRWF simulations. It shows that the con-trol run of the model is able to capture the monthly mean value of precipitation over this region correctly for the SAS cumulus scheme. For the Kuo cumulus convection scheme the precipitation is higher than observed in all four months of the summer monsoon season. In Table 1 we also show the standard error for all the ensemble experiments. The standard error (StdErr) of a model parameter for the control ensemble is calculated as follows: St dErr = q P5 i=1(Xi − ¯X)2 5 , (1)
where Xi is the value of the parameter for the ith member of
the control ensemble and ¯Xis the control ensemble mean of that parameter.
The standard error of the control simulation was less than 1.0 mm day−1in all the months, with the standard error being much lower in the SAS ensemble as compared to the Kuo ensemble in most of the months (except in August).
We next study the effect of aerosol forcing, especially on the simulation of summer monsoon over the Indian region, and its sensitivity to the cumulus parameterization scheme. We first present results from the simulations with the SAS scheme followed by those with the Kuo scheme. We compare the changes due to aerosol forcing with the standard error of the control simulation and validate any significant change using a statistical test.
4.1 Simulations with the SAS scheme
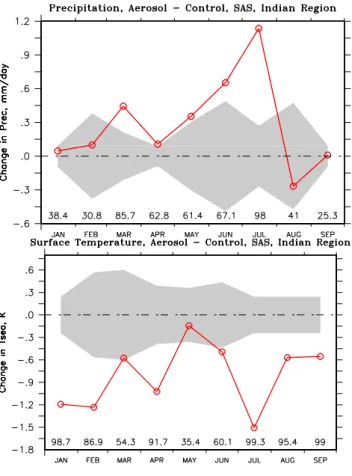
Changes in monthly mean precipitation and surface tempera-ture from January to September over the Indian region due to aerosol forcing obtained using the SAS convection scheme are shown in Fig. 3. The shaded region in both the panels indicates the standard error in the control ensemble simula-tion computed using Eq. (1). The numbers above the time axis show the confidence level (in percent) at which aerosol results differ from that of the control. The confidence level is calculated using a student’s t-test. During the pre-monsoon period the reduction in land surface temperature is maximum in February (∼−1.22 K), and it decreases to about −0.15 K in May. This decrease in land surface temperature in the monsoon period may be a combined effect of the pre-scribed surface cooling due to aerosol and enhanced precip-itation over this region. It is to be noticed that even after 15 May, when the effect of aerosol was removed completely in the experiment, the land surface temperature was lower than that of the control simulation (maximum reduction is in July by about 1.5 K with a confidence level of 99% when change in precipitation was highest). This reduction in land surface temperature during the monsoon period when the aerosol ef-fect was absent is on account of the increased precipitation (Fig. 3, top) caused by the radiative effects of aerosol in the pre-monsoon period. A detailed discussion of these changes is presented in Sect. 5. Figure 3 also shows that the change in precipitation and surface temperature over this region is sig-nificant (more than the standard error of the model control run) during most of the months. The change in precipita-tion is most significant during July at 98.0% level and the change in surface temperature is significant at 99.3% confi-dence level. The changes in surface temperature over this region in the pre-monsoon season were due to the prescribed aerosol cooling of the surface, and during the monsoon sea-son they were due to the surface hydrological feedback ef-fects caused by the increased precipitation (increased pre-cipitation causes higher soil moisture and this in turn causes higher evaporative cooling at the surface).
1426 A. Chakraborty et al.: Aerosol and Indian Monsoon
Fig. 3. Time series of change in (top) precipitation (in mm day−1) and (bottom) surface temperature (in K) over the Indian region (68.2◦–90.7◦E, 8.4◦–28.0◦N, land) for the SAS cumulus convec-tion scheme. The standard error of the control ensemble (shaded region) is also shown which indicates the error bar. The confidence level (in percent, calculated using t-test) of the difference between control and aerosol results for each month is written as numbers above the time axis.
Spatial variation of changes in precipitation, surface tem-perature and 850 hPa temtem-perature for the month of April (the pre-monsoon period) and July (the monsoon period) with the SAS convection scheme are shown in Figs. 4 and 5, respec-tively. Only regions where the differences are significant at 95% level are shaded.
Precipitation increases over the oceanic Inter Tropical Convergence Zone (ITCZ) region (equatorial Indian Ocean) in April (Fig. 4a). The increase in precipitation (by 2–4 mm day−1) over the eastern parts of India, Myanmar and the
Indo-Chinese peninsula in this month is associated with a decrease in surface temperature by 3–4 K over land which re-duces the air temperature at 850 hPa by 1–4 K. A large reduc-tion in precipitareduc-tion (∼6 mm day−1) over parts of Indonesia is also seen. We note that the region of increased precipi-tation in April due to the aerosol effect with the SAS con-vection at the equatorial Indian Ocean with maxima around 10◦N corresponds well with that of Chung et al. (2002). However, the magnitude of the increase is much larger (∼4 mm day−1as compared to about 2 mm day−1in Chung et al., 2002). We also note that the decrease in precipitation to
Fig. 4. Changes in a) precipitation (in mm day−1), b) surface tem-perature (in K) and c) air temtem-perature (in K) at 850 hPa during April using the SAS convection scheme. Only those grids are shaded where the ensemble mean difference between aerosol and control simulations is above 95% confidence level using a t-test.
the south of ITCZ in our simulation is similar in location to that of Chung et al. (2002) and again, the magnitude of the change is larger (∼2 mm day−1in comparison to about
0.5 mm day−1in Chung et al., 2002). Over continental
re-gions such as northwest India and Pakistan, the changes are different. Our simulations show an increase in precipitation over this region, while those of Chung et al. (2002) shows a decrease. This suggests that over oceans, where the SST is prescribed and heating of the lower atmosphere is the only effect of absorbing aerosols, the two models behave in a sim-ilar fashion. Over land, on the other hand, where the impact of aerosols includes cooling of the surface (and consequent surface feedbacks such as a decrease of surface temperature and changes in soil moisture) the two simulations differ sig-nificantly.
Also noticeable is the increase in the 850 hPa air tempera-ture by about 1–2 K over most of the Indian Ocean and south-ern parts of India (Fig. 4c), which is larger than the standard error of the control simulation (<0.3 K, not shown) and is significant at 95% level. This change in 850 hPa air temper-ature is due to the prescribed aerosol heating in the lower
troposphere. Over land this change in low level air temper-ature is not significant because prescribed surface cooling reduces the intensity of prescribed lower troposphere heat-ing. Comparing with the study of Chung et al. (2002) (Fig. 8 therein) we note that the increase in temperature is similar in pattern and magnitude over the lower troposphere. Cooling of the surface due to aerosols causes the surface tempera-ture to reduce and this is also consistent with the results of Chung et al. (2002). The magnitude of reduction (∼−1 K) over peninsular India is a little higher than that reported in Chung et al. (2002), where it varies from −0.3 to −1.0 K. This could be related to the fact that our simulations show an increase in precipitation over this region, while Chung et al. (2002) either shows a reduction or no change. The increase in precipitation enhances evaporation which reduces surface temperature further.
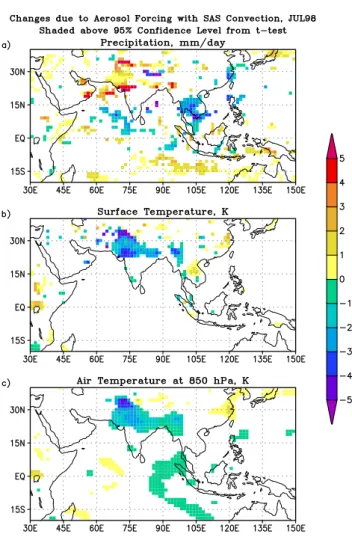
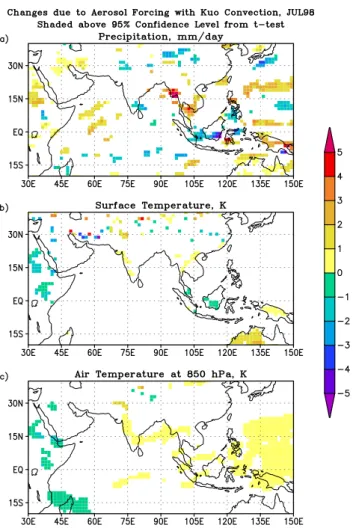
In contrast to April, the 850 hPa air temperature during July does not change significantly (< 0.5 K) over the Indian Ocean (Fig. 5c). On the other hand, there is a substantial in-crease in precipitation in the northwest part of India and over the northern Arabian Sea (Fig. 5a). The increase in precipita-tion over the Indian landmass decreases the surface temper-ature by 2–4 K, and this in turn reduces the 850 hPa air tem-perature by 1–3 K. In July we further note a large decrease in precipitation over southeast Asia and over the central and western Arabian Sea (∼3 mm day−1). In contrast, precipita-tion increases over both these regions during April (Fig. 4a). In Table 1 monthly mean values of precipitation over the Indian region for the summer monsoon months (June– September) are shown for observations and model simula-tions. Two different observational data sets have been in-cluded to illustrate the uncertainty in the data used for com-parison. While the seasonal mean precipitation of the control simulation is close to the observation, it increases when the aerosol effect is included. The impact of aerosols is more during the earlier parts of the season (i.e. in the months of June and July) and reduces as the season progress. In the next section we show that temporal and spatial variations of changes in precipitation is sensitive to modeling of cumulus parameterization.
The effect of aerosol on air temperature in different months averaged over the Indian region mass is depicted in Fig. 6. It shows a warming during the January–April period at all levels from surface to 500 hPa and is related to the pre-scribed heating due to soot aerosols in the lower troposphere. During the monsoon period, however, it shows cooling at lower levels (up to 700 hPa) and warming at higher level (at 500 hPa) over this region. The cooling of the lower layers is related to the cooling of the surface, while the heating of the midtroposphere is related to the latent heat release caused by organised cumulus convection.
We have noticed in Fig. 5a that the most significant in-crease in rainfall during the monsoon season is over Gujarat and parts of west-central India. This increase is significant at the 95% confidence level. We note that during the pre-monsoon period, there is a reduction in surface temperature on account of a reduction in the prescribed surface radiation
Fig. 5. Changes in a) precipitation (in mm day−1), b) surface tem-perature (in K) and c) air temtem-perature (in K) at 850 hPa during July using the SAS convection scheme. Only those grids are shaded where the ensemble mean difference between aerosol and control simulations is above 95% confidence level using a t-test.
flux. During the monsoon season the cooling of the surface is related to the increased precipitation and related cooling due to surface hydrological feedback effects. This shows that contrasts in land-ocean surface temperature do not play a major role in modulating the strength of the Indian summer monsoon. In other words, even though the land temperature is cooler during the pre-monsoon and monsoon periods in the perturbed experiments, the rainfall is higher in the mon-soon period. In contrast, the lower troposphere air tempera-ture over the Indian region (Fig. 6) is higher until April due to aerosol radiative heating effects and lower during June– August (as a consequence of higher surface cooling due to increased precipitation and the absence of aerosol-radiative heating). During January–April, the heating due to aerosol is within the standard error limit of the control ensemble at 925 hPa level, and is marginally higher than the standard er-ror at 850 hPa. The temperature increase, however, is more pronounced at 700 and 500 hPa levels (Fig. 6).
1428 A. Chakraborty et al.: Aerosol and Indian Monsoon
Fig. 6. Time series of change in air temperature over the Indian region (68.2◦–90.7◦E, 8.4◦–28.0◦N, land). Standard error of the control ensemble is shown as the shaded region which indicates the error bar.
4.2 Simulations with the Kuo scheme
In the previous section we studied the impact of aerosol radiative forcing using the SAS cumulus parameterization scheme. Comparison of our simulations with that of Chung et al. (2002) showed that there are significant differences be-tween their results and the results obtained by the present simulations, especially over continental regions. With a view to examine the sensitivity of these results to model physics, particularly the cumulus parameterization scheme, we have conducted another set of experiments using the Kuo cumulus scheme (Anthes, 1977).
It is noticed that the change in precipitation due to aerosol radiative effects over the Indian landmass during the mon-soon season is very sensitive to the parameterization scheme used for cumulus convection. The impact of aerosol forcing on precipitation over the Indian region (Table 1) with the Kuo simulations is about half for the SAS scheme in the JJAS sea-son (the ratio of the difference between control and aerosol to the standard error is 1.67 for SAS and 0.88 for the Kuo
simulation). We also find that with Kuo simulation the im-pact is less than the standard error in the months of June and July and more than the standard error in the months of Au-gust and September. The converse is the case with the SAS simulation.
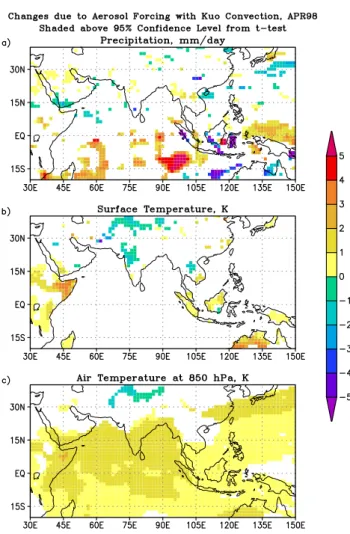
In Figs. 7 and 8 we show the differences in precipita-tion, surface temperature and 850 hPa air temperature be-tween control and aerosol simulations using the Kuo cumu-lus convection scheme for the months of April and July, re-spectively. We notice that in April i) there was a reduction in surface temperature over land; ii) an increase in rainfall over equatorial Indian Ocean; and iii) a reduction in pre-cipitation over the Indonesian region. All these were simi-lar to the results obtained with SAS scheme. The major re-gion of increased precipitation during April is the oceanic ITCZ, though the region of significant increase is less coher-ent as compared to SAS scheme. Interestingly, this result is similar to that using the SAS scheme and Chung et al. (2002). The magnitude of increase is comparable to that
in the SAS simulation (about 3–5 mm day−1) but larger than
that reported in Chung et al. (2002). However, our simula-tions over southwest Asia with the Kuo scheme (and also in the SAS simulation) are in disagreement with that of Chung et al. (2002) and we do not find any significant reduction in rainfall over this region. On the contrary, there appears to be a slight increase in rainfall using the Kuo scheme (Fig. 7). This again points to the fact that over oceans where heating of the lower troposphere is prescribed, all three simulations behave in a similar fashion. Over land where surface cools and consequent feedback effects come into play, the simula-tions differ.
The increase in precipitation over the northeastern parts of India, Myanmar and Vietnam simulated by SAS convection is restricted to a much smaller spatial scale over the northern Indo-Chinese peninsula with the Kuo simulation. We also find that the heating pattern at 850 hPa is very similar in the two simulations during April.
During July the precipitation pattern in the SAS (Fig. 4a) and Kuo (Fig. 7a) schemes are different. Over most of the In-dian region the effect of absorbing aerosols in the SAS sim-ulation is to increase rainfall. This effect is not significant over larger parts of India in the Kuo simulation. In regions of northern India the Kuo simulation indicates a moderate de-crease, while the SAS simulation shows an increase of rain-fall. The other major difference is the increase in rainfall over the Indo-Chinese peninsula in the Kuo simulation, a re-gion over which SAS indicates a large reduction in rainfall. Over the equatorial Indian Ocean, although the responses of the two schemes to aerosol forcing are similar in April, the responses are different during July. While SAS shows an increase over most of the equatorial and southern Indian Ocean, the Kuo scheme simulates an increase in precipita-tion over the western Indian Ocean and a reducprecipita-tion over the eastern Indian Ocean region.
The above results suggest that though the soot-aerosol forcing increases the rainfall and reduces surface tempera-ture over the Indian sub-continent, its magnitude of impact and the locations where the differences are significant are sensitive to model physics, such as the cumulus parameteri-zation. Thus, a region-wide assessment of the impact of soot aerosols such as presented by Chung et al. (2002), could be prone to large uncertainties related to model physics.
If we consider the change in the tropical precipitation (av-eraged between 30◦S–30◦N, 0◦–360◦, Fig. 9a), we notice that precipitation with aerosol forcing is lower than the con-trol simulation over most of the January–September period. Only during August is the averaged precipitation over the Tropics in the simulation with aerosol higher than the control simulation while using the SAS scheme. The Kuo simulation also shows that tropical mean rainfall is lower in the presence of aerosol radiative forcing. While SAS shows the highest in-crease in rainfall during August, the Kuo convection scheme shows the highest increase during July (Fig. 9b). Interest-ingly, during August the rainfall over the Tropics is lower than that of the control simulation with the Kuo scheme. The differences in tropically averaged precipitation,
how-Fig. 7. Changes in a) precipitation (in mm day−1), b) surface tem-perature (in K) and c) air temtem-perature (in K) at 850 hPa during April using the Kuo convection scheme. Only those grids are shaded where the ensemble mean difference between aerosol and control simulations is above 95% confidence level using a t-test.
ever, tends to be very small (∼0.05 mm day−1). The de-crease in precipitation averaged over the Tropics with the aerosol forcing is in agreement with the work of Chung et al. (2002). This clearly shows that while large-scale impacts (i.e. changes averaged over large spatial scales and temporal scales, such as the mean tropical precipitation) can be sim-ulated with a reasonable degree of confidence with a GCM, there are, however, large uncertainties over regional scales.
5 Changes in precipitation over ocean and land: mech-anisms
The impact of aerosol forcing during pre-monsoon (February–May) and monsoon (June–September) seasons can be understood by examining the vertical profile of tem-perature and moisture. During the pre-monsoon period the rainfall increases in the ITCZ for both the SAS and Kuo sim-ulations. During the monsoon season, the response of the two schemes is different – while the SAS scheme shows a signifi-cant increase in rainfall over the northwest Indian region, the
1430 A. Chakraborty et al.: Aerosol and Indian Monsoon
Fig. 8. Changes in a) precipitation (in mm day−1), b) surface tem-perature (in K) and c) air temtem-perature (in K) at 850 hPa during July using the Kuo convection scheme. Only those grids are shaded where the ensemble mean difference between aerosol and control simulations is above 95% confidence level using a t-test.
increase in the Kuo simulation over this region is not signifi-cant.
While SST is prescribed over oceans, surface temperature over the continental regions is calculated interactively. The effect of absorbing aerosol is to increase the radiative heat-ing of the atmosphere and to reduce the heatheat-ing of the sur-face. Therefore, over oceans (as SST is specified) only the atmospheric heating mechanism is at work. The different re-sponse of the cumulus schemes suggests that the interaction between the convection and surface processes is different in the two simulations. These differences in surface-cumulus interaction have an impact on the vertical stability of the at-mosphere.
The relationship between vertical moist static stability and convection has been discussed by Neelin and Held (1987). They showed that an increase in the moist static energy of the lower and middle troposphere leads to an increase in pre-cipitation. The moist static energy (m) of a layer in the atmo-sphere is defined as:
h = CpT + Lq + gz, (2)
Fig. 9. Difference between aerosol and control precipitation and
the standard error in control ensemble precipitation (shaded region) averaged over the Tropics (0◦–360◦, 30◦S–30◦N) using the (a) SAS and (b) Kuo convection schemes.
where T is the temperature (in K), q the specific humidity (in kg kg−1) and z the height of the atmospheric layer (in m). Cp is the specific heat at constant pressure, L latent heat of
evaporation and g acceleration due to gravity.
Zhang (1994) and Nanjundiah (2000) have shown that the changes in precipitation in GCM are associated with changes in vertical stability. Nanjundiah and Srinivasan (1999) have used the same technique to relate changes in precipitation over the Pacific Basin to changes in vertical stability of the atmosphere. In the following two sections we adopt this technique to investigate the different response produced by SAS and Kuo cumulus parameterization schemes in simu-lating precipitation, both with and without aerosol forcing. Ensemble mean precipitation increased significantly over the equatorial Indian Ocean region during April for both the SAS (Fig. 4) and Kuo (Fig. 7) schemes. On the other hand, over northwest India during July, the SAS scheme shows a sig-nificant increase in precipitation which is absent in the Kuo simulation. We examine the vertical profiles of temperature, moisture and moist static energy over these regions to explain the different response of the two schemes. We choose the 3rd member (model starting at 00 GMT of 3 January 1998) of the ensemble for analysis. This is because the difference in pre-cipitation over northwest India is largest between the control and aerosol simulations with the SAS scheme in this case.
Fig. 10. Vertical profile of change in temperature (in K) during February–March for SAS (left) and Kuo (right) convection schemes over the
Equatorial Indian Ocean region (88◦–102◦E, 13◦–8◦S, Ocean). The numbers in red at the top-left corner in the panels show the change in precipitation due to aerosol forcing over this region.
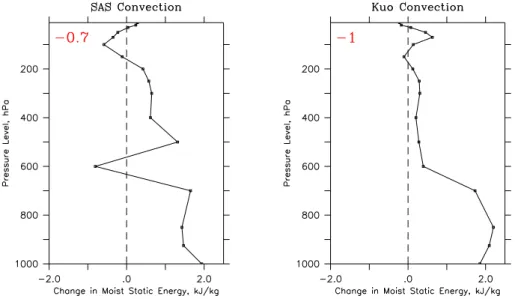
Fig. 11. Vertical profile of change in moist static energy (in kJ kg−1) during February–March for SAS (left) and Kuo (right) convection schemes over the Equatorial Indian Ocean region (88◦–102◦E, 13◦–8◦S, Ocean). The numbers in red at the top-left corner in the panels show the change in vertical moist-static stability (VMS) due to aerosol forcing over this region.
5.1 Oceanic region
In Figs. 10 and 11 we have shown the differences in ver-tical profiles of temperature and moist static energy be-tween aerosol and control runs using SAS and Kuo convec-tion schemes over the equatorial Indian Ocean region (88◦– 102◦E, 13◦–8◦S). In the Oceanic region, the SST is pre-scribed and the only effect of aerosols is to heat the lower troposphere. This heating increases the temperature. The higher temperature in the lower troposphere reduces the pres-sure and leads to convergence of moisture. The increased moisture leads to an increase in moist static energy of the lower and middle troposphere. This increase in moist static energy results in the reduction of vertical static stability as
shown by Neelin and Held (1987), leading to an increase in precipitation. This can be clearly seen in the ITCZ region, as shown in Figs. 10 and 11. In Fig. 10 the number in red at the top-left corner indicates the change in precipitation (in mm day−1) over this region during the specified period, and in Fig. 11 the number shows the change in vertical moist static stability (VMS) which is defined as
V MS = ht op−hbot, (3) where ht op = 1 Pmid−Pt op Z Pmid Pt op h dp
1432 A. Chakraborty et al.: Aerosol and Indian Monsoon hbot = 1 Pbot−Pmid Z Pbot Pmid h dp
Here, h is the moist-static energy of the atmosphere Eq. (2). In our study Pbot, Pmidand Pt opare taken as 1000, 350 and
100 hPa, respectively. VMS decreases by 0.7 kJ kg−1for the SAS convection and by 1.0 kJ kg−1for the Kuo convection. The aerosol radiative heating leads to a build-up of moisture in the lower troposphere (and thus a reduction of VMS) dur-ing the months of February and March which results in a sig-nificant increase in precipitation during the month of April. It is interesting to note that the changes in temperature and moist static energy over this region are similar for both the SAS and Kuo convection schemes.
5.2 Continental region
The effect of cooling the surface and heating the lower and middle troposphere due to aerosols and the consequent feed-back effects cause the changes in precipitation to be different in the two cumulus convection schemes. The region we have examined is the northwestern part of India (70◦–80◦E, 20◦– 25◦N, land parts). Over this region, the SAS scheme simu-lation shows a significant increase in precipitation, while the increase in precipitation with the Kuo simulation is not sig-nificant.
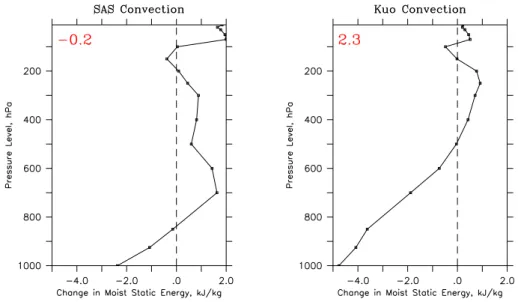
In Figs. 12 and 13 we have shown the differences in vertical profiles of temperature and moist static energy be-tween aerosol and control runs for SAS and Kuo convec-tion schemes over northwest India, averaged over the pre-monsoon period (February–May). The numbers in red in the top-left corner of Fig. 12 show the difference in precipitation between the aerosol and control runs, and in Fig. 13 the num-bers show the difference in VMS during the specified period. Comparing the averages for the pre-monsoon period (February to May) we find that near-surface temperature is higher in the presence of aerosol in the SAS simulation but lower than the control in the Kuo simulation. Both Kuo and SAS show a decrease in rainfall during this period, but the decrease is much larger (about 0.4 mm day−1) in the SAS simulation than in the Kuo simulation (about 0.1 mm day−1). The higher rainfall in the control simulation reduces the sur-face temperature and thus annuls the sursur-face cooling due to absorbing aerosols in the SAS simulations. The aerosols heat the mid-troposphere in both cases. Due to the reduced rain-fall of the SAS aerosol simulation as compared to its control (during the pre-monsoon period, February to May), the air column is warmer from the surface up to the mid-troposphere in the SAS aerosol simulation. The VMS of the aerosol simu-lation is 0.2 kJ kg−1lower than the VMS of the control in the SAS case. On the other hand, surface cooling due to aerosol forcing in the Kuo case makes the atmosphere more stable in the aerosol simulation as compared to its control run (VMS is 2.3 kJ kg−1more in aerosol case). Hence, at the beginning of the monsoon season, a more unstable lower troposphere in the SAS simulation leads to higher rainfall during the mon-soon season as compared to the Kuo simulation.
This difference over northwest India could be related to the ability of cumulus schemes to respond to changes in ver-tical stability. Schemes like SAS use verver-tical moist stability as the primary criteria to model cumulus convection, while schemes such as the Kuo rely more on the occurrence of large-scale low level convergence to trigger cumulus convec-tion. Thus, the destabilization of the lower troposphere has a larger influence on the SAS simulation than on the Kuo simulation.
6 Conclusions
The impact of absorbing soot aerosols has been examined us-ing the NCMRWF GCM. We find that the lower tropospheric temperature over the Indian region shows the largest increase during the months of February and March. The continental surface temperature is lower with aerosol forcing in the pre-monsoon and pre-monsoon seasons. We find that the rainfall over the Indian region increases during the Northern Hemisphere summer and over the oceanic ITCZ in April. The reduction in surface temperature during the pre-monsoon period is due to the reduction of solar flux at the surface on account of the presence of aerosol. However, the reduction in surface tem-perature during the monsoon period (June–August) is related to higher precipitation and consequent higher surface evap-oration. A more vertically unstable atmosphere in the pre-monsoon season causes the precipitation to be higher in the monsoon season. The impact of soot aerosol and the regions of significant impact, however, are sensitive to parameteriza-tion of model physics, such as the cumulus scheme, e.g.:
1. The impact of aerosol forcing on the Indian summer monsoon rainfall with the Kuo scheme is about one-third of that simulated by the SAS scheme during July (0.35 and 1.11 mm day−1, respectively).
2. While simulations with the SAS scheme show that the impact of soot aerosol forcing is significant during the early part of the Indian monsoon season, the converse is true for the Kuo simulation.
3. In the SAS scheme the maximum impact is noticed over the northwest Indian region, while with the Kuo scheme the maximum impact shifts to peninsula and eastern In-dia and there is a reduction in rainfall over the northwest Indian region.
4. Over the Indonesian archipelago, the regions of impact are found to be different in the two simulations. The precipitation averaged over the entire Tropics in the simulation with aerosol is a little lower than that of the con-trol simulation, except during the month of June and August in the SAS simulation and except during July and September in the Kuo simulation.
During April both simulations show a strengthening of near-equatorial oceanic ITCZ (in agreement with Chung et al., 2002). Since over oceans the SST is prescribed, there
Fig. 12. Vertical profile of change in temperature (in K) during February–May for SAS (left) and Kuo (right) convection schemes over
northwest India (70◦–80◦E, 20◦–25◦N, Land). The numbers in red at the top-left corner in the panels show the change in precipitation due to aerosol forcing over this region.
Fig. 13. Vertical profile of change in moist static energy (in kJ kg−1) for SAS (left) and Kuo (right) convection schemes over north-west India (70◦–80◦E, 20◦–25◦N, Land). The numbers in red at the top-left corner in the panels show the change in vertical moist-static stability (VMS) due to aerosol forcing over this region.
is no modulation of surface temperature by aerosol, and the destabilization due to lower tropospheric heating causes an increase in rainfall over the oceanic ITCZ region during the pre-monsoon period in both the schemes.
At this juncture it appears that while the impact of aerosols over the entire Tropics can be predicted with some con-fidence, their impact on regional scales over continents is sensitive to the prescription of model physics (e.g. cumu-lus scheme). The soot aerosol heats the lower troposphere and cools the surface. Hence, the presence of soot aerosols is expected to lower the temperature near the ground and, therefore, make the boundary layer more stable. However, lower troposphere is heated by soot aerosols, while the upper troposphere is largely unaffected. This leads to greater
ver-tical instability in the troposphere above the boundary layer. Cumulus schemes respond differently to the change in sta-bility above the boundary layer. Schemes like SAS which rely on the existence of vertical instability to simulate cumu-lus convection appears to be more sensitive to the changes in vertical moist-static stability than schemes like Kuo which are more dependent on the presence of large-scale low-level moisture convergence. This sensitivity appears to be more over continental regions, such as northwest India.
In conclusion, it appears that while large-scale impacts due to aerosols (such as over the entire Tropics) can be pre-dicted with a reasonable degree of confidence, assessment on smaller regional scales will need to wait for further improve-ments in modeling techniques.
1434 A. Chakraborty et al.: Aerosol and Indian Monsoon
Acknowledgements. Topical Editor O. Boucher thanks a referee for
his help in evaluating this paper. This work was partially supported by DST under grant ES/48/004/97.
References
Anthes, R. A.: A cumulus parameterization scheme utilizing a one-dimensional cloud model, Mon. Weather Rev., 105, 270–286, 1977.
Babu, S., Satheesh, S. K., and Moorthy, K. K.: Enhanced aerosol ra-diative forcing due to aerosol black carbon at an urban site in In-dia, Geophys. Res. Lett., 29, doi:10.1029/2002GL015 826, 2002. Boucher, O., Pham, M., and Sadourny, R.: General circulation model simulations of Indian summer monsoon with increase lev-els of sulphate aerosols, Ann. Geophys., 16, 345–352, 1998. Brankovic, C. and Palmer, T. N.: Atmospheric seasonal
predictabil-ity and estimates of ensemble size, Mon. Weather Rev., 125, 859–874, 1997.
Chakraborty, A., Nanjundiah, R. S., and Srinivasan, J.: Role of Asian and African orography in Indian summer monsoon, Geo-phys. Res. Lett., 29, doi:10.1029/2002GL015 522, 2002. Chung, C. E., Ramanathan, V., and Kiehl, J. T.: Effects of the South
Asian absorbing haze on the Northeast monsoon and surface-air heat exchange, J. Climate, 15, 2462–2476, 2002.
Fels, S. B. and Schwarzkopf, D.: An efficient, accurate algorithm for calculating CO215 µm band cooling rates, J. Geophys. Res., 86 (C2), 1205–1232, 1981.
Grell, G. A.: Prognostic evaluation of assumptions used by cumulus parameterization, Mon. Weather Rev., 121, 764–787, 1993. Kalnay, E., Kanamitsu, M., Kistler, R., Collins, W., Deaven, D.,
Gandin, L., Iredell, M., Saha, S., White, G., Woollen, J., Zhu, Y., Chelliah, M., Ebisuzaki, W., Higgins, W., Janowiak, J., Mo, K. C., Ropelewski, C., Wang, J., Leetmaa, A., Reynolds, R., Jenne, R., and Joseph, D.: The NCEP/NCAR 40-year reanaly-sis project, Bull. Amer. Meteorol. Soc., 77, 764–787, 1996. Lacis, A. A. and Hansen, J. K.: A parameterization for the
absorp-tion of solar radiaabsorp-tion in the Earth’s atmosphere, J. Atmos. Sci., 32, 118–133, 1974.
Meehl, G. A., Washington III, W. M., Breigleb, D. J. E., and Jau-mann, P. J.: Climate change from increased CO2and the direct and indirect effect of sulfate aerosols, Geophys. Res. Lett., 23, 3755–3758, 1996.
Menon, S., Hansen, J., Nazarenko, L., and Luo, Y.: Climate effects of black carbon aerosols in China and India, Science, 297, 2250– 2253, 2002.
Nanjundiah, R. S.: Impact of moisture transport on the simulated tropical rainfall in a general circulation model, Clim. Dynam., 16, 303–317, 2000.
Nanjundiah, R. S. and Srinivasan, J.: Anomalies of precipitable water-vapor and vertical stability during El Ni˜no, Geophys. Res. Lett., 26, 95–98, 1999.
Neelin, J. D. and Held, I. M.: Modeling tropical convergence based on the moist static energy budget, Mon. Weather Rev., 115, 3–12, 1987.
Pan, H. L. and Mahrt, L.: Interaction between soil hydrology and boundary layer development, Bound.-Lay. Meteorol., 38, 185– 202, 1986.
Pierrehumbert, R. T.: An eassay on the parameterization of oro-graphic gravity wave drag, GFDL/NOAA, Princeton University, Princeton, NJ 08542, 1987.
Rajendran, K. R., Nanjundiah, R. S., and Srinivasan, J.: The impact of surface hydrology on the simulation of tropical intraseasonal oscillation in NCAR (CCM2) atmospheric GCM, J. Meteorol. Soc. Japan, 80, 1357–1381, 2002a.
Rajendran, K. R., Nanjundiah, R. S., and Srinivasan, J.: Compari-son of seaCompari-sonal and intraseaCompari-sonal variation of tropical climate in NCAR CCM2 GCM with two different cumulus schemes, Mete-orol. Atmos. Phys., 79, 3921–3926, 2002b.
Ramanathan, V., Crutzen, P. J., Lelieveld, J., Althausen, D., An-derson, J., Andreae, M. O., Cantrell, W., Cass, G., Chung, C. E., Clarke, A. D., Collins, W. D., Coakley, J. A., Dulac, F., Heintzen-berg, J., Heymsfield, A. J., Holben, B., Hudson, J., Jayaraman, A., Kiehl, J. T., Krishnamurti, T. N., Lubin, D., Mitra, A. P., Mc-Farquhar, G., Novakov, T., Ogren, J. A., Podgorny, I. A., Prather, K., Prospero, J. M., Priestley, K., Quinn, P. K., Rajeev, K., Rasch, P. J., Rupert, S., Sadourney, R., Satheesh, S. K., Sheridan, P., Shaw, G. E., and Valero, F. P. J.: INDOEX aerosol forcing and climate impacts: An integrated assessment, J. Geophys. Res., 106, 28 371–28 398, 2001.
Reynolds, R. W. and Smith, T. M.: A high-resolution global sea sur-face temperature climatology., J. Climate, 8, 1571–1583, 1995. Satheesh, S. K.: Aerosol radiative forcing by Indian Ocean aerosols:
Effect of cloud and surface reflection, Ann. Geophys., 20, 2105– 2109, 2002.
Satheesh, S. K. and Ramanathan, V.: Large difference in tropical aerosol forcing at the top of the atmosphere and Earth’s surface, Nature, 405, 60–63, 2000.
Satheesh, S. K. and Srinivasan, J.: Enhanced aerosol loading over Arabian Sea during pre-monsoon season: Natural or anthro-pogenic?, Geophys. Res. Lett., 29, doi:10.1029/2002GL015 687, 2002.
Satheesh, S. K., Ramanathan, V., Jones, X. L., Lobert, J. M., Pod-gorny, I. A., Prospero, J. M., Holben, B. N., and Loeb, N. G.: A model for natural and anthropogenic aerosols over the tropical Indian ocean derived from INDOEX data, J. Geophys. Res., 104, D22, 27 421–27 440, 1999.
Sela, J. G.: The NMC spectral model, NOAA Tech. Rep., NWS-30, 36 pp., 1982.
Sela, J. G.: The new NMC operational spectral model, Eighth con-ference on numerical weather prediction, February 22-26, Balti-more, Maryland, 1988.
Xie, P. and Arkin, P. A.: A 17-year monthly analysis based on gauge observations, satellite estimates and numerical model outputs, Bull. Amer. Meteorol. Soc., 78, 2539–2558, 1997.
Zhang, G. J.: Effects of cumulus convection on the simulated mon-soon circulation in a general circulation model, Mon. Weather Rev., 122, 2022–2038, 1994.