Do Strikes Kill? Evidence from New York State
The MIT Faculty has made this article openly available. Please share
how this access benefits you. Your story matters.
Citation
Gruber, Jonathan, and Samuel A. Kleiner. 2012. "Do Strikes Kill?
Evidence from New York State." American Economic Journal:
Economic Policy, 4(1): 127–57. DOI:10.1257/pol.4.1.127 © 2012 AEA
As Published
http://dx.doi.org/10.1257/pol.4.1.127
Publisher
American Economic Association
Version
Final published version
Citable link
http://hdl.handle.net/1721.1/71824
Terms of Use
Article is made available in accordance with the publisher's
policy and may be subject to US copyright law. Please refer to the
publisher's site for terms of use.
127
Do Strikes Kill? Evidence from New York State
†By Jonathan Gruber and Samuel A. Kleiner*
Hospitals now represent one of the largest union sectors of the US economy, and there is particular concern about the impact of strikes on patient welfare. We analyze the effects of nurses’ strikes in hospi-tals on patient outcomes in New York State. Controlling for hospital specific heterogeneity, the results show that nurses’ strikes increase in-hospital mortality by 18.3 percent and 30-day readmission by 5.7 percent for patients admitted during a strike, with little change in patient demographics, disease severity or treatment intensity. The results suggest that hospitals functioning during nurses’ strikes do so
at a lower quality of patient care. (JEL H75, I11, I12, J52)
H
ospitals are one of the most important employers in the United States. Thirty-five percent of US health care workers, and 3.61 percent of all US workers, work in hospitals.1 Due to the importance of hospitals in providing health care toour nation, and fears that work stoppages could place patient health in jeopardy, hos-pitals were excluded from collective bargaining laws for almost three decades after other sectors were allowed to unionize. Once allowed to do so in 1974, however, hospitals quickly became one of the most important sources of union jobs in the United States. Over fifteen percent of hospital employees are members of a union,2
representing six percent of all union employees in the United States. While union-ization has been declining in its traditional industrial home, it is growing rapidly in the hospital sector, with the number of unionized hospital workers rising from 679,000 in 1990 to nearly 1 million in 2008.3 Despite the rapid unionization of the
hospital sector, we know little about the original government concern that led to the long delay in permitting unionization: do strikes jeopardize patient health?
2 This figure represents the number of hospital employees that are union members. The percentage of hospital
employees covered by a collective bargaining agreement is 17 percent (Source: Unionstats.com).
3 Source: Unionstats.com.
* Gruber: Department of Economics, Massachusetts Institute of Technology, 50 Memorial Drive Building E52,
Room 355 Cambridge, MA 02142-1347, and National Bureau of Economic Research (NBER) (e-mail: gruberj@
mit.edu); Kleiner: Department of Policy Analysis and Management, Cornell University, 108 Martha Van Rensselaer
Hall, Ithaca, NY 14853, and National Bureau of Economic Research (NBER) (e-mail: [email protected]). We
are grateful to David Chan for research assistance, to the New York Statewide Planning and Research Cooperative System, Barbara Schwartz and Robert Schwartz for data and details, Leo Lichtig and Laura L. Grassmann for the nursing intensity weights, and to John Cawley, Martin Gaynor, Lowell Taylor, two anonymous referees, the League of Voluntary Hospitals and Homes, and seminar participants at the 2009 NBER Summer Institute, the Congressional Budget Office, Cornell University, the University of Florida, Indiana University, the University of Kentucky, the University of Michigan, the Upjohn Institute, and Virginia Commonwealth University for helpful comments. Kleiner thanks the Labor and Employment Relations Association for financial support. The usual caveat applies.
† To comment on this article in the online discussion forum, or to view additional materials, visit the article page
at http://dx.doi.org/10.1257/pol.4.1.127.
1 http://www.bls.gov/oco/cg/cgs035.htm (accessed February 20, 2011), ftp://ftp.bls.gov/pub/suppl/empsit.
ceseeb1.txt (accessed February 20, 2011).
Contents
Do Strikes Kill? Evidence from New York State† 127
I. Background 129
A. Hospital Unionization 129
B. Strikes and Firm Performance 130
C. Strikes and Outcomes in the Health Care Sector 131
II. Data 132
A. Strike Data 132
B. Hospital Discharge Data 135
III. Empirical Strategy 140
IV. Patient Outcome Results 141
A. Timing and Pre-existing Trends 141
B. Selection Bias Concerns 144
Figure 2. Pre-Strike and Post-Strike Readmission Trends 145
V. Utilization Outcomes 149
VI. Heterogeneity in Strike Effects 150
A. Heterogeneity by Admission Urgency 151
B. Differences in Nursing Intensity 152
C. Replacement Worker Strikes 154
VII. Conclusions 155
In this paper, we carefully examine the effects of nurses’ strikes at hospitals on patient care and health outcomes. Nurses are a crucial part of the hospital produc-tion funcproduc-tion and are, as one hospital CEO said, “the heart and soul of the hospital.”4
They serve as the surveillance system of hospitals for detection and intervention when patients deteriorate, and are viewed by many patients as more important to their total recuperation process than their own attending physicians (Kruger and Metzger 2002). Thus, one might presume that strikes by nurses would be harm-ful to patients’ health. Yet, at the same time, a large literature in health economics documents substantial overtreatment in hospitals in the United States; for example, Fisher et al. (2004) find no association between increased treatment intensity across medical centers and improved long-term survival. From this, one might infer that reduced treatment intensity due to nursing strikes might be innocuous. Thus, ex-ante, the impact of nursing strikes on outcomes is ambiguous.
To address this question, we turn to one of the US states with the most hospital strikes in recent decades, New York State. A key advantage of this state for our analysis is that information on strikes can be matched to hospital discharge records which provide information on both treatment intensity and two key measures of outcomes: patient mortality and hospital readmission. We have gathered data on every hospital strike over the 1984 to 2004 period in New York State. We carefully match each striking hospital over this period with a set of control hospitals in their area, and use an event-study approach to examine the evolution of outcomes before, during, and after a strike in the striking versus control hospitals.
Our results are striking: there is a meaningful increase in both in-hospital mortal-ity and hospital readmission among patients admitted during a hospital strike. Our central estimates suggest that the rate of in-hospital mortality is 18.3 percent higher, and rates of hospital readmission are 5.7 percent higher, among those admitted dur-ing a strike than among patients in nearby hospitals at the same time. We show that this deterioration in outcomes occurs only for those patients admitted during a strike, and not for those admitted to the same hospitals before or after a strike. And we find that these changes in outcomes are not associated with any meaningful change in the composition of, or the treatment intensity for, patients admitted during a strike.
We also find evidence of a more severe impact of these strikes on patients whose conditions require more intensive nursing inputs, and that outcomes are no better for patients admitted to striking hospitals who employ replacement workers. Overall, our findings suggest that strikes lead to lower quality medical care in hospitals.
Our paper proceeds as follows. Section I provides background on hospital union-ization and on the literature on strikes and firm outcomes. Section II discusses our data on both strikes and patient outcomes. Section III discusses our empirical strat-egy and issues. Section IV presents the results on mortality and readmission, while Section V presents results on utilization measures. Section VI examines the hetero-geneity in these strike effects, and Section VII concludes.
I. Background A. Hospital Unionization
Organized labor in the hospital industry is a relatively recent phenomenon when compared with the industrial sector. While initially covered under the pro-union Wagner Act of 1935, collective bargaining in hospitals was limited due to the pas-sage of the National Labor Relations Act (NLRA) of 1947. This act, which outlined unfair labor practices on the part of unions, also excluded both government and nonprofit hospitals from the right to unionize.
This restriction was based on the Congress’s belief that unionization could inter-fere with the delivery of essential health and charitable services.5 One of the main
arguments justifying the exclusion of nonprofit hospitals was the contention that allowing nonprofit hospital coverage would “open the way for strikes, picketing, and violence which could impede the delivery of health care” (Zacur 1983, 10). Hospital administrators argued for the importance of maintaining this exclusion, emphasizing that hospitals “absolutely cannot afford any interruptions in service caused by work stoppages. Healthcare facilities are not like assembly lines” (Fink and Greenberg 1989, 167).
After lobbying efforts by hospital-employee organizations, in 1974 President Nixon signed Public Law 93-360, reversing the 27-year exclusion. This law sub-jected all nongovernmental health care facilities to federal labor law, as governed by the NLRA. While this law allowed for union organization of health care facilities, the perceived vulnerability of health care institutions to strikes prompted Congress to add amendments to this legislation applying exclusively to nongovernmental health care institutions. Twomey (1977) notes that these amendments included lon-ger government notification periods than would be required of a nonhealth care facility to the Federal Mediation and Conciliation Service (FMCS) in the event of a contract renewal (90 days versus the usual 60 days), or strike (10-day notice period versus no notice).
Huszczo and Fried (1988) show that the percentage of hospitals with collective bargaining agreements increased from 3 percent in 1961 to 23 percent in 1976, and conjecture that PL 93-360 played a significant role in this increase. Furthermore, in recent years, the health care sector has been the most active sector of the economy for new organizing.6 Table 1 shows strike activity by industry for the years 1984–
2004 as reported by the FMCS. The health care industry has experienced significant strike activity since 1984 with a greater number of strikes than all industries aside from manufacturing, construction and retail.7
5 While this restricted the rights of most employees in the sector from unionizing, eight states passed
legisla-tion during this period that granted collective bargaining rights to not-for-profit hospitals. The eight states were Connecticut, Massachusetts, Michigan, Minnesota, Montana, New York, Oregon, and Pennsylvania.
6 See NLRB, Sixty-Eighth Annual Report of the National Labor Relations Board (2004) for the fiscal year
ended September 30, 2003, table 16.
7 The FMCS data do not differentiate between types of health care facilities, such as hospitals and nursing
B. Strikes and firm Performance
A substantial economics and industrial relations literature exists analyzing the occurrence, timing, size, duration, and economic impact of strikes. Kaufman (1992) provides an excellent survey of this literature and categorizes these studies into three main areas: theoretical studies identifying the root causes of strikes, empirical stud-ies analyzing variation in strike activity, and empirical studstud-ies measuring the impact of strikes on firms and industry.
Our study is most closely related to the literature on the effects of strikes on firm and industry performance. This is a growing literature which focuses mostly on the effects of strikes in manufacturing industries. The outcomes of interest include mea-sures such as firm output, profitability, and capital market reaction to strikes. Multi-industry studies such as Neumann (1980), Neumann and Reder (1984), Becker and Olson (1986), and Kramer and Vasconcellos (1996) find that strikes lead to a 2–4 percent decline in firm market value. McHugh (1991) examines the productivity of struck firms in nine manufacturing industries and finds a negative direct impact of strikes on average labor productivity. Similar findings are echoed in studies of specific industries such as the airline industry, where De Fusco and Fuess (1991) find stock market returns of negative 2.6–5.3 percent during strikes, and Kleiner, Leonard, and Pilarski (2002) find that productivity fell greatly at commercial air-craft manufacturing plants during strikes. These effects did not persist in the long-run, however, with their plant returning to pre-strike levels of productivity within one to four months. Schmidt and Berri’s (2004) study of professional sports strikes indicates that strike costs are significant during the strike period, but are limited to the strike period, with almost immediate return to pre-strike levels of consumer demand for sporting events.
Two recent studies have examined the effect of strikes and labor relations on the quality of production. Krueger and Mas (2004) examined a long strike which involved the hiring of replacement workers at a tire plant between 1994 and 1996.
Table 1—Work Stoppages by Industry, 1984–2004
Industry Number of strikes
Manufacturing 6,575
Retail, wholesale, and service 1,973
Construction 928 Health care 730 Transportation 574 Local government 421 Food manufacturing/processing 362 Mining 144
Electricity & natural gas 120
Communications 112
Maritime 69
Petro chemicals 60
Food retail sales/distribution 46
State government 13
Federal government (postal service) 6
Other 119
They found that tires produced during these years were more likely to be defective, with particularly pronounced increases in defective units coinciding with periods when replacement workers worked together with returning strikers. Mas (2008) found that workmanship for construction equipment produced at factories that expe-rienced contract disputes was significantly worse relative to equipment produced at factories without labor unrest, as measured by the resale value of the equipment. His estimates indicate that equipment produced in facilities undergoing labor disputes were discounted in the resale market by approximately five percent.
C. Strikes and outcomes in the Health Care Sector
The effects of labor unrest in the health care industry may be particularly pro-nounced, given its labor-intensive production process, and the potentially serious consequences of substandard health care production. Health care production is par-ticularly labor intensive, with labor’s share of production accounting for nearly 60 percent of hospital costs. 8 Nurses in particular constitute the largest group of
work-ers in a hospital, and often have a considerable impact on a hospital patient’s experi-ence. Hospital administrators acknowledge that “nurses are the safety net. They are the folks that are right there, real time, catching medication errors, catching patient falls, recognizing when a patient needs something [and] avoiding failure to rescue.” 9
Consequently, work stoppages involving nursing personnel have the potential to significantly disrupt hospital operations, with potentially serious consequences for patients. Furthermore, the complex nature of health care delivery necessitates the close coordination of workers who exhibit a great degree of interdependence (Cebul et al. 2008) and whose tenure in a hospital unit can affect patient outcomes (Bartel et al. 2009). Healthcare institutions may thus be particularly susceptible to labor unrest that disrupts these complex processes.
A change in the intensity and quality of nursing inputs brought about due to strikes also has the potential to adversely affect patient outcomes. A number of stud-ies have suggested that a decrease in the nurse-to-patient ratio is associated with increases in mortality and other adverse inpatient events (e.g., Aiken et al. 2002; Needleman et al. 2002), though recent work by Cook et al. (2010) suggests that legally mandated increases in nurse staffing at California hospitals had no discern-able effect on patient safety. Moreover, even if staffing ratios are maintained dur-ing a strike through the use of replacement workers, the quality and familiarity of these replacement workers with hospital processes may affect the care delivered to patients during strikes. For example, the results in Aiken et al. (2003) suggest that higher quality workers (as measured by education level) are associated with lower mortality rates, while Phibbs et al. (2009) document increases in length of stay for hospitals employing temporary contract workers.
8 American Hospital Association Trendwatch Report 2009. Available at: http://www.aha.org/research/reports/
tw/chartbook/2009/chapter6.pdf (accessed March 9, 2010).
9 Draper et al. (2008, 3). Failure to rescue is a situation where caregivers fail to notice or respond when a patient
At the same time, a large body of research suggests that patients may be over-treated in the hospital. As a result, the reductions in care that result from strikes may not be particularly harmful on the margin. Fisher et al. (2003a, 2003b) show that in regions with high rates of inpatient care utilization, quality of care, functional status and patient satisfaction are no better than in low utilization regions. Baicker and Chandra (2004) control for within-state variation and find that states with higher Medicare spending per beneficiary have lower-quality care. Fisher et al. (2004) extend this analysis to academic hospitals and find no association between increased treatment intensity across medical centers and improved long-term survival for three of their measured outcomes, while finding a small increase in the risk of death as intensity increased for two other conditions analyzed.
Despite the increased role of organized labor in the health care industry, few stud-ies have examined the role of labor unrest on health care production, and the results of these studies offer no clear conclusions as to the effect of these strikes on patients. Early work on health care strikes by James (1979) and Pantell and Irwin (1979) examines the effects of physician strikes on patient care. James (1979) investigates the impact of a physician work slowdown tied to increased malpractice rates in Los Angeles. He finds that causes of death shifted over the course of the slowdown, with decreases in deaths from elective surgery and increases in deaths associated with emergency room transfers. On the other hand, Pantell and Irwin (1979) find no significant effects on appendectomy outcomes during a one-month anesthesiologist strike in San Francisco.
In the only study of the impact of a nurses strike on patient care, Mustard et al. (1995) report a 15 percent decrease in the caesarian birth rate, as well as an increase in the rate of adverse newborn outcomes during a month-long Ontario nurses strike. They conjecture that the result “is most plausibly attributed to disruption in the nor-mal standards of care rather than to the change in the rate of operative management” (Mustard et al. 1995, 636). Finally, Salazar et al. (2001) examine the effect of an emergency room residents strike at a Spanish hospital during which staff physicians filled in for the striking residents. They find decreases in the number of tests ordered, as well as a decrease in patient length of stay compared with the same hospital during a nonstriking period, with no significant changes in mortality or readmission rates.
II. Data A. Strike data
As a condition of the passage of PL 93-360, health care unions are required to sub-mit written notice specifying the exact date and time of striking or picketing activity to both the potentially struck health care institution and the Federal Mediation and Conciliation Service (FMCS) 10 days prior to any work stoppage. The FMCS issues a monthly report showing work stoppages for all industries, and maintains an elec-tronic database of these work stoppages for all industries dating back to 1984. This database contains information on the employer struck, employer location and indus-try, the union involved, the beginning and end dates of strikes, as well as the size of the bargaining unit struck. In some cases, the names of the types of workers that
struck (e.g., clerical workers, technicians, etc.) are also included. Our strike data were obtained from the FMCS via a Freedom of Information Request in January 2008, and contain all work stoppages in the health care industry from 1984–2004.10
The FMCS data show strike activity in the health care industry is concentrated in relatively few states, with four states accounting for nearly 60 percent of health care strikes. Because our strike data cover a period during which health care workers were allowed to organize (and thus the observed strikes are likely not due to union recognition), variation in state union concentration can likely explain a large por-tion of this variapor-tion. For analysis and discussion of the reasons for state variapor-tion in health care unionization rates see Freeman (1998) and Holmes (2006). Our analysis focuses on hospitals in New York State, which accounted for one in every six health care facility strikes in the United States during our sample period.
The focus of our study is hospitals providing inpatient care. The FMCS data does not distinguish hospitals from other health care facilities, nor does it report the names of the facilities struck in a uniform manner (i.e., a struck facility may be referred to as “Catholic Health Care” rather than St. John’s Hospital). Hospitals were thus identified manually in the data using both hospital name and facility address, and were checked using the New York State Hospital profile web site.11
Hospitals employ a diverse group of workers, ranging from those who provide little or no patient care (e.g., laundry workers and parking attendants) to those with whom the primary responsibility for the patient rests (e.g., physicians and nurses). Because we wish to focus on nurses strikes, we are particularly interested in identifying the group(s) of workers that struck at each hospital. Using only the data provided by the FMCS, we were able to identify the struck bargaining unit in 38 percent of the strikes using either the union name (e.g., New York State Nurses Association) or the name of the title of the union representative (e.g., Nursing Representative, RN Representative). For cases in which the bargaining unit was not clearly specified in the data (such as strikes with missing bargaining unit data or involving unions with diverse groups of workers), the construction of our dataset required searching news archives for articles detailing the bargaining unit involved in each strike. In the cases where we could not obtain this information from news archives, hospital administrators, as well as the listed union, were contacted for their input. If bargaining unit information could not be obtained, these hospitals were dropped from our sample.12
Our final sample covers 50 strikes at 43 hospital facilities during the years 1983– 2004. Using this sample, the strike data were manually matched by hospital name and address to physical facility identifiers in the New York State hospital discharge data (see below), as were data on the exact dates of the hospital work stoppages. For
10 Our 1983 strikes were found using a Lexis-Nexis search for hospital strikes in New York State for the year
1983. This search revealed five additional strikes that we incorporate into our analysis. We note that although our empirical specification contains outcome data for 6-months prior to the striking period, because 4 of the 1983 strikes begin in either April or May of 1983, our results contain only 4 or 5 pre-strike months for these strikes.
11 See http://hospitals.nyhealth.gov/.
strikes which name a hospital with multiple campuses, all campuses under common ownership are classified as struck.13
The genesis of these strikes is varied; based on our newspaper research, most were over wages, while some were over nurse staffing ratios. For example, on July 1, 1999, Central Suffolk Hospital, a 153-bed facility in Riverhead Long Island, was struck by 253 registered nurses, technicians and other staff who were members of the New York State Nurses Association. The striking employees had been working without a contract for six months and were demanding a contract providing three percent raises for each year of the contract, retroactivity to the end of their previous contract, better staffing, and job security guarantees. Hospital management, claim-ing large losses from cuts in Medicare reimbursement, countered with two percent raises per year and refused to grant the union retroactive pay raises for the six-month period without a contract.
The strike lasted 17 days, during which the hospital hired replacement workers to fill in for the striking nurses. Hospital administrators claimed that all services functioned normally, with no disruption in care. Union members, on the other hand, claimed to have heard from Health Department inspectors that six medication errors were made, four of the replacement workers were sent home for incompetence, and that narcotics were missing in one department. The strike was ultimately settled with an agreement that granted union members a 2.5 percent raise, retroactive to April 1, and an acknowledgement from hospital spokeswoman Nancy Uzo that to work with the replacements is “not the same as working with people who have worked here for five or ten years.”14
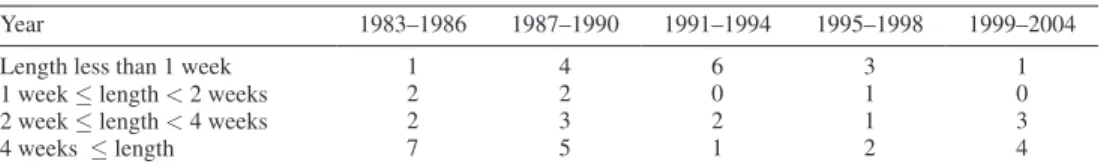
Tables 2 and 3 show the characteristics of the sample of strikes we use over the 1984–2004 period. Our sample contains 43 different facilities, five of which were struck twice and one of which was struck three times, for a total of 50 strike-facility combinations.15 Strike duration is right-skewed, with the median strike lasting 19 days,
and a mean strike length of 32 days. Twenty-one of our 50 striking hospitals admitted fewer than 30 patients per day. Three-fourths of our strikes are concentrated in the downstate area (regions 5–11), though our sample is distributed across all regions,
13 A unique feature of many metro-New York City hospitals is their participation in industry-wide contracts
covering dozens of facilities through the League of Voluntary Hospitals and Homes (League), an association
of nonprofit medical centers, hospitals, nursing homes and their affiliated facilities. The League acts as the bar-gaining agent for its members in labor contracts and represents them primarily in labor negotiations with 1199
Service Employees International Union (1199). Three of the strikes that occur during our sample period involve the
League. Because League strikes sometimes involved dozens of facilities striking simultaneously, no publicly avail-able sources explicitly documented the struck bargaining units at each individual hospital during League strikes. Therefore, we assumed knowledge of the correct group of striking workers at a League hospital only if we could find specific information on the bargaining unit struck at a particular hospital during a specified strike. For example, evidence of nurse representation at a League hospital in 1973 is not taken as evidence of representation in 1989 unless a specific document makes reference to nurses striking in 1989. Using these criteria, we include six struck League hospitals in our sample, dropping all hospitals without specific bargaining unit knowledge.
14 Mitch Freedman, “Striking Nurses Approve Contract,” Newsday, July 15, 2009, A31. See also:
Bill Bleyer, “Central Suffolk Hospital Nurses Approaching Strike Deadline,” Newsday, June 30, 2009, A48. Anonymous, “Central Suffolk Hospital Workers Go Out On Strike,” Newsday, July 2, 1999, A29.
Tim Gannon, “No Cure in Sight for CSH Strike,” The News review online, July 8, 1999, accessed March 9, 2009, http://www.timesreview.com/_nr_html/nr07-08-99/stories/news1.htm.
Mitchell Freedman, “OK’d Pact Ends Hospital Strike,” Newsday, July 17, 1999, A21.
15 Though there were a total of 51 strikes in our initial sample, because one hospital closed completely during
with at least one strike from each of the 11 New York State regions. Table 3 reveals that 26 of our 50 strikes occurred in 1990 or earlier. For the pre-1991 strikes, 46 percent of these lasted four weeks or longer, and 19 percent a week or less. For the post-1990 strikes, fewer strikes last for an extended period of time, with only 29 percent lasting four weeks or longer and 42 percent for seven or fewer days, though this period saw a number of especially long strikes, such as those at Nyack Hospital in 1999 (180 days struck) and St. Catherine of Siena Hospital in 2002 (105 days struck).
B. Hospital discharge data
Each short-term nonfederal hospital in New York State is required to submit discharge data to the New York State Department of Health through the Statewide
Table 2—The Strike Sample
(1)
Number of strike-facility combinations 50
Mean strike length (days) 32.1
Standard deviation strike length 39.2
Median strike length (days) 19.0
Distribution of struck hospital size
(Average number of daily admissions 6-months prior to strike)
5–14 admissions 11
15–29 admissions 10
30–45 admissions 17
45+ admissions 12
Distribution of facilities struck across regions
Region 1 5 Region 2 1 Region 3 1 Region 4 4 Region 5 7 Region 6 5 Region 7 8 Region 8 2 Region 9 2 Region 10 8 Region 11 7
Notes: Region 1 includes Allegany, Cattaraugus, Chautauqua, Erie, Genesee, Niagara, Orleans, and Wyoming counties.
Region 2 includes Chemung, Livingston, Monroe, Ontario, Schuyler, Seneca, Steuben, Wayne, and Yates counties.
Region 3 includes Broome, Cayuga, Chenango, Cortland, Herkimer, Jefferson, Lewis, Madison, Oneida, Onondaga, Oswego, St. Lawrence, Tioga, and Tompkins counties. Region 4 includes Albany, Clinton, Columbia, Delaware, Essex, Franklin, Fulton, Greene, Hamilton, Montgomery, Otsego, Rensselaer, Saratoga, Schenectady, Schoharie, Warren, and Washington counties.
Region 5 includes Dutchess, Orange, Putnam, Rockland, Sullivan, Ulster, and Westchester counties.
Region 6 includes Bronx county. Region 7 includes Kings county. Regions 8 and 9 include New York county. Region 10 includes Queens and Richmond counties. Region 11 includes Nassau and Suffolk counties.
Planning and Research Cooperative System (SPARCS). SPARCS has collected, at the patient level, detailed data on patient characteristics (e.g., age, sex, race), diag-noses (several DRG and ICD-9 codes), treatments (several ICD-9 codes), services (accommodation), and total charges for every hospital discharge in New York State since in 1982. These data are reviewed for quality and completeness by the New York State Department of Health. Failure to submit these data can carry conse-quences for the hospitals, including the withholding of reimbursement.16 Our data
include the universe of discharges from New York State from 1983–2005.
We include for each discharge abstract record a three-digit Diagnosis Related Group (DRG) weight as reported for the years 1983–2005 by the Center for Medicare and Medicaid Services (CMS), matching each year of discharge data with the corresponding year provided by CMS. This enables the creation of a case mix index for each hospital-day. Case mix is commonly used in administrative data to measure overall illness severity and case complexity. As an additional illness sever-ity control, we include for each administrative record the unweighted comorbidsever-ity illness components of the Charlson Index, an index shown to be strongly associated with mortality (Quan et al. 2005).17
As noted earlier, the strikes in our data typically last for a matter of days or weeks. Unless strike effects persist for a period long before and after a strike, identification of strike effects requires data collected at sufficiently precise time intervals so as to allow for outcome measurement at the weekly or even daily level. The standard issue, nonidentifiable SPARCS discharge files, however, allow only for the identifi-cation of the month and year of any given admission, discharge, or procedure. Our analysis makes use of restricted data elements not available in the public use data files, including the year, month and day of each admission, discharge, and proce-dure, as well as identifiers which enable the longitudinal tracking of patients within and across New York State facilities.18 Approval for these restricted data elements
required authorization from a Data Protection Review Board (DPRB) overseen by the state.
For our analysis, we use all data from each SPARCS region in which there is a strike during the one-year period surrounding the strike. The SPARCS region is a geographical subdivision of New York State, as defined by the New York Department
16 http://www.health.state.ny.us/statistics/sparcs/sysdoc/operguid.htm.
17 Our identification of these conditions utilizes code made available through the University of Manitoba Centre
for Health Policy at: http://mchp-appserv.cpe.umanitoba.ca/viewConcept.php?conceptID=1098#a_references.
18 Prior to 1995, patients in the New York State data could not be tracked longitudinally across facilities, due to
the lack of a unique personal identification number which is consistent across hospitals (same-hospital readmission
is identifiable prior to 1995). Beginning in 1995, New York hospitals began collecting an element consisting of a
combination of a patient’s last name, first name, and social security number which enabled the calculation of patient readmission. Accordingly, all strikes in our data occurring before 1995 contain no patient readmission measures.
Table 3 —Hospital Facilities Struck in NY State
Year 1983–1986 1987–1990 1991–1994 1995–1998 1999–2004
Length less than 1 week 1 4 6 3 1
1 week ≤ length < 2 weeks 2 2 0 1 0
2 week ≤ length < 4 weeks 2 3 2 1 3
of Health. These regions correspond closely to the Health Service Areas (HSA), measures commonly used to define hospital inpatient activity by New York State, though there are fewer HSAs, due mostly to the consolidation of the five boroughs as an HSA. For each region in the year surrounding the strike, we use all discharge records from hospitals providing short-term inpatient care.19 Our sample therefore
consists of all hospitals in any SPARCS region in the one-year time period surround-ing the date of a strike in that region.
We consider two measures of patient outcomes that may be affected by strikes. Our primary outcome of interest is in-hospital mortality. This is a clear measure of hospital performance along a dimension with unambiguous welfare implications. Following Geweke, Gowrisankaran, and Town (2003), we consider an in-hospital mortality measure which records as mortality a death occurring within the first ten days of a patient’s date of admission. This short follow-up period is chosen in order to prevent any bias that might arise from a strike-induced change in the length of stay, as well as to account for the fact that deaths occurring after the first ten days may not reflect initial management and care due to the transfer of terminally ill patients to other facilities.20 Of course, a limitation of our analysis is that we only know
within-hospital mortality, and not mortality following within-hospital stays. Thus, it is possible that any mortality increases that we find may reflect shifts in the timing of deaths; for example, Cutler (1995) finds that prospective reimbursement under Medicare led to a short-run rise in mortality but no long-run effect.
Our second major outcome measure is hospital readmission, which is defined in our data as an inpatient re-hospitalization to any New York State hospital, for any reason, which occurs within 30 days of the discharge. Hospital readmission is often an indicator of poor care or missed opportunities to improve quality of care during a hospital admission (MEDPAC 2007), and has been widely used by health econo-mists as a proxy for the quality of hospital care (Cutler 1995; Ho and Hamilton 2000; Kessler and Geppert 2005). This measure has also recently been proposed by policymakers as a quality metric to which Medicare reimbursement could be tied (Bhalla and Kalkut 2010).21
We also consider as dependent variables two utilization measures of hospital inputs: the length of stay for the patient and the number of procedures performed while in the hospital. We subset the number of procedures performed by procedure type, since hospitals may differ in the distribution of major and minor procedures offered during a strike, as well as whether a procedure is intended for diagnostic (nonoperative) or therapeutic (operative) purposes. In addition, we explored using total charges incurred to the patient as a measure of total resource utilization, though the results were suf-ficiently imprecise that we could not rule out either very large or small effects.
19 While this allows for the possibility of using some discharges from hospitals providing care that might be
different than the striking hospitals (all of which are general hospitals), using American Hospital Association survey
information from 1984 and 1999, the authors calculate within an HSA, the share of discharges from nongeneral hospitals in New York State is less than five percent.
20 Our results are similar using full-stay in-hospital mortality as an outcome measure, though the significance
level on the mortality coefficient decreases for our emergency subsample and increases for the nonemergency subsample.
21 We considered both any-hospital readmission (as reported in the paper) as well as readmission excepting
We also control for a variety of patient characteristics. All models control for available patient demographics, including age, gender, race (white versus non-white), and the number of conditions with which each patient is diagnosed upon their hospital admission. In addition, we can use data on diagnosis codes to form measures of patient illness severity. Whether such measures should be included is unclear since severity codes may themselves be impacted by a strike. We find no such effect on severity, however, and our results are not affected by the inclusion of these controls, as we discuss below.
Since the relevant variation is at the hospital/day level, we aggregate our data to that level; our sample consists of 393,960 hospital/days of data from 288 hospitals for our 50 hospital-strike combinations. We use three measures of “exposure” of patients to a strike. The first is a dummy variable for whether the patient’s day of admission was during a strike. This is the most straightforward measure but suf-fers from the problem that patients may be impacted by strikes that occur after their admission to the hospital. We therefore consider two alternatives: the share of patients admitted in that day who are exposed at some point during their stay to a strike; and the share of the stay that was during a strike, among patients admitted that day. These are more complete “exposure” measures but may suffer from the fact that length of stay may be impacted by the strike. In fact, as we show, our results are very robust to the exposure measure used.
The means for our sample are presented in Table 4. The mean number of daily admissions for hospitals in our sample is 28, or approximately 10,220 yearly admis-sions. Using the AHA average number of discharges per bed for the US for 1994 (the mid-point of our sample), this translates to approximately 271 beds. The aver-age daily case mix index of 1.01 reflects that hospitals in our sample treat patients with a resource need comparable to the average US hospital. The average 10-day in-hospital mortality rate is 1.9 percent. The average any-hospital readmission rate (available only post-1995) is 13.8 percent. The average number of procedures per-formed during a hospital stay is 1.65, 0.64 of which are diagnostic and 1.01 are therapeutic.22 Fifty-eight percent of the patients in our sample are female, two-thirds
are white, and the average age is 44.5. The number of conditions and number of Charlson comorbidities with which a patient is diagnosed are 3.4 and 0.56, respec-tively. Four-tenths of one percent of patients in our data are admitted during a strike. Sample means for the striking hospitals are presented in columns 3 and 4 for the six-month period prior to the strike, while the same statistics over this same time period are presented for the nonstriking hospitals in the same region in columns 5 and 6. Struck hospitals over this period are larger on average, with an average of 35 daily admissions versus 32 for their nonstriking counterparts. Patients at struck hos-pitals are slightly less complicated to treat, as measured by the case mix index, but are older and more likely to be covered by Medicare than are patients at nonstriking
22 Minor procedures are those not requiring the use of an operating room. HCUP’s classification system further
categorizes these procedures by whether they are diagnostic (e.g., CT scan of head), or therapeutic (e.g., irrigate
ventricular shunt) in nature. Major procedures are those that require the use of an operating room. HCUP’s
clas-sification system also categorizes these by whether a procedure is performed for diagnostic reasons (e.g., open
brain biopsy) or therapeutic reasons (e.g., aorta-renal bypass). The classification system is exhaustive in that every
hospitals. Patients at striking hospitals also have a slightly higher number of Charlson co-morbidities, and are diagnosed with more conditions than patients at nonstriking hospitals in the same region. Struck hospitals also have a lower length of stay and perform fewer procedures. The mortality rate at struck hospitals is higher than at nearby nonstriking hospitals, while 30-day readmission rates for the two groups are similar. The percent female and income of admitted hospital patients is similar for
Table 4— Sample Means
Sample All hospitals, full sample
Struck hospitals, 6-months before strike Nonstruck hospitals in same region as strike hospitals, 6-months before strike Mean Standard deviation Mean Standard deviation Mean Standard deviation (1) (2) (3) (4) (5) (6) Hospital characteristics
Number of daily admissions 28.0 24.5 34.74 21.59 31.77 10.64
Daily case-mix index 1.01 0.34 0.96 0.15 1.00 0.14
outcome variables
10-day in-hospital mortality (percent) 1.86 2.99 2.02 0.82 1.85 0.27
Length of stay 7.58 4.61 7.44 1.98 7.78 0.89
Total procedures performed 1.65 0.73 1.51 0.47 1.66 0.34
Minor diagnostic procedures performed 0.61 0.42 0.55 0.29 0.61 0.15
Minor therapeutic procedures performed 0.58 0.41 0.51 0.26 0.58 0.25
Major diagnostic procedures performed 0.04 0.05 0.04 0.03 0.04 0.02
Major therapeutic procedures performed 0.43 0.23 0.41 0.12 0.43 0.08
Diagnostic procedures performed 0.64 0.42 0.59 0.29 0.65 0.15
Therapeutic procedures performed 1.01 0.46 0.92 0.25 1.01 0.24
30-day readmission rate (percent) 13.80 7.50 13.83 2.57 13.67 0.79
30-day readmission rate
(percent, excluding transfers) 12.13 6.94 11.83 2.71 12.10 0.75
Patient characteristics Average age 44.46 11.14 46.49 8.20 43.75 3.90 Percent female 58.20 10.90 59.01 5.76 58.16 1.52 Percent white 66.55 29.34 67.44 27.98 61.95 22.56 Number of diagnoses 3.36 1.29 3.41 1.25 3.31 1.05 Charlson index 0.56 0.30 0.58 0.23 0.55 0.17
Percent covered by Medicare 30.14 15.78 32.24 12.19 28.93 6.36
Percent covered by Medicaid 18.69 18.70 20.45 16.94 21.17 12.68
Percent uninsured 6.53 7.75 5.89 4.68 6.95 3.05
Log income 10.57 0.39 10.48 0.36 10.49 0.33
Strike exposure
Percent of patients admitted during strike 0.35 5.88 — — — —
Percent of patients admitted exposed to strike
0.45 6.21 — — — —
Percent of patient stay exposed to strike 0.36 5.25 — — — —
distribution of admission type
Emergency (percent) 55.95 22.33 60.5 16.85 63.16 9.82
Non-emergency (percent) 44.03 22.32 46.45*** 16.24 53.94 11.35
Notes: Case-mix index, outcome variables, patient characteristics and distribution of admission type are weighted by the total number of admissions. Readmission rates calculated for post-1995 strikes only. Individuals are recorded as uninsured if their discharge record specifies self-pay or exempt from charges. Income is imputed using the median income recorded for a given zip code in the 1990 census for individuals admitted in 1983–1994, and the median income for a given zip code reported in the 2000 census for individuals admitted in 1995–2004.
both hospital groups, though struck hospitals admit a lower percentage of nonemer-gency patients than do struck hospitals.
III. Empirical Strategy
Our basic empirical strategy is to examine the utilization and outcomes in striking hospitals during a strike, relative to outcomes the rest of the year in that hospital, and relative to the other hospitals in their region during this same period. In this event-study approach, the unit of observation is the hospital (h), within region (r), by date of admission (d). Using this strategy, we run regressions of the form:
(1) oUTComEhrd= α + βSTriKEhrd + γPdEmhrd + δh + ηd
+ μy × σr + μm × σr + εhrd.
In this equation, OUTCOME is one of our measures of outcomes that might be affected by the strike (average daily mortality rate or average daily rates of read-mission), STRIKE is one of our three measures of strike impact/exposure, and PDEM is the mean characteristics of patients admitted that day (case mix index, number of diagnoses, Charlson comorbidities, age, share white and share female). We also include a full set of fixed effects for each hospital (δh) and a set of fixed
effects for date of admission, which includes year effects, fixed effects for each of the 52 weeks, and fixed effects for each of the seven days of the week (ηd). Finally,
we include a full interaction of year dummies (μy) and month dummies (μm) with SPARCS region dummies (σr) to account for any differential time trends by area.
With this specification, our identifying assumption is that the only reason for changing outcomes in striking hospitals, relative to others in their region, is the strike itself. We are able to rule out concerns about permanent differences between striking and nonstriking hospitals through the use of hospital fixed effects; we are only looking at differences that emerge during the strike, relative to the remaining period of the year when there is no strike.
There are two potential concerns with such an approach. The first is that there are underlying trends in hospital outcomes that are concurrent (or even causing) the strike. For example, deteriorating conditions in a hospital may cause both worsen-ing outcomes over time and the desire to strike. As discussed above, we have found no evidence of this as a cause of strikes. Nevertheless, we carefully investigate the dynamics in outcomes around strike periods to see if there is any evidence of dete-riorating outcomes preceding strikes.
The second concern is that the strike itself may change the composition of patients in the hospital, leading to changes in outcomes through composition bias and not real changes in treatment. For example, if strikes lead to admissions of only sicker patients, then this would be associated with both worse outcomes and more inten-sive treatment. Indeed, strikes are associated with reductions in hospital admissions. But we find no evidence that they are associated in any way with changes in patient demographics or case mix. Moreover, such a hypothesis would suggest that strikes would be associated with improved outcomes in nearby hospitals, or in striking
hospitals after the strike has ended. We find evidence for neither. Finally, we show in section VI that for strikes where replacement workers are used, there is no decline in admissions, yet we continue to see adverse effects on outcomes.
IV. Patient Outcome Results
In this section, we examine the impact of strikes on in-hospital mortality and hos-pital readmission. Table 5 presents our basic results for inpatient mortality. The first panel uses an indicator for the day of admission being during a strike as our measure of strike exposure. Column 1 shows a regression of average daily mortality for patients admitted that day on an indicator for whether that day was during a strike. This regres-sion includes only the fixed effect for hospital, time, and region×time interactions, as well as the strike indicator. We find a highly significant increase in patient mortal-ity associated with being admitted during a strike: among patients admitted during a strike, inpatient mortality is 0.34 percentage points higher than comparable patients admitted before or after a strike. This represents an increase of 18.3 percent relative to the baseline mortality rate of 1.86 percent, a sizeable increase.
The next column adds demographic characteristics, and the results are very similar, with the mortality coefficient rising to 0.36. The third column in this first panel adds indicators for patient severity, and the result is once again very similar, with a coefficient of 0.34. The coefficients on the case mix and Charlson cobidity measures are positive and highly significant, as would be expected: mor-tality rates are higher for admission days with a sicker case mix. There is also a positive association with average age, and a negative association with percent female and percent white. Interestingly, controlling for these other characteristics, there is a negative association with the total number of conditions with which a patient is diagnosed.
The next two panels extend the results to consider our two alternative measures of strike exposure. When strike exposure is measured as the share of patients admitted that day who are exposed to a strike, the coefficient is slightly smaller; when it is measured as the share of the stay that occurs during a strike, the impact is slightly larger. Overall, our findings are not sensitive to either controls or the measure of strike exposure.
Table 5 repeats this exercise for our other measure of patient outcomes, hospital readmissions. As noted earlier, readmissions information is only available after 1995, so our sample is restricted to the 14 strikes that took place during that period. As with mortality, there is a highly significant and robust increase in readmissions associated with strikes. For our strike admission indicator, we find that strikes are associated with a rise in readmission rates of 0.78 percentage points in the richest specifica-tion, off a base of 13.8 percent, so this represents a roughly 5.7 percent increase. The results are once again very robust with respect to the inclusion of demographic and severity controls, and with respect to the measure of strike exposure used.
A. Timing and Pre-existing Trends
One concern noted above is that our difference-in-difference identification strategy may be unable to disentangle differential trends between treatment and
Table 5— Imp
act of Strikes on 10-da
y In-Hospit
al Mort
ality
Independent v
ariable:
Indicator for admitted during strik
e
Proportion admitted e
xposed to strik
e
Proportion of stay that w
as during strik e Mean of dependent v ariable 1.86 1.86 1.86 (1 ) (2 ) (3 ) (4 ) (5 ) (6 ) (7 ) (8 ) (9 ) Strik e 0.33968*** 0.35548*** 0.33733*** 0.25223** 0.27492*** 0.25915*** 0.40969*** 0.42944*** 0.41124*** (0.11828 ) (0.10823 ) (0.10967 ) (0.10826 ) (0.09758 ) (0.09854 ) (0.12849 ) (0.11682 ) (0.11728 ) A verage age — 0.06840*** 0.04454*** — 0.06840*** 0.04454*** — 0.06840*** 0.04453*** — (0.00211 ) (0.00232 ) — (0.00211 ) (0.00232 ) — (0.00211 ) (0.00232 ) A
verage percent female
— − 0.00286*** − 0.00129** — − 0.00286*** − 0.00129** — − 0.00286*** − 0.00129** — (0.00066 ) (0.00064 ) — (0.00066 ) (0.00064 ) — (0.00066 ) (0.00064 ) A
verage percent white
— − 0.00294* − 0.00379** — − 0.00294* − 0.00379** — − 0.00294* − 0.00379** — (0.00154 ) (0.00166 ) — (0.00154 ) (0.00166 ) — (0.00154 ) (0.00166 ) Casemix inde x — — 0.23491*** — — 0.23481*** — — 0.23492*** — — (0.05714 ) — — (0.05714 ) — — (0.05713 ) A
verage number of diagnoses
— — − 0.08543*** — — − 0.08548*** — — − 0.08530*** — — (0.02634 ) — — (0.02634 ) — — (0.02634 ) A
verage Charlson Inde
x — — 1.47169*** — — 1.47194*** — — 1.47155*** — — (0.05994 ) — — (0.05992 ) -— — (0.05992 ) Observ ations 393,960 392,679 392,679 393,960 392,679 392,679 393,960 392,679 392,679 Notes:
Specifications in columns 1–6 are weighted by total admissions. Specifications in columns 7–9 are weighted by patient days.
All specifications include controls for week, year
, re gion × year , re gion ×
month, day of week and hospital fix
ed ef
fects. Rob
ust standard errors
are corrected for clustering within hospitals.
***
Significant at the 1 percent le
vel.
**
Significant at the 5 percent le
vel.
*
Significant at the 10 percent le
Table 6— Imp
act of Strikes on 30-da
y Readmission
Independent v
ariable
Indicator for admitted during strik
e
Proportion admitted e
xposed to strik
e
Proportion of stay that w
as during strik e Mean of dependent v ariable 13.80 13.80 13.80 (1 ) (2 ) (3 ) (4 ) (5 ) (6 ) (7 ) (8 ) (9 ) Strik e 1.04201*** 0.77013** 0.77924** 0.98638*** 0.68876** 0.70336** 1.21246*** 0.91845*** 1.0557*** (0.31743 ) (0.31289 ) (0.31789 ) (0.29080 ) (0.28272 ) (0.28600 ) (0.34735 ) (0.32087 ) (0.3456 ) A verage age — 0.19314*** 0.13746*** — 0.19314*** 0.13746*** — 0.19313*** 0.13745*** — (0.01170 ) (0.01287 ) — (0.01170 ) (0.01287 ) — (0.01170 ) (0.01287 ) A
verage percent female
— − 0.03950*** − 0.03673*** — − 0.03950*** − 0.03673*** — − 0.03950*** − 0.03673*** — (0.00369 ) (0.00380 ) — (0.00369 ) (0.00380 ) — (0.00369 ) (0.00380 ) A
verage percent white
— 0.00663* 0.00870** — 0.00662* 0.00869** — 0.00662* 0.00869** — (0.00362 ) (0.00355 ) — (0.00362 ) (0.00355 ) — (0.00362 ) (0.00355 ) Casemix inde x — — − 0.60192*** — — − 0.60233*** — — − 0.60217*** — — (0.10427 ) — — (0.10427 ) — — (0.10427 ) A
verage number of diagnoses
— — 0.14172* — — 0.14187* — — 0.14196* — — (0.07560 ) — — (0.07563 ) — — (0.07559 ) A
verage Charlson Inde
x — — 2.64499*** — — 2.64480*** — — 2.64467*** — — (0.16321 ) — — (0.16324 ) — — (0.16319 ) Observ ations 109,721 109,721 109,721 109,721 109,721 109,721 109,721 109,721 109,721 Notes:
Specifications in columns 1–6 are weighted by total admissions. Specifications in columns 7–9 are weighted by patient days.
All specifications include controls for week, year
, re gion × year , re gion ×
month, day of week and hospital fix
ed ef
fects. Rob
ust standard errors are corrected for clustering within hospitals.
***
Significant at the 1 percent le
vel.
**
Significant at the 5 percent le
vel.
*
Significant at the 10 percent le
control hospitals. If strikes occur at hospitals where quality is exogenously dete-riorating, it could give the appearance of a negative causal impact of strikes on outcomes.
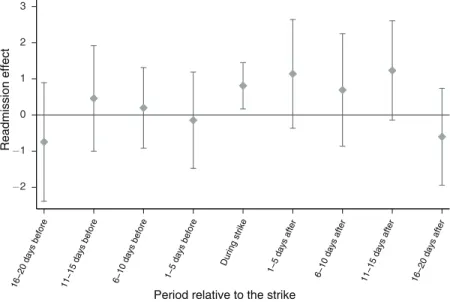
Figures 1 and 2 address this point by plotting the estimated coefficients and con-fidence bands on both of our outcome variables and each of eight dummy variables which equal one for those admitted 16–20 days before a strike, 11–15 days before, 6–10 days before, and 1–5 days before, as well as 1–5 days after, 6–10 days after, 11–15 days after, and 16–20 days after a strike. As we show for both of the out-come variables in these figures, there is no indication of any significant trend in outcomes before a strike; all of the dummy variables for the period beforehand are insignificant and, if positive, are small. The results are similar if we literally use 20 dummies to represent each day before a strike; three of the 20 dummies are signifi-cant for 10-day mortality, two negative and one positive, and two are signifisignifi-cant for re-admission, one positive and one negative.
The lagged effects of a strike, showing the impact after a strike has concluded, also show no significant trend in outcomes. For both mortality and readmission, the coef-ficients on the lagged variables indicate that the deleterious impact of a strike may per-sist for up to 15 days after a strike, though none of the coefficients on these variables are precisely estimated. A slight improvement in outcomes is observed for the period spanning 16–20 days after a strike, however, again these coefficients are insignificant.
B. Selection Bias Concerns
As noted earlier, another concern with our empirical strategy is that the nature of admissions may change when there is a strike. Indeed, there is a strong negative
Mortality effect
16−20 days before 11−15 days before 6−10 days before 1−5 days before During strike
1−5 days after 6−10 days after
11−15 days after 16−20 days after
Period relative to the strike
1
0.5
0
−0.5
Figure 1. Pre-Strike and Post-Strike Mortality Trends + − 1.96 standard error band shown with vertical bar.
relationship between strikes and admission rates. However, the fact that admissions fall does not mean that there is a change in the mix of patients admitted during a strike. In this section we explore these compositional concerns further by directly examining whether there is a change in the observable characteristics of patients admitted during a strike. Of course, this approach cannot rule out that there were unobservable differences among those admitted during a strike. But it seems unlikely, if patients admitted during a strike are very similar along all observed dimensions, that they would be very different along unobserved dimensions.
Column 1 of Table 7 shows the magnitude of the decrease in admissions during strikes, while the other columns show the results of our basic specification where the dependent variable is the mean characteristics of patients admitted that day: average age, percent female, percent white, case mix index, number of Charlson comorbidi-ties, and number of diagnoses. We also examine the change in insurance status for patients admitted during a strike using the daily percent enrolled in Medicare, per-cent enrolled in Medicaid, and uninsured individuals (those recorded as self-pay or exempt from charges). Furthermore, we analyze the change in income for patients admitted during strikes by imputing income at the zip code level. Column 1 shows a decrease in admissions during a strike of 26 percent. However, the remaining columns show an insignificant relationship between the average characteristics of patients and the strike indicator; that is, patients admitted during a strike are no dif-ferent than those admitted in other periods. This should not be surprising given the insensitivity of the results to adding controls in our earlier tables.
These effects are not only insignificant; the confidence intervals are also very small. For example, we find that strikes are associated with a −0.016 change in case mix index, off a mean of 1.01. This is a reduction of 1.6 percent. Given the standard
Period relative to the strike
3 2 1 0 −1 −2 Readmission effect
16−20 days before 11−15 days before 6−10 days before 1−5 days before During strike
1−5 days after 6−10 days after
11−15 days after 16−20 days after
Figure 2. Pre-Strike and Post-Strike Readmission Trends + − 1.96 standard error band shown with vertical bar.
Table 7—Effect of Strikes on Demographic and Dia gnosis Chara cteristics Dependent v ariable Log [1 +(# of admissions )] Age Percent female Percent white Casemix Inde x Number of procedures Total diagnoses Charlson Inde x Mean of dependent v ariable 2.99 44.46 58.20 66.55 1.01 1.65 3.36 0.56 (1 ) (2 ) (3 ) (4 ) (5 ) (6 ) (7 ) (8 ) Strik e − 0.30597*** − 0.133 0.706 1.405 − 0.016 − 0.05601 − 0.036 0.011 (0.07693 ) (0.559 ) (0.514 ) (1.275 ) (0.014 ) (0.06570 ) (0.066 ) (0.014 ) N 393,960 392,679 393,960 393,960 392,679 392,679 392,679 393,960 Ef fect of strik es on insur
ance status and income
Dependent v ariable Percent Medicare Percent Medicaid Percent uninsured Log of income Mean of dependent v ariable 30.14 18.69 6.53 10.57 (1 ) (2 ) (3 ) (4 ) Strik e 1.29897 1.26877 − 0.37079 − 0.00306 (0.86425 ) (0.97688 ) (0.41325 ) (0.00501 ) Observ ations 393,960 393,960 393,960 393,518 Notes: All
specifications are weighted
by total admissions, include controls for week, year , re gion × year , re gion × month, day of week and hospital fix ed ef fects. Rob ust standard errors
are corrected for clustering within hospitals.
***
Significant at the 1 percent le
vel.
**
Significant at the 5 percent le
vel.
*
Significant at the 10 percent le
error, this implies that the most case mix could have fallen is 3 percent, which is very modest given our 5.7 percent to 18.3 percent outcome effects.
As an additional check on the characteristics of patients admitted during strikes, we include in Table 8 the distribution of diagnoses at struck hospitals for patients admitted during a strike versus the three-week period prior to a strike, classifying diagnoses by their diagnosis related group (DRG). The table shows little indication of the presence of a more severe patient population during a strike. Eight of the ten most frequently observed pre-strike diagnoses are also among the ten most fre-quently observed diagnoses during the strike period, and those diagnoses seen with greater frequency during a strike are not mortality intensive.23 In addition, the four
most frequently observed diagnoses are identical for both time periods, accounting for 19.4 percent of all admissions in the pre-strike period, and 21.4 percent during the striking period. Overall, the two panels in Table 8, which account for 28.8 per-cent and 31.3 perper-cent of the pre-strike period and strike-period respectively, provide additional evidence that our results are not driven by a shift in the distribution of patients during the strike period.
23 With the exception of simple pneumonia, the mortality rates for the diagnoses that occur more frequently
during strikes are lower than the average mortality rate observed in our sample.
Table 8—10 Most Frequent Diagnoses at Struck Hospitals Admitted during the three week period before the strike
Diagnosis related group (DRG) admissionsNumber of admissionsPercent of
1 Normal newborn 2,890 8.02
2 Vaginal delivery without complicating diagnoses 2,534 7.04
3 Heart failure & shock 877 2.44
4 Cesarean section without complications or comorbidities 687 1.91
5 Cannot report due to provisions of data agreement 661 1.84
6 Simple pneumonia & pleurisy age >17 with complications or comorbidities 614 1.70
7 Alcohol/drug abuse or dependence, detoxification, w/o complications or
comorbidities
588 1.63
8 Neonate with other significant problems 520 1.44
9 Angina pectoris 495 1.37
10 Psychoses 490 1.36
Admitted during strike
Diagnosis related group (DRG) admissionsNumber of
Percent of admissions
1 Normal newborn 3,264 8.75***
2 Vaginal delivery without complicating diagnoses 2,828 7.58***
3 Heart failure & shock 992 2.66
4 Cesarean section without complications or comorbidities 895 2.40***
5 Psychoses 838 2.25***
6 Simple pneumonia & pleurisy age >17 with complications or comorbidities 825 2.21***
7 Neonate with other significant problems 555 1.49
8 Intracranial hemorrhage or cerebral infarction 510 1.37
9 Chest pain 495 1.33***
10 Angina pectoris 487 1.31
If striking hospitals are admitting only the sickest patients, then one of two things must be happening to the healthier patients: either they are delaying hospitalization or receiving treatment at other nearby hospitals. The former alternative is ruled out by our timing specification; delay in treatment by the healthiest patients would show up as negative lagged effects of the strike, which we do not see. The latter alternative can be tested by examining the impact of strikes on neighboring hospitals. We use two different methodologies to divide our control group into “very close” hospitals and “less close” hospitals within the region. These two methodologies follow meth-ods used in the literature on hospital competition.
The first is to use a measure of geographical closeness: the three hospitals clos-est to the striking hospital as the crow flies. The second is to use a “patient flow” measure common in competition research, which finds the competitor hospitals to the striking hospital by: identifying the share of patients in the striking hospital that come from each zip code over the previous six months; ranking the zip codes from most common to least and counting down the list until we have accounted for 40 percent of the hospital’s discharges; and then choosing any hospital that has at least 3 percent of their discharges in this set of zip codes.
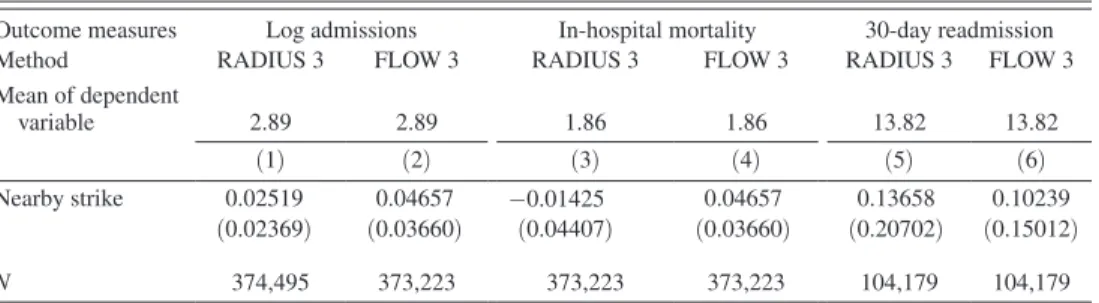
The results from using these two different approaches, for our key outcome variables, are shown in Table 9. Panel 1 reports the results from our specification (excluding our demographic and severity measures), using as our outcome vari-able the logarithm of the number of admissions at the nearby hospitals. The results indicate that nearby hospitals are admitting 2.5–4.7 percent more patients during a strike, though neither of these coefficients are significant at conventional lev-els. Panels 2 and 3 show that there are actually positive mortality and readmission effects on nearby hospitals in three of the four specifications, though in none of these are the coefficients statistically significant at conventional levels. However, if anything, these results suggest that nearby hospitals are admitting sicker patients, so that selection is not driving our findings.
To further address the possibility that our results are driven by a shift in the com-position of patients, we examine the effects on outcomes at the regional level. If the observed strike effects are driven by a region-wide redistribution of patients across hospitals, then analysis at a regional level should reveal no change in outcomes. For this analysis, we run regressions of the form:
(2) OUTCOMErd= α + βSTRIKErd + γPDEMrd
+ ηd + δw + μy× σr + μm× σr + ε,
where the unit of observation is the region (r) by date of admission (d). As was done in our previous specification, we include a full set of year (μy), month (μm), week (δw), day (ηd) and region (σr) fixed effects, as well as a full interaction of
year and month dummies with SPARCS region dummies. We measure our STriKE variable as an indicator of whether a hospital is struck in a particular region on a specific day.
Table 10 presents our basic results for our outcome measures, using the specifica-tion in (2). Column 1 shows that admissions do not decline at the regional level during
a strike. Both of our strike measures, however, indicate that regions with a striking hospital have worse outcomes during the strike. Our mortality regression shows con-siderably smaller yet significant effects at the regional level, while our readmission measure also indicates that patients in a struck region experience worse outcomes. Given that the number of regional hospital admissions does not change during a strike, these results provide further evidence that the deterioration in outcomes is not simply due to a redistribution of admission severity across the region during a strike.
V. Utilization Outcomes
The evidence in Section IV strongly suggests that patients admitted during strikes have significantly worse outcomes than patients admitted at other times. Is this because they receive less care, or because they receive worse care? To address this, we now turn to measures of patient treatment intensity.
Table 11 shows our basic results for our measures of treatment intensity: length of stay and number of procedures performed during the stay. Because the number
Table 9—Effects of Strikes on Nearby Hospitals
Outcome measures Log admissions In-hospital mortality 30-day readmission
Method RADIUS 3 FLOW 3 RADIUS 3 FLOW 3 RADIUS 3 FLOW 3
Mean of dependent variable 2.89 2.89 1.86 1.86 13.82 13.82 (1) (2) (3) (4) (5) (6) Nearby strike 0.02519 0.04657 −0.01425 0.04657 0.13658 0.10239 (0.02369) (0.03660) (0.04407) (0.03660) (0.20702) (0.15012) N 374,495 373,223 373,223 373,223 104,179 104,179
Notes: All specifications are weighted by total admissions. Mortality and readmission specifications include con-trols for average age, average share female, average share white, casemix index, average number of diagnoses,
average Charlson Index, week, year, region × year, region × month, day of week and hospital fixed effects. Log
admissions specification includes controls for week, year, region × year, region × month, day of week and hospital
fixed effects. Robust standard errors are corrected for clustering within hospitals.
*** Significant at the 1 percent level.
** Significant at the 5 percent level.
* Significant at the 10 percent level.
Table 10— Region-Level Analysis
Dependent variable Log admissions In-hospital mortality 30-day readmission
Mean of dependent variable 6.43 1.75 14.33
(1) (2) (3)
Strike −0.00712 0.03976*** 0.75919**
(0.01122) (0.00972) (0.30915)
Observations 92,410 92,410 44,164
Notes: All specifications include controls for week, year, region × year, region × month day of week and region fixed effects.
Columns 2 and 3 include controls for demographic and severity measures.
*** Significant at the 1 percent level.
** Significant at the 5 percent level.