Effect of Gold Nanorod Surface Chemistry on Cellular Response
The MIT Faculty has made this article openly available. Please sharehow this access benefits you. Your story matters.
Citation Grabinski, Christin et al. “Effect of Gold Nanorod Surface Chemistry on Cellular Response.” ACS Nano 5.4 (2011): 2870–2879.
As Published http://dx.doi.org/10.1021/nn103476x
Publisher American Chemical Society
Version Author's final manuscript
Citable link http://hdl.handle.net/1721.1/69944
Terms of Use Article is made available in accordance with the publisher's policy and may be subject to US copyright law. Please refer to the publisher's site for terms of use.
Effect of Gold Nanorod Surface Chemistry on Cellular
Response
Christin Grabinski1 , Nicole Schaeublin1 , Andy Wijaya2 , Helen D’Couto3 , Salmaan H. Baxamusa3 , Kimberly Hamad-Schifferli3,4*, and Saber M. Hussain1
*
1
Applied Biotechnology Branch, Human Effectiveness Directorate, Air Force Research Laboratory, Wright-Patterson AFB, Ohio
2
Department of Chemical Engineering, 3
Department of Biological Engineering, 4
Department of Mechanical Engineering, 77 Massachusetts Ave, Massachusetts Institute of Technology, Cambridge,
MA 02139
AUTHOR EMAIL ADDRESS
RECEIVED DATE
CORRESPONDING AUTHOR FOOTNOTE saber.hussain@wpafb.af.mil, schiffer@mit.edu
ABSTRACT. Gold Nanorods (GNR) stabilized with cetyltrimethylammonium bromide (CTAB) and GNR functionalized via a ligand exchange method with either thiolated polyethylene glycol (PEG) 5000 or mercaptohexadecanoic acid (MHDA) were investigated for their stability in biological media and subsequent toxicological effects to HaCaT cells. GNR-PEG and GNR-MHDA exhibited minimal effects on cell proliferation, whereas GNR-CTAB reduced cell proliferation significantly due to the inherent toxicity of the cationic surfactant to cells. Cell uptake studies indicated relatively low uptake for GNR-PEG and high uptake for GNR-MHDA. Reverse transcriptase polymerase chain reaction (RT-PCR)
revealed that GNR-PEG induced less significant and unique changes in the transcription levels of 84 genes related to stress and toxicity compared to GNR-MHDA. The results demonstrate that although cell proliferation was not affected by both particles, there is a significant difference in gene expression in GNR-MHDA exposed cells, suggesting long-term implications for chronic exposure.
KEYWORDS Nanorods, surface chemistry, cytotoxicity, gene expression, inflammation, cellular uptake
Gold nanorods (GNRs) are of interest in numerous biological applications, including photothermal therapy for gene/drug delivery,1, 2
disease targeting,3
and medical and biological imaging.4
Many of these applications are enhanced by the ability to manipulate the aspect ratio (AR) of GNRs, which allows the plasmon peak absorption and scattering wavelength to be tuned to the near infrared. Due to the transparency of tissue in this optical regime (800nm-1100nm), this allows for photothermal applications via laser irradiation and biological imaging that penetrate biological tissue. Additionally, the surface of GNRs can be modified via thiol chemistry, enabling conjugation to biomolecules for specific targeting, uptake, or delivery.5
Because GNRs are being developed for many biological applications, it is important to understand how the different physical and chemical properties of GNRs impact cells.6, 7
In particular, the surface chemistry of GNRs can dictate their biological behavior.6
Previous studies of various types of nanoparticles have indicated that their surface chemistry strongly influences cell toxicity and uptake.8-15
GNR synthesis requires the surfactant cetyltrimethylammonium bromide (CTAB),16
and GNR-CTAB not only have poor stability in biological solutions, but also exhibit significant cytotoxicity.13, 15, 17, 18 Several surface coatings have been proposed in order to reduce the apparent toxic effect of the GNRs, such as by “cloaking” the CTAB-GNRs with polyelectrolytes,13
phospholipids,5
or exchanging the CTAB with another molecule such as thiolated PEG.10
adsorb on the GNR surface, and studies have elucidated a relationship between GNR surface charge before and after protein adsorption and its affect on uptake.13, 21
Typically, the metric for assessing GNR toxicity has been cell viability. However, exposure to GNRs can result in consequences beyond proliferation and uptake.22
For example, GNR exposure may result in longer term effects related to stress such as inflammation or oxidative stress.23, 24
Evaluation of markers related to apoptosis, senescence, inflammation, and others can yield a more complete picture of stress and toxicity. Recently, gene expression in the spleen and liver of rats was evaluated after exposure to citrate-stabilized gold nanoparticles, which are generally considered to be biocompatible. The results showed changes in expression of genes related to detoxification, lipid metabolism, cell cycle, defense response, and circadian rhythm.25
In another study, inflammation-related genes were up or down regulated as a function of GNR surface chemistry.23
These studies highlight the importance of understanding the impact of GNRs with different surface chemistries on not only cell proliferation and uptake, but also on gene expression. The PCR method is desirable for this type of study because it allows an array of genes to be investigated. It is also recognized as a reliable technique with controls incorporated into the array to ensure data quality.26
Furthermore, GNR ligands have been expanded to include new classes of molecules such as mercaptocarboxylic acids, which passivate the GNRs by forming a thiol bonded monolayer and permit water solubility.27
However, the cellular response elicited by exposure to GNRs functionalized with these new classes of molecules has not been well characterized.
Here we evaluate the relative toxic effect of GNRs to the human keratinocyte cell-line HaCaT as a function of surface chemistry. Because GNRs are being developed for many applications that require excitation through skin tissue, toxicity to the skin is important to understand. HaCaT cells were chosen as a representative model for understanding general mechanisms of toxicity in human skin. As-synthesized GNRs functionalized with CTAB were compared with GNRs coated with thiolated PEG5000 and mercaptohexadecanoic acid (MHDA), a representative mercaptocarboxylic acid. GNR stability in biological media, and effect on cell proliferation, morphology, and uptake were probed. Real-time
reverse transcriptase polymerase chain reaction (RT-PCR) was used to investigate the effects on gene expression for GNR-MHDA and GNR-PEG. We find that GNR surface chemistry strongly influences gene expression patterns. More importantly, we find that while GNR-MHDA and GNR-PEG exhibited low cytotoxicity as evidenced by the MTS cell proliferation and reactive oxygen species (ROS) assays, they can have a dramatic effect on the expression of genes related to stress response and toxicity.
Results and Discussion
Characterization of GNRs and stability in biological media
GNRs were synthesized using the seed mediated method described in the literature.28
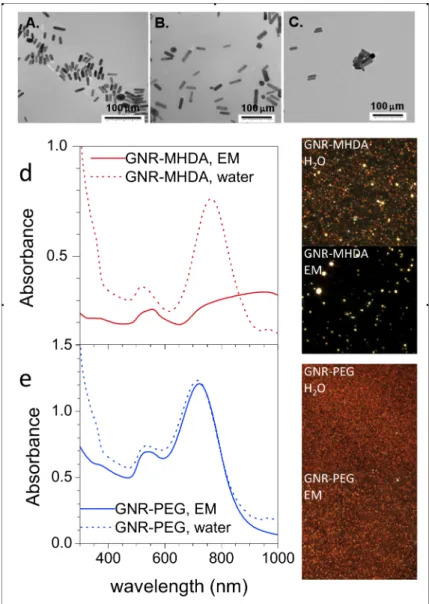
Transmission electron microscopy (TEM) characterized the morphology and size distribution of GNRs. The morphology for all GNR samples is rod-like with a small amount of spheres. MHDA and PEG exhibited similar size distributions and ARs, but these values were slightly smaller for GNR-CTAB due to synthesis batch variability (Figure 1A-C, Table 1).
UV-VIS spectroscopy and darkfield (DF) images confirmed that GNRs have different stabilities in RPMI-1640 exposure media (EM), which was used as dosing media for cell studies. GNR-MHDA shows a loss in the longitudinal peak in the UV-VIS spectrum, indicating agglomeration (Figure 1d, dashed vs. solid). DF images of the GNR-MHDA also show an increase in the size of the particles and reduced background containing individual GNRs when the solution was changed from water to EM (Figure 1d, insets). The longitudinal peak of the GNR-PEG did not decrease or shift upon exposure to EM (Figure 1e, dashed vs. solid), and the DF image of the GNR-PEG did not change substantially from water to EM (Figure 1e, insets), indicating that GNR-PEG exhibit increased stability in media versus GNR-MHDA.
Figure 1. TEM characterization of GNR morphology and size distribution. a) CTAB; b) GNR-MHDA; c). GNR-PEG. d) UV/VIS results for GNR-PEG and e) GNR-MHDA in water (dashed) and EM (solid). Insets: DF images of GNRs in water and media.
Table 1. Size characterization of GNRs by TEM.
Sample GNR-CTAB GNR-MHDA GNR-PEG
Average Length (nm) 25.6±3.6 35.5±8.9 31.7±9.6
Average Width (nm) 8.2±1.1 10.1±2.8 9.1±3.2
Zeta potentials of the GNRs were measured using laser Doppler electrophoresis (Table 2). GNR-PEG exhibited the most neutral zeta potential of -11.1 ± 0.989mV, while GNR-CTAB and GNR-MHDA exhibited zeta potentials of +44.5 mV and -46.2 mV, respectively. These changes in zeta potential confirmed the ligand exchange to neutral and negatively charged ligands. When the GNRs were exposed to EM, the zeta potentials for GNR-MHDA and GNR-PEG shifted closer to neutral, which has been observed by others and attributed to be due to the amino acids in the EM adsorbing to the particles.29 Because GNR-CTAB precipitated in EM, it was not possible to measure its zeta potential, again demonstrating its poor stability in biological fluids.
Table 2. Zeta Potential Data for GNRs in water.
Sample Zeta Potential (mV)
Water EM
GNR-CTAB +44.5 ± 0.354 N/A GNR-MHDA -46.2 ± 0.354 -8.37 ± 0.781
GNR-PEG -11.1 ± 0.989 -4.97 ± 0.950
Cell Proliferation
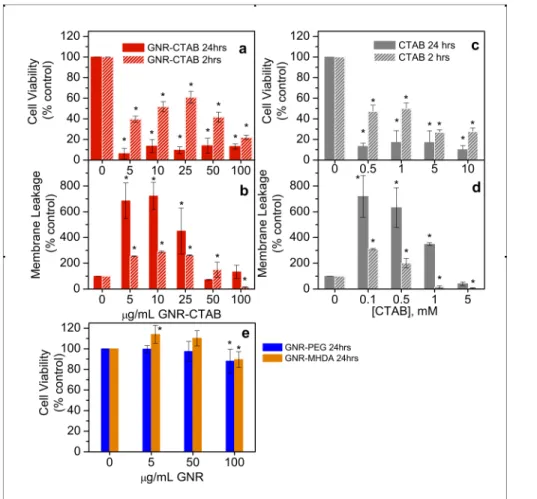
MTS assays were performed to determine the effect of 24 h exposure to GNRs on the cell proliferation of HaCaT cells. After a 24 h exposure to GNR-CTAB, cell proliferation was reduced by 80% from control at all concentrations, indicating that they are highly toxic (Figure 2a, solid red). Even at the lowest dose of 5 µg/ml, only 5-10% of the cells were still viable. There was no trend of a dose-dependent response. A similar response was shown by the CTAB alone (Figure 2c, solid gray).
For GNR-CTAB, the LDH membrane leakage assay was performed to verify MTS results (Figure 2b, solid red). There were high levels of membrane leakage at the lower doses, but at the higher doses the amount of leakage was reduced. This is most likely caused by the fact that higher doses have a cytotoxic effect earlier than lower doses, and thus result in lower LDH production by the cells. A similar trend was observed with the CTAB alone (Figure 2d, solid gray). Thus, the free CTAB inherent in the GNR-CTAB sample is most likely responsible for the GNR toxicity, as has been found by others.13
Earlier times were probed for both MTS and LDH assays to determine whether LDH leakage could be observed at earlier times. Within 2 h of exposure to the GNR-CTAB, there was a significant loss in cell proliferation (Figure 2a, hatched red) and an increase in membrane leakage (Figure 2b, hatched red). Again, these results were also observed after cellular exposure to CTAB alone (Figure 2c, d, hatched gray).
Figure 2. Cell proliferation following a 24 h and 2 h treatment with GNR-CTAB. a) MTS assay; b) LDH assay. Cell proliferation following a 24 h and 2 h treatment with CTAB. c) MTS assay; d) LDH
assay. e) Cell proliferation following a 24 h treatment with GNR-MHDA and GNR-PEG measured via MTS assay. Error bars indicate standard deviation, asterisks denotes significance (p<0.05).
The MTS assay was carried out for GNR-PEG and GNR-MHDA after a 24 h exposure to determine if surface functionalization could eliminate the toxic effects observed after exposure to GNR-CTAB (Figure 2e). MTS results indicate that GNR-MHDA (Figure 2e, orange) exhibited a slight proliferative effect (14%) on cells after a 24 h exposure period at low concentrations (5 µg/mL) and exhibited an inhibitive effect (12%) at high concentrations (100 µg/mL). GNR-PEG (Figure 2e, blue) inhibited cell proliferation by only 10% at the highest concentration (100 µg/mL). These results show that changing the GNR ligand can reduce their cytoxic effect.
The proliferative effect observed for GNR-MHDA has been previously reported for gold nanostars.30 This was also shown in another study where the MTS and Neutral Red assays showed increased proliferation after exposure to nanoparticles, but Trypan Blue exclusion assay and protein quantification did not show increased cell viability. It was hypothesized that the increase in proliferation observed by the mitochondrial-based assay is related to the high energy demand for endocytosis, which increases mitochondrial enzyme activities.31
The ROS assay was performed to determine the oxidative stress response of cells exposed to GNRs.9, 32
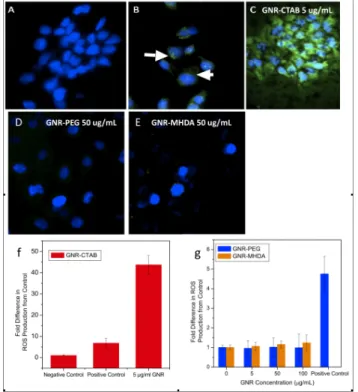
Qualitative data showed elevated production of ROS in cells exposed to GNR-CTAB (Figure 3a-e). The negative control cells showed no ROS production as expected (Figure 3a), while the positive control cells showed ROS formation (Figure 3b). GNR-CTAB exhibited a significant increase in ROS production, much higher than the positive control (Figure 3c). GNR-PEG (Figure 3d) and GNR-MHDA (Figure 3e) at 50 µg/mL resulted in no significant increase in ROS formation, as evidenced by the low green signal. Quantitative ROS data was collected for GNR-CTAB, GNR-MHDA and GNR-PEG in order to evaluate their effect on HaCaT cells. GNR-CTAB at 5 µg/mL showed a > 40 fold increase of ROS formation relative to the negative control (Figure 3f). Neither GNR-MHDA (Figure 3g, orange)
nor GNR-PEG (Figure 3d, blue) over the concentration range of 0-100 µg/ml induced significant ROS after exposure, with ROS production showing only 0.9-1.01 fold differences.
Figure 3. Oxidative stress production after exposure to GNR-CTAB. a) Negative control; b) Positive control (0.03% H2O2); c) 5 µg/ml GNR-CTAB, d) 50 µg/ml GNR-PEG, e) 50 µg/ml GNR-MHDA. Nuclei are stained with Hoechst and the DCFH probe fluoresces green in the presence of ROS. White arrows indicate green fluorescence produced in positive control. f) Oxidative stress production after exposure to GNR-CTAB and g) GNR-MHDA and GNR-PEG. Data were normalized FITC intensity to Hoechst intensity to account for cell number.
Cell Morphology and Uptake
DF imaging was used to probe cell morphology upon GNR exposure and evaluate GNR uptake relative to unexposed cells (Figure 4a). DF images indicated a high level of association of GNR-MHDA with cells at the 24 h time point (Figure 4c) relative to GNR-PEG (Figure 4e).
Both GNR-MHDA and GNR-PEG appear to be internalized by cells, as determined by TEM (Figure 4d, f). GNRs appear to have been taken up via endocytosis and are localized in endosomes within the
cell. However, the number of GNRs taken up is considerably greater for GNR-MHDA than GNR-PEG. This result is expected due to the nearly neutral zeta potential of PEGylated surfaces and relative inertness of PEGylated GNRs in biological media. Additionally, larger agglomerates of GNR-MHDA were exposed to cells, which could also play a role in the increased level of uptake due to an increased rate of gravitational settling versus GNR-PEG.33
Figure 4. Cell uptake of GNR-MHDA and GNR-PEG in HaCaT cells via DF imaging (a, c, e) and TEM (b, d, f). a-b) Control (no particle exposure); c-d) GNR-MHDA; e-f) GNR-PEG.
A
A
A.
.
.
B.
C
C
C.
.
.
E
E
E.
.
.
D.
F.
Stress & Toxicity Array Analysis
Real-time reverse transcriptase polymerase chain reaction (RT-PCR) was used to determine the effect of PEG and MHDA on HaCaT cells at non-toxic doses (50 µg/mL), in addition to GNR-MHDA at 5 µg/mL, to further investigate the proliferative effect observed by the MTS assay for cells exposed at that concentration. The Stress and Toxicity Array was used to evaluate the expression of genes directly regulated by oxidative or metabolic stress and heat shock, as well as genes that are representative of pathways activated by prolonged stress, such as apoptosis and senescence. The expression of genes was determined based on their average threshold cycles (Ct), which is equal to the cycle number at which fluorescence generated crosses a threshold. The Ct values were normalized based on the mean of Ct values for a set of 5 housekeeping genes for each trial. Fold regulation was determined for each test sample (GNR-PEG and GNR-MHDA) versus the negative control based on an inverse relationship of the normalized Ct values, which were averaged for triplicate trials. A heat map for each GNR sample is shown in Figure 5a-c based on fold regulation between -5 and 10.
Genes that were significantly different for GNRs versus the negative control were determined by a Student’s t-test comparing the normalized Ct values for each test sample to the negative control. Genes with p<0.05 and fold regulation with magnitude >3 are shown in Table 3.
Exposure to GNR-PEG and GNR-MHDA induced unique gene regulation patterns. GNR-PEG induced down-regulation of genes associated with apoptosis, DNA damage, and growth arrest, including those that encode for apoptosis-related cysteine peptidase, also known as interleukin 1, beta, convertase (CASP1), serine/threonine-protein kinase (CHEK1), and growth arrest and DNA damage inducible protein, alpha (GADD45A) in the range of -4.0 to -5.6 (Table 3). CASP1 proteolytically cleaves pro-IL-1 beta to its mature, active form. Overexpression of CASPpro-IL-1 leads to apoptosis; however, this gene was down-regulated, which has been found to occur in cancer cells.34 CHEK1 is a DNA damage response, and its decrease allows survival by reducing the apoptosis pathway.35 GADD45A down-regulation also occurs in tumor tissues. It is related to growth arrest and senescence, but also plays a role in inducing
apoptosis. Its down-regulation could be related to cell survival.36
These results show that GNR-PEG does have some effect on cellular response.
In comparison, GNR-MHDA at 50 µg/mL induced significant up-regulation of genes associated with heat shock and inflammation. Up-regulation of genes related to heat shock indicates that the cells exhibited stress responses upon exposure to GNR-MHDA. When exposed at the high concentration (50 µg/mL), genes encoding for both heat shock 70kDa protein 8 (HSPA8) and heat shock protein 90 (HSP90AA2) were up-regulated by 7.2 and 25.5, respectively. HSPA8 and HSP90AA2 are known to work as a molecular chaperone system, which facilitates correct protein folding.37 HSPA8 has also been shown to enhance survival of cells and prevent apoptosis under stress conditions.38
GNR-MHDA exposure also up-regulated two genes associated with inflammation. IL1A, which was up-regulated by 7.8 fold, is in the interleukin 1 cytokine family and indicates a pro-inflammatory response. IL-1 is involved in modulating the immune response and production of this protein affects many signal transduction pathways.39
The other gene is Serpine1, a serine protease inhibitor, which was up-regulated 21.1 fold, which acts by inducing the synthesis of a protein that inhibits the activity of tissue plasminogen activator. Plasminogen activator plays a role in cell movement and inflammation. This suggests a significant anti-inflammatory effect induced by exposure to GNR-MHDA after a 24 h exposure period. Serpine1 has been shown to stimulate keratinocyte adhesion and migration, in addition to rescue keratinocytes from plasminogen-induced substrate detachment.40
Interaction of GNR-MHDA with the cell membrane could affect cell movement, which may play a role in the inhibition of plasminogen activator. Cell uptake could also be related to this inflammation response. In addition to heat shock and inflammation related genes, one gene that plays a role in DNA damage repair was up-regulated significantly. XRCC2 was up-up-regulated by 5.7, which induces the synthesis of a protein, and is involved in DNA damage repair.41
The reason for translation of this gene is unknown, but could be related to insult suffered by HaCaT cells after significant cell uptake of GNR-MHDA at 50 µg/mL.
There were unique genes up-regulated by the low concentration of GNR-MHDA (5 µg/mL). Cells exposed to the lower concentration of GNR-MHDA shared up-regulation of heat shock and inflammation genes HSP90AA2 and IL1A, but not the other genes effect by GNR-MHDA at 50 µg/mL. Interleukin 6 (IL-6) has been shown to increase the proliferation of keratinocytes, so the up-regulation of the gene encoding this proten could be related to the proliferation observed at low concentration exposure to GNR-MHDA.42 IL-1 alpha and beta are involved in a variety of cellular activities, including cell proliferation, differentiation, and apoptosis. Although keratinocytes produce both IL-1 alpha and beta mRNA in vitro, they do not process IL-1 beta, so the up-regulation observed does not likely indicate a route for cell proliferation.43
The gene encoding for tumor necrosis factor (TNF), TNFRSF1A, was also up-regulated. TNF is a major mediator of apoptosis, inflammation, and immunity, which indicates additional cell signaling changes in the cells that are not indicated by the cell proliferation and morphology data.44
Overall, the changes in gene expression for each test sample is likely caused by many different aspects of GNR exposure to HaCaT cells. Direct interactions, such as binding to the cell membrane and uptake into intracellular organelles are one cause for changes in gene expression. However, these changes could also be related to indirect interactions. For example, one study in the literature showed that nanoparticles caused DNA damage to cells indirectly, without ever being directly exposed to or taken up by the cells.45
It is hypothesized in this report that damage is due to transmission of purine nucleotides and also intercellular signaling. Thus, it is possible that GNRs could interact with macromolecules in the extra-cellular environment, which could affect cell signaling, and therefore affect gene expression. GNR interaction with macromolecules has been reported and is suggested to be a dynamic process that occurs in any biological environment.30
In order to provide a threshold for the significance of the gene expression data, it may be useful to compare the results to data available in the literature for a material that is known to be toxic, such as asbestos. A study investigating the toxicity of asbestos using the Stress and Toxicity Array showed
up-regulation of genes related to inflammation and down-up-regulation for genes associated with oxidative or metabolic stress with fold regulation in the range of 50 fold for increase to 10 fold for decrease, with an overall pro-inflammatory response.46
In a study investigating the regulation of 5 genes related to inflammation in macrophages after exposure to GNRs, positively charged endgroups led to anti-inflammatory response, whereas negatively charged endgroups lead to pro-anti-inflammatory effects, and neutral endgroups seemed to exhibit minor effects with fold regulation of 33 fold for increase and 20 fold for decrease.23
This indicates that up-regulation of Serpine1 to 21.1 after exposure to GNR-MHDA is in line with previous assays and indicates a less significant response than asbestos and equal to slightly more significant response compared to other GNR surface chemistries.
1 2 3 4 5 6 7 8 9 10 11 12
ANXA
5 ATM BAX BCL2L1 CASP1 CASP10 CASP8 CAT CCL21 CCL3 CCL4 CCNC A CCND1 CCNG1 CDKN1A CHEK2 CRYAB CSF2 CXCL10 CYP1A1 CYP2E1 CYP7A1 DDB1 DDIT3 B
DNAJ
A1 DNAJB4 E2F1 EGR1 EPHX2 ERCC1 3 ERCC FASLG FMO1 FMO5 GADD45A GDF15 C
GPX1 GSR HSF1 D
-5.0
+10.0
A.
C.
B.
D.
3 X1 1A 1L 2 4 5 6 8 HSPB
1 HSP90AA2 HSP90AB1 HSPD1 HSPE1 1 HSPH IGFBP6 IL18 IL1A IL1B IL6 LTA E MDM
2 MIF MT2A NFKB1 NFKBIA NOS2 PCNA POR PRDX1 PRDX2 PTGS1 RAD23A F RAD5
0 SERPINE1 SOD1 SOD2 TNF TNFRSF1A F10 TNFS TP53 UGT1A4 UNG XRCC1 XRCC2 G
Figure 5. Representative heat maps based on fold regulation of stress and toxicity genes after exposure to GNRs compared to negative control sample. A. GNR-PEG 50 µg/mL; B. GNR-MHDA 50 µg/mL; C. GNR-MHDA 5 µg/mL; D. Stress and toxicity array layout. Asterisks in the heat map correlate with p<0.05 and fold regulation > 3 for n≥3.
Table 3. Genes Significantly Affected by Exposure to GNRs. Boldface indicates significant changes, (Students t-test, p<0.05).
Fold Regulation (compared to control) Gene
Symbol Gene Type GNR-PEG
50 µg/mL
GNR-MHDA 50 µg/mL
GNR-MHDA 5 µg/mL
CASP1 Apoptosis signaling -5.6↓ 1.0 -1.2
TNFRSF1A Apoptosis signaling -1.5 1.5 8.4↑
CHEK2 DNA damage & repair -5.0↓ 1.2 1.2
XRCC2 DNA damage & repair 1.2 5.7↑ 1.4
GADD45A Growth arrest & senescence -4.0↓ -2.0 -2.2
HSPA8 Heat shock -3.0 7.2↑ 1.8
HSP90AA2 Heat shock -1.7 25.5↑ 18.8↑
IL1A Inflammation 1.1 7.8↑ 6.8↑
IL1B Inflammation -1.2 3.2 8.5↑
IL6 Inflammation -1.9 1.4 6.4↑
Summary and conclusions
GNRs coated with different ligands induced unique responses in HaCaT cells, supporting the strong influence of surface functionality on biological effects. Ligand exchange to MHDA and PEG resulted in improved viability and lower toxicity compared to GNR-CTAB. However, while GNR-PEG and GNR-MHDA did not result in significant decreases in cell proliferation by the MTS test, they significantly affected the expression of genes related to stress and toxicity. These changes in gene expression were more significant for GNR-MHDA, which could be due to the higher level interaction with serum proteins in the biological media, which are likely dynamically exchanged with different macromolecules once introduced into the cellular environment.21, 47
Additionally, GNR-MHDA exhibited greater interaction with the cell membrane and uptake into the cells than that observed for GNR-PEG. If changes in gene expression persist for long exposure, there is likely to be more severe toxicity for chronic exposures to GNR-MHDA. GNR-PEG shows promise for applications due to high level of stability in biological media and low level of cytotoxicity compared to GNR-MHDA. However, PCR results suggest that GNR-PEG are not entirely inert, and the uptake is low, so for applications requiring more significant cell uptake, further studies into the effect of PEG molecular weight, different surface ligands, and the use of targeting moieties should be further investigated.
Methods
GNR synthesis
GNRs were synthesized using the seed-mediated growth method28
. The preparation of the seed solution used the following typical protocol: 7.5 ml of 0.2 M CTAB solution was mixed with 0.25ml 0.01M HAuCl4 in a beaker. While the solution was vigorously stirred, 0.6 ml of ice-cold 0.01 M of NaBH4 was added and the solution turned brownish yellow. Vigorous stirring continued for another 2 min and then it was kept undisturbed at room temperature. 10 ml of 0.01 M of HAuCl4 was added into 237.5 ml 0.1 M CTAB in a glass bottle, and the solution turned orange. 1.5 ml of 0.01 M AgNO3 was added to the solution, followed by gentle mixing. 1.6 ml of 0.1 M ascorbic acid was added into the solution, followed by gentle inversion until the solution turned colorless. 2 ml of seed solution was gently added to the growth solution. The solution sat on the bench undisturbed overnight, during which it turned reddish brown.
GNR ligand exchange
The CTAB surfactant on the GNR surface was replaced with mercaptohexanoic acid (MHA) by round-trip phase transfer ligand exchange as described in detail in 27
. Briefly, a two-phase extraction method was utilized in which GNR-CTAB in water were functionalized with dodecanethiol to pull them into an organic phase. Acetone was used to facilitate this phase transfer. The DDT functionalized GNRs were then pulled back into the aqueous phase by the ligand mercaptohexanoic acid, MHA. This resulted in both nanocapsules and nanobones coated with MHA.
GNR Characterization
To visualize the structure and size of the GNRs, a drop of the stock for each sample was placed on a TEM grid and viewed using a Hitachi H-7600 microscope at 100kV. The length and width were averaged for 100 particles measured using ImageJ software48
The concentration of stock solutions was determined using UV/vis spectroscopy. The molar concentration of the GNR samples was calculated based on the Beer-Lambert Law using an extinction coefficient of 4.6 ×10⁹
M-1 cm-1
at 800 nm. This result was multiplied by the dilution factor to yield the final molar concentration. To convert molar concentration to mass concentration, it was assumed that the GNRs were cylindrical with dimensions of 11 nm in diameter and 44 nm in length, and have a density of 19.30 g cm-3
.
Cell Culture
The human keratinocyte cell line (HaCaT) was generously donated by the Army Research Lab. The cells were cultured in a flask with RPMI-1640 media (ATCC) supplemented with 10% fetal bovine serum (FBS, ATCC) and 1% penicillin/streptomycin (pen/strep, Sigma). For GNR exposure, serum free media was supplemented with 1% penicillin/streptomycin and was labeled as the exposure media (EM). Cells were incubated at 37°C in a humidified incubator with 5% CO2.
Stability of GNRs in Biological Media
The relative stability of each GNR sample was determined after dispersion in water or EM using UV/VIS, DLS, and DF microscopy. For these studies, GNRs were suspended at a concentration of 100 µg/mL in water or EM and vortexed 30 seconds upon dilution and again immediately before analysis. Samples were analyzed within 1 h of dilution. UV/vis measurements were performed using a Varian Cary Bio 300 UV/VIS Spectrophotometer. A Malvern Zetasizer was used for for zeta potential analysis of GNRs dispersed in water based on laser Doppler electrophoresis. For DF imaging, a small volume of this sample was spotted on a microscope slide and allowed to dry in air. Imaging was performed using a DF condenser from CytoViva attached to an Olympus BX41 microscope and DAGE camera/software.
For biochemical assays, cells were seeded in a 96 well plate at a concentration of 1.0 x 10⁵
cells/cm2 and allowed to proliferate and adhere for 24 h. Cells were dosed with varying concentrations of GNRs (5, 50, and 100 µg/mL) in media without serum (EM). The addition of EM to cells served as negative controls. Biochemical assays were initiated after a 24 h exposure and included the MTS, LDH, and ROS assays.
The MTS assay was performed using the CellTiter 96 Aqueous One Solution Cell Proliferation Assay (Promega). The solution reagent contains a tetrazolium compound [3-(4, 5-dimethylthiazol-2-yl)-5-(3-carboxymethoxyphenyl)-2-(4-sulfophenyl)-2H-tetrazolium, inner salt; MTS] and an electron coupling reagent (phenazine ethosulfate; PES). Metabolically active cells reduce the MTS compound into a colored formazan product that is soluble in tissue culture medium and can be measured using a standard microplate reader. After 24 h, the supernatant containing GNRs was aspirated from the wells and the cells were washed 3X with 1X PBS to remove residual GNRs. Mitochondrial function was then assessed according to the manufacturer’s instructions.
Lactase dehydrogenase leakage (LDH) was evaluated to determine the integrity of the cell membrane using the used the CytoTox 96 Non-Radioactive Cytotoxicity Assay (Promega, Madison, WI). This is a colorimetric assay that quantitatively measures LDH, a stable cytosolic enzyme that is released upon cell lysis. Released LDH in culture supernatants is measured with a 30-min coupled enzymatic assay that results in the conversion of a tetrazolium salt into a red formazan product. For both the MTS and LDH assay, the formazan product was measured by the amount of absorbance at 490 nm with a standard microplate reader (SpectraMAX GeminiXS, Molecular Devices, Sunnyvale, CA). The absorbance is directly proportional to the number of metabolically active cells and the number of lysed cells in the MTS and LDH assays, respectively. The spectrophotometer was calibrated to zero absorbance using EM without cells and a background reading was taken immediately after the addition of reagent to eliminate interference due to slight absorbance of GNRs near 490 nm.
In order to further investigate oxidative stress as a mechanism of cytotoxicity, the reactive oxygen species (ROS) assay was performed using the BD Pathway Confocal Microscope, which collects images
and corresponding fluorescence intensity data. The generation of ROS was probed with the Image IT Live Green ROS detection kit (Molecular Probe, Invitrogen, Carlsbad, CA). This assay is based on a fluorescent marker for ROS in live cells (5-carboxy-2’,7’-dichlorodihydrofluoresceine diacetate; carboxy-H2DCFDA). The oxidation product of carboxy-H2DCFDA has excitation/emission maxima of approximately 495/529 nm. As a positive control, 0.03% of hydrogen peroxide was added for 1 h to induce cellular apoptosis. After incubation, the cells were washed with warm PBS, then the monolayers were covered with the working solutions (carboxy-H2DCFDA for ROS staining: 25 μM; Hoechst solution for nuclear staining: 1 μM). The cells were incubated at 37°C for 30 minutes, protected from light to avoid bleaching of the fluorophores. After rinsing with PBS, the cells were observed with DAPI and Fluorescein/FITC filters and fluorescence intensity for each was quantified. The results were presented in the form of fold change in fluorescence intensity of FITC/DAPI from control.
For each biochemical assay, three trials were performed for each sample with a value of n=3 per trial for a total of 9 data points for each sample. Statistical significance from the control was determined for biochemical data using a two tailed t-test in Excel with p<0.05.
Cell Morphology and Uptake
The interaction of GNR-MHDA and GNR-PEG cells was determined using DF imaging and transmission electron microscopy (TEM). For DF imaging, cells were plated in 2-chambered slides (surface area = 4 cm2
) at a concentration of 1.0 x 10⁵
cells/cm2
and allowed to proliferate and adhere for 24-48 h or until ~80% confluent. For DF imaging experiments with GNR-MHDA and GNR-PEG, cells were dosed with GNRs diluted in EM at a concentration of 10 µg/mL and exposed for 24 h. Following exposure, cells were washed with PBS and fixed in 4% paraformaldehyde for 10 minutes. The cells were washed again with PBS, a coverslip was added and sealed with clear nail polish, and the slide was imaged using the CytoViva Hyperspectral Imaging System attached to an Olympus BX41 microscope (Aetos Technologies, Inc., Auburn, AL). Data was collected using ENVI software.
For TEM imaging, cells were seeded at a concentration of 1.0 x 10⁵
cells/cm2
in 6-well plates (surface area = 9.6 cm2
) and allowed to adhere and proliferate for 48 h. Cells were dosed with GNRs diluted in EM at a concentration of 50 µg/mL and exposed for 24 h. At the completion of the exposure period, cells were washed with PBS, trypsinized from the plate, and centrifuged at 1000xg for 10 minutes. The pellet was fixed in 2% paraformaldehyde overnight at 4°C. The following day, the cell pellets were washed with PBS, stained with 4% osmium tetroxide, and dehydrated with ethanol in a standard dilution sequence. The final pellet was cured in a vacuum oven using LR White resin (EMS) at 60°C. The cured sample was sectioned using a Leica EM UC6 Ultramicrotome and imaged using a Hitachi H-7600 TEM at the University of Dayton.
Gene Expression Analysis
Real-time Reverse Transcription Polymerase Chain Reaction (RT-PCR) was used to determine the effect of GNR-MHDA and GNR-PEG exposure on HaCaT cells at non-toxic doses (50 µg/mL). Cells were seeded and exposed to GNRs as described for TEM imaging (1x10⁵
cells/cm2
in 9.6 cm2
/well = ~1x10⁶
cells/trial). After 24 h exposure, RNA was isolated from the cells using a RNA Isolation Kit from Qiagen. The RNA yield was determined using the NanoDrop Spectrophotometer (ThermoScientific). Following RNA isolation, c-DNA was prepared using the RT2 First Strand kit (SABiosciences) according to manufacturer’s instructions. The Stress and Toxicity Array (SABiosciences) was used to evaluate the expression of 84 genes related to stress and toxicity production in human cells. Expression of genes that are directly regulated by oxidative or metabolic stress and heat shock, as well as genes which are representative of pathways activated by prolonged stress, such as apoptosis and senescence are among those evaluated in this array. Three trials were performed for each sample (control, GNR-MHDA, and GNR-PEG).
Data was analyzed based on average threshold cycles (Ct), which is equal to the cycle number at which fluorescence generated crosses the fluorescence threshold. The Ct values were normalized by subtracting the Ct for each gene of interest (GOI) by the arithmetic average of Ct values for a set of 5
housekeeping (HKG) genes (Ct(GOI)-Ct(HKG) = ΔCt). The resulting ΔCt values were averaged for triplicate trials for each test sample (GNR-MHDA and GNR-PEG). The averaged ΔCt values were further manipulated by a factor to relate Ct to gene expression (2-ΔCt
). Fold regulation was determined by dividing 2-ΔCt
value for each test sample by the 2-ΔCt
value for the negative control sample and taking the negative inverse for values less than 1.00. A heat map for each GNR sample is shown in Figure 5 based on fold regulation.
Genes that were significantly different for GNRs versus the negative control were determined by a Student’s t-test comparing the ΔCt values for the triplicate trials for each test sample compared to the ΔCt values for the negative control. Genes with p<0.05 are shown in Table 3.
ACKNOWLEDGMENT. This work was partially funded by the NSF (DMR # 0906838). Ms. Grabinski received funding from the Oak Ridge Institute for Science and Education.
REFERENCES
1. Huang, X.; El-Sayed, I. H.; Qian, W.; El-Sayed, M. A. Cancer Cell Imaging and Photothermal Therapy in the Near-Infrared Region by Using Gold Nanorods. J. Am. Chem. Soc. 2006, 128, 2115-2120.
2. Wijaya, A.; Schaffer, S. B.; Pallares, I. G.; Hamad-Schifferli, K. Selective release of multiple DNA oligonucleotides from gold nanorods ACS Nano 2009, 3, 80-86.
3. Chen, C.-C.; Lin, Y.-P.; Wang, C.-W.; Tzeng, H.-C.; Wu, C.-H.; Chen, Y.-C.; Chen, C.-P.; Chen, L.-C.; Wu, Y.-C. DNA-gold nanorod conjugates for remote control of localized gene expression by near infrared irradiation. J. Am. Chem. Soc. 2006, 128, 3709-3715.
4. Agarwal, A.; Huang, S. W.; O'Donnell, M.; Day, K. C.; Day, M.; Kotov, N.; Ashkenazi, S. Targeted gold nanorod contrast agent for prostate cancer detection by photoacoustic imaging. J. Appl.
Phys. 2007, 102, 064701-4.
5. Lee, S. E.; Sasaki, D. Y.; Perroud, T. D.; Yoo, D.; Patel, K. D.; Lee, L. P. Biologically functional cationic phospholipid−gold nanoplasmonic carriers of RNA. J. Am. Chem. Soc. 2009, 131, 14066–14074.
6. Murphy, C. J.; Gole, A. M.; Stone, J. W.; Sisco, P. N.; Alkilany, A. M.; Goldsmith, E. C.; Baxter, S. C. Gold Nanoparticles in Biology: Beyond Toxicity to Cellular Imaging. Acc. Chem. Res. 2008, 41, 1721-1730.
7. Lewinski, N.; Colvin, V.; Drezek, R. Cytotoxicity of Nanoparticles. Small 2008, 4, 26-49.
8. Hussain, S. M.; Braydich-Stolle, L. K.; Schrand, A. M.; Murdock, R. C.; Yu, K. O.; Mattie, D. M.; Schlager, J. J.; Terrones, M. Toxicity Evaluation for Safe Use of Nanomaterials: Recent Achievements and Technical Challenges. Adv. Mater. 2009, 21, 1549-1559.
9. Carlson, C.; Hussain, S. M.; Schrand, A. M.; K. Braydich-Stolle, L.; Hess, K. L.; Jones, R. L.; Schlager, J. J. Unique Cellular Interaction of Silver Nanoparticles: Size-Dependent Generation of Reactive Oxygen Species. J. Phys. Chem. B 2008, 112, 13608-13619.
10. Niidome, T.; Yamagata, M.; Okamoto, Y.; Akiyama, Y.; Takahashi, H.; Kawano, T.; Katayama, Y.; Niidome, Y. PEG-modified gold nanorods with a stealth character for in vivo applications. J.
Controlled Release 2006, 114, 343-347.
11. Huff, T. B.; Hansen, M. N.; Zhao, Y.; Cheng, J.-X.; Wei, A. Controlling the Cellular Uptake of Gold Nanorods. Langmuir 2007, 23, 1596–1599.
12. Chithrani, B. D.; Ghazani, A. A.; Chan, W. C. W. Determining the Size and Shape Dependence of Gold Nanoparticle Uptake into Mammalian Cells. Nano Lett. 2006, 6, 662-668.
13. Alkilany, A. M.; Nagaria, P. K.; Hexel, C. R.; Shaw, T. J.; Murphy, C. J.; Wyatt, M. D. Cellular Uptake and Cytotoxicity of Gold Nanorods: Molecular Origin of Cytotoxicity and Surface Effects.
Small 2009, 5, 701-708.
14. Hauck, T.; Ghazani, A.; Chan, W. Assessing the Effect of Surface Chemistry on Gold Nanorod Uptake, Toxicity, and Gene Expression in Mammalian Cells. Small 2008, 4, 153-159.
15. Manohar, S.; Rayavarapu, R.; Petersen, W.; van Leeuwen, T. G. Cell viability studies of PEG-thiol treated gold nanorods as optoacoustic contrast agents. SPIE Proc. 2009, 7177.
16. Smith, D. K.; Korgel, B. A. The Importance of the CTAB Surfactant on the Colloidal Seed-Mediated Synthesis of Gold Nanorods. Langmuir 2008, 24, 644-649.
17. Parab, H. J.; Chen, H. M.; Lai, T.-C.; Huang, J. H.; Chen, P. H.; Liu, R.-S.; Hsiao, M.; Chen, C.-H.; Tsai, D.-P.; Hwu, Y.-K. Biosensing, Cytotoxicity, and Cellular Uptake Studies of Surface-Modified Gold Nanorods. J. Phys. Chem. C 2009, 113, 7574-7578.
18. Leonov, A. P.; Zheng, J.; Clogston, J. D.; Stern, S. T.; Patri, A. K.; Wei, A. Detoxification of Gold Nanorods by Treatment with Polystyrenesulfonate. ACS Nano 2008, 2, 2481-2488.
19. Goodman, C. M.; McCusker, C. D.; Yilmaz, T.; Rotello, V. M. Toxicity of Gold Nanoparticles Functionalized with Cationic and Anionic Side Chains. Bioconjugate Chem. 2004, 15, 897-900.
20. Connor, E. E.; Mwamuka, J.; Gole, A.; Murphy, C. J.; Wyatt, M. D. Gold Nanoparticles Are Taken Up by Human Cells but Do Not Cause Acute Cytotoxicity. Small 2005, 1, 325-327.
21. Lynch, I.; Cedervall, T.; Lundqvist, M.; Cabaleiro-Lago, C.; Linse, S.; Dawson, K. A. The nanoparticle-protein complex as a biological entity; a complex fluids and surface science challenge for the 21st century. Adv. Colloid Interfac. 2007, 134-135, 167-174.
22. Barnes, C. A.; Elsaesser, A.; Arkusz, J.; Smok, A.; Palus, J.; Lesniak, A.; Salvati, A.; Hanrahan, J. P.; Jong, W. H. d.; Dziubaltowska, E., et al. Reproducible Comet Assay of Amorphous Silica Nanoparticles Detects No Genotoxicity. Nano Lett. 2008, 8, 3069-3074.
23. Bartneck, M.; Keul, H. A.; Singh, S.; Czaja, K.; Bornemann, J.; Bockstaller, M.; Moeller, M.; Zwadlo-Klarwasser, G.; Groll, J. Rapid Uptake of Gold Nanorods by Primary Human Blood Phagocytes and Immunomodulatory Effects of Surface Chemistry. ACS Nano 2010, 4, 3073-3086.
24. Pan, Y.; Leifert, A.; Ruau, D.; Neuss, S.; Bornemann, J.; Schmid, G.; Brandau, W.; Simon, U.; Jahnen-Dechent, W. Gold Nanoparticles of Diameter 1.4 nm Trigger Necrosis by Oxidative Stress and Mitochondrial Damage. Small 2009, 5, 2067-2076.
25. Balasubramanian, S. K.; Jittiwat, J.; Manikandan, J.; Ong, C.-N.; Yu, L. E.; Ong, W.-Y. Biodistribution of gold nanoparticles and gene expression changes in the liver and spleen after intravenous administration in rats. Biomaterials 2010, 31, 2034-2042.
26. Arikawa, E.; Pan, H.; Sun, Y.; Wang, J.; Zhou, Q.; Prabhakar, S.; Wang, Y. B.; Dial, S.; Ning, B.; Guo, L., et al. P53-M Real-Time PCR Array for Multi-Gene Expression Profiling and Microarray Data Validation: RT2 Profiler PCR Array. J. Biomol. Tech. 2007, 18, 18-19.
27. Wijaya, A.; Hamad-Schifferli, K. Ligand customization and DNA functionalization of gold nanorods via roundtrip phase transfer ligand exchange. Langmuir 2008, 24, 9966-9969.
28. Sau, T. K.; Murphy, C. J. Seeded high yield synthesis of short Au nanorods in aqueous solution.
Langmuir 2004, 20, 6414-6420.
29. Phenrat, T.; Long, T. C.; Lowry, G. V.; Veronesi, B. Partial Oxidation ("Aging") and Surface Modification Decrease the Toxicity of Nanosized Zerovalent Iron. Environ. Sci. Technol. 2008, 43, 195-200.
30. Wei, Q.; Song, H.-M.; Leonov, A. P.; Hale, J. A.; Oh, D.; Ong, Q. K.; Ritchie, K.; Wei, A. Gyromagnetic Imaging: Dynamic Optical Contrast Using Gold Nanostars with Magnetic Cores. J. Am.
Chem. Soc. 2009, 131, 9728-9734.
31. Di Virgilio, A. L.; Reigosa, M.; de Mele, M. F. L. Response of UMR 106 cells exposed to titanium oxide and aluminum oxide nanoparticles. J. Biomed. Mater. Res. A 2009, 92A, 80-86.
32. Shukla, R.; Bansal, V.; Chaudhary, M.; Basu, A.; Bhonde, R. R.; Sastry, M. Biocompatibility of Gold Nanoparticles and Their Endocytotic Fate Inside the Cellular Compartment: A Microscopic Overview. Langmuir 2005, 21, 10644-10654.
33. Teeguarden, J. G.; Hinderliter, P. M.; Orr, G.; Thrall, B. D.; Pounds, J. G. Particokinetics In
Vitro: Dosimetry Considerations for In Vitro Nanoparticle Toxicity Assessments Toxicol. Sci. 2007, 95,
300-312.
34. Feng, Q.; Li, P.; Salamanca, C.; Huntsman, D.; Leung, P. C. K.; Auersperg, N. Caspase-1α Is Down-regulated in Human Ovarian Cancer Cells and the Overexpression of Caspase-1α ± Induces Apoptosis. Cancer Res. 2005, 65, 8591-8596.
35. Peng, G.; Lin., S.-Y. Exploiting the homologous recombination DNA repair network for targeted cancer therapy. World J. Clin. Oncol. 2011, 2, 73-79.
36. Higashi, H.; Vallböhmer, D.; Warnecke-Eberz, U.; Hokita, S.; Xi, H.; Brabender, J.; Metzger, R.; Baldus, S. E.; Natsugoe, S.; Aikou, T., et al. Down-regulation of Gadd45 Expression is associated with Tumor Differentiation in Non-small Cell Lung Cancer. Anticancer Res. 2006, 26, 2143-2147. 37. Brychzy, A.; Rein, T.; Winklhofer, K. F.; Hartl, F. U.; Young, J. C.; Obermann, W. M. J. Cofactor Tpr2 combines two TPR domains and a J domain to regulate the Hsp70/Hsp90 chaperone system. EMBO J 2003, 22, 3613-3623.
38. Jolly, C.; Morimoto, R. I. Role of the Heat Shock Response and Molecular Chaperones in Oncogenesis and Cell Death. J. Natl. Cancer I. 2000, 92, 1564-1572.
39. Bankers-Fulbright, J. L.; Kalli, K. R.; McKean, D. J. Interleukin-1 signal transduction. Life Sci. 1996, 59, 61-83.
40. Providence, K.; Higgins, S.; Mullen, A.; Battista, A.; Samarakoon, R.; Higgins, C.; Wilkins-Port, C.; Higgins, P. SERPINE1 (PAI-1) is deposited into keratinocyte migration “trails” and required for optimal monolayer wound repair. Arch. Dermatol. Res. 2008, 300, 303-310.
41. Tambini, C. E.; Spink, K. G.; Ross, C. J.; Hill, M. A.; Thacker, J. The importance of XRCC2 in RAD51-related DNA damage repair. DNA Repair 2010, 9, 517-525.
42. Takahashi, H.; Tsuji, H.; Hashimoto, Y.; Ishida-Yamamoto, A.; Iizuka, H. Cell proliferation and cytokine induction by TNF-α of psoriatic keratinocytes are not different from normal keratinocytes in vitro. Indian J. Dermatol. 2009, 54, 237-239.
43. Mizutani, H.; Black, R.; Kupper, T. S. Human keratinocytes produce but do not process pro-interleukin-1 (IL-1) beta. Different strategies of IL-1 production and processing in monocytes and keratinocytes. J. Clin. Invest. 1991, 87, 1066-1071.
44. Chen, G.; Goeddel, D. V. TNF-R1 Signaling: A Beautiful Pathway. Science 2002, 296, 1634-1635.
45. Bhabra, G.; Sood, A.; Fisher, B.; Cartwright, L.; Saunders, M.; Evans, W. H.; Surprenant, A.; Lopez-Castejon, G.; Mann, S.; Davis, S. A., et al. Nanoparticles can cause DNA damage across a cellular barrier. Nat. Nanotechnol. 2009, 4, 876-883.
46. Duncan, K. E.; Ghio, A. J.; Dailey, L. A.; Bern, A. M.; Gibbs-Flournoy, E. A.; Padilla-Carlin, D. J.; Roggli, V. L.; Devlin, R. B. Effect of Size Fractionation on the Toxicity of Amosite and Libby Amphibole Asbestos. Toxicol. Sci. 2010, 118, 420-434.
47. Cedervall, T.; Lynch, I.; Lindman, S.; Thulin, T. B. E.; Nilsson, H.; Dawson, K. A.; Linse, S. Understanding the nanoparticle–protein corona using methods to quantify exchange rates and affinities of proteins for nanoparticles. Proc. Nat. Acad. Sci. 2007, 104, 2050–2055.
48. Abramoff, M. D.; Magelhaes, P. J.; Ram, S. J. Image Processing with ImageJ. Biophotonics Int. 2004, 11, 36-42.
SYNOPSIS TOC