Improvement of meal composition by vegetable variety
Tamara Bucher*, Klazine van der Horst and Michael Siegrist
ETH Zu¨rich, Institute for Environmental Decisions, Consumer Behavior, Universitaetstrasse 22, CHN J 78, CH-8092 Zurich, Switzerland
Submitted 9 August 2010: Accepted 28 February 2011: First published online 4 May 2011
Abstract
Objective: Our physical environment influences our daily food choices uncon-sciously. Strategic changes in the food environment might therefore be potential measures to influence consumers’ food selection towards better nutrition, without affecting the consumers’ freedom of choice. The present study aimed to examine whether increased vegetable variety enhances healthy food choices and improves meal composition.
Design: A randomised experiment.
Setting: Participants were instructed to serve themselves a lunch from a buffet of food replicas. Individuals were randomly assigned to one of three food combinations: condition A – cooked carrots, pasta and chicken; condition B – cooked green garden beans, pasta and chicken; condition AB – carrot sticks, green garden beans, pasta and chicken. Two one-vegetable conditions were compared with one two-vegetable condition. Data from Zurich, Switzerland, were analysed using one-way ANOVA. Subjects: Ninety-eight students (fifty-three men; mean age 22?8 (SD 2?2) years,
minimum 5 19 years, maximum 5 29 years).
Results: Participants who could choose from two vegetables derived significantly more energy (141 kJ) from vegetables compared with participants in the one-vegetable condition (104 and 84 kJ, respectively). Furthermore, in the two-one-vegetable condition, the relative energy of the meal derived from vegetables (10?9 %) increased significantly compared with the one-vegetable condition (8 % and 6?1 %, respec-tively). The total energy content of the meal (mean 1472 (SD468) kJ) was not affected
by the experimental manipulation.
Conclusions: Having a choice of vegetables increases a person’s tendency to choose vegetables and leads to the selection of a more balanced meal. Serving an assortment of vegetables as side dishes might be a simple and effective strategy to improve food selection.
Keywords Vegetable variety Meal composition Environmental influences
A balanced diet means eating a variety of foods in healthy proportions. A healthy balanced diet should be based on fruit, vegetables and whole foods high in nutrients(1–3). Consuming an unbalanced diet can cause weight gain and poor health(4,5), whereas consumption of high amounts of fruit and vegetables has been suggested as a potential dietary strategy for optimizing health(6). A diet rich in fruit and vegetables has been shown to reduce the risk of cancer(7) and CVD(8), improve bone health(9,10) and reduce age-related cognitive decline(11). Such a diet may even result in weight loss(12,13). To increase people’s fruit and vegetable intakes, it is important to understand the factors influencing human food choice and meal composition. Previous research has shown that, in addi-tion to psychological factors such as cogniaddi-tion and social influences(14), environmental factors affect food choice(15–17). Therefore, changes in the food environment, such as increasing the availability of healthy foods, are potential measures to influence consumers’ food selection towards
better nutrition without affecting consumers’ freedom of choice. Environmental measures within public eating areas are of importance, as modern living has led to an increase in the frequency and variety of meals and snacks consumed away from home(18,19).
To classify environmental influences on food choice, Herman and Polivy(20)introduced the distinction between normative and external (sensory) cues. Although sensory cues refer to the hedonic appeal of the food (e.g. palat-ability and odour), normative cues refer to indicators of appropriate intake, such as portion sizes. The authors argue that sensory cues are especially powerful for certain groups, such as obese or dieting/restrainted individuals, whereas normative cues exert control over food selec-tion for all. It was shown that the variety of foods pre-sented(21), portion sizes(22), the plate size, or even the number of peers at the table can influence consumption(16). Although several studies have shown how these cues can cause overconsumption and poor nutrition(22–24), little is
known about implementation of this knowledge to actually improve consumers’ food choice(25,26).
In the present study, the focus lies in how variety might be strategically used to improve meal composition. In general, variety in a meal is thought to enhance food intake(21). Consumers offered an assortment of three different flavours of yoghurt consumed on average 23 % more than when offered only one flavour(27). Kahn and Wansink(23) have shown that people eat more candies if they come in more colours. Therefore, it does not matter whether the variety is real (e.g. food tastes very different) or just perceived (e.g. food structures differ, but tastes are identical). Both increase the quantities consumed. The effect of variety on food consumption is commonly explained by a reduction of sensory-specific satiety. Sensory-specific satiety refers to the finding that as a food is eaten its palatability gradually declines. Greater variety is assumed to overcome sensory-specific satiety and therefore lead to increased food intake. The variety effect might have been advantageous during human evolution, as a varied diet is more likely to cover all essential nutrients. In today’s affluent society, though, the effect has rather become a threat to human health.
Past studies have mainly focused on single foods instead of examining the influence of a variety in healthy foods on consumers’ meal composition. The focus of the present study lies in variety as a modifiable normative cue to improve consumers’ food choice. The hypothesis is that by increasing the variety of healthy foods, namely vege-tables, consumers can be manipulated towards a healthier and more balanced diet. This might be explained by the so-called 1/N equality heuristic, suggested by DeMiguel et al.(28). The heuristic originates in economics and addresses the question of how money is invested in N assets. It states the tendency of people to allocate money equally to each of N funds. Similarly, people might allo-cate the limited space on a serving plate equally to dif-ferent foods offered. If this hypothesis is true for food choice, people offered more vegetables should not only just choose more vegetables but should also improve the composition of the overall meal. In summary, we expect participants with a wider choice of vegetables to choose a higher proportion of vegetables and reduce the selection of other foods at the same time.
Methods
To accurately investigate the influence of vegetable availability on serving amounts and meal composition, a fake food buffet (FFB) was used. A buffet of food replicas cast from polyvinylchloride (Do¨ring GmbH, Munich, Germany) was prepared. Four foods commonly eaten for a warm meal in Switzerland were selected: carrots (vegetable A), green beans (vegetable B), pasta and fried skinless chicken breast. All items were placed in
aluminium serving dishes to remind students of the local university cafeteria.
Subjects
An invitation to participate in the experiment was sent to the subject pool of the University of Zu¨rich. Students taking classes in Nutrition Science, following a medically prescribed diet or following a vegetarian diet were excluded from study participation. Individuals aged .30 years were also excluded from the experiment, as age is a potential modifier of the effect of variety(21). Ninety-eight individuals (fifty-three men and forty-five women) com-pleted the experiment.
Experimental procedure
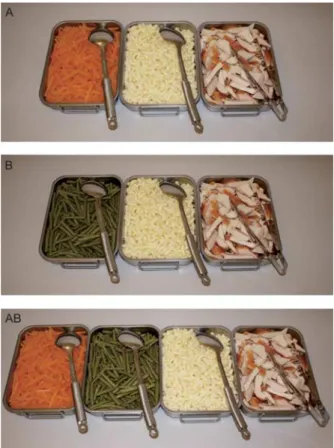
Each participant was randomly assigned to one of three replica food selections. The buffet for group 1 (n 29, seventeen men) consisted of cooked carrots, pasta and chicken (condition A). Group 2 (n 35, nineteen men) could serve themselves beans, pasta and chicken (condition B) and group 3 (n 34, seventeen men) had both vegetables in addition to pasta and chicken (condition AB; Fig. 1). Parti-cipants were provided with a standard serving plate (27 cm diameter) and asked to serve themselves a meal such as they would normally eat for lunch from the presented
Fig. 1 Experimental conditions: condition A – carrots were offered along with pasta and chicken; condition B – beans were offered along with pasta and chicken; condition AB – both vegetables were offered in addition to chicken and pasta
selection. After serving, the participants filled out a food questionnaire. Meanwhile, the investigator quantified each food component of the meal by weighing it (Shimadzu UW6200H; Swiss Waagen DC GmbH, Uster, Switzerland). Students were compensated with CHF 15 ($US 15) for participation. Subsequent to study completion, participants were informed about the study aim. Data were collected and analysed in Zu¨rich in 2010.
Calculation of the theoretical energy content of replica food items
To estimate the theoretical energy content of the replica foods, corresponding real foods were prepared and weight was measured (for comparison of real and replica food, see Fig. 2).
Carrots
Carrots (vegetable A) were chopped into pieces comparable to the replica carrots. Equal volumes of replica carrots and real carrots were selected. The weight of real and replica carrots was measured and a factor was calculated. This procedure was repeated three times. The average conver-sion factor was used for energy estimation of 100 g of replica
carrots. The conversion factor from carrots to replica carrots was 1?10 (SD 0?06); therefore, 100 g of replica
carrots had a theoretical energy content of 149 kJ (fresh carrots (100 g) 5 135 kJ(29)).
Beans
Green garden beans (vegetable B) were chopped into pieces comparable to the replica beans. Forty replica beans and forty real beans were selected randomly. The weight of real and replica beans was measured and a factor was calculated. This procedure was repeated three times. The average conversion factor from beans to replica beans was 0?73 (SD 0?01); therefore, 100 g of replica beans had
a theoretical energy content of 75 kJ (fresh beans (100 g) 5 103 kJ(29)).
Pasta
A type of pasta was selected that looked similar in size and shape to the replica pasta after cooking. Forty pieces of real pasta and forty pieces of replica pasta were selected randomly. The weight of the real and replica pasta was measured and the conversion factor was calculated. The procedure was repeated three times. The average
Fig. 2 Food replicas and real foods in comparison: (a) raw beans (lower panel) and replica beans (upper panel); (b) raw carrots (lower panel) and replica carrot sticks (upper panel); (c) cooked pasta (right) and replica pasta (left); and (d) fried chicken breast (upper panel) and replica chicken (lower panel)
conversion factor from real pasta to replica pasta was 0?30 (SD0?01); therefore, 100 g of replica pasta corresponded
to 455 kJ (egg pasta (100 g) 5 1498 kJ(29)). Chicken
Chicken breast was flavoured and subsequently fried in a pan. The weight of the raw and fried meat was measured, as well as the frying oil remaining on the chicken. The chicken breasts were then chopped into pieces similar to the replica food. Six similarly shaped pieces of real and replica meat were selected and measured to calculate a conversion factor. The procedure was repeated three times. The average conversion factor from fried chicken breast to replica chicken breast was 0?98 (SD0?03);
there-fore, 100 g of replica chicken corresponded to 636 kJ (fried chicken breast (100 g) 5 456 kJ(29)). Note that, for chicken, the oil remaining on the meat after frying was taken into account, whereas for all other food items no addition of fat was assumed.
Measures
The first outcome variable ‘total energy from vegetable’ was measured by weighing the replica vegetables that were served. The weights of the replica vegetables were multiplied by the conversion factors and summed up to compute the theoretical energy content from the vege-tables served. Similarly, the second outcome variable ‘total energy meal’ was established by weighing all food items. The weight of the individual food items was mul-tiplied by the corresponding conversion factor and added up to compute the theoretical energy content of the meal. The third outcome variable ‘percentage energy from vegetables’ was determined by computing the relative energy served from vegetables compared with the total energy served. The inverse variable, percentage energy from non-vegetables, was calculated in the same way.
After the participants served themselves a meal, they provided self-reported height, weight and age measures. These measures were used to calculate their BMI (weight in kilograms divided by the square of height in metres (kg/m2)) and daily energy requirement (weight multi-plied by energy per kilogram body weight factor, which depends on age and gender(30)). Note that calculated energy requirements might be lower than true energy requirements, as there is a general tendency to under-report weight and over-under-report height(31). The students completed questions about their levels of hunger, food-frequency questions on offered food items and questions on food preferences and the authenticity of the replica foods. Hunger was assessed with the question ‘How hungry are you right now?’ on a 6-point scale (1 5 not hungry at all; 6 5 very hungry). Food preferences were assessed with the question ‘How much do you like the following food items?’ on a 6-point scale (1 5 I do not like it at all; 6 5 I like it very much). The authenticity of the replica foods was measured with the question ‘How
realistic were the following replica foods?’ on another 6-point scale (1 5 not realistic at all; 6 5 very realistic). Statistical analysis
Data were analysed using the Predictive Analytics Software (PASW; formerly known as SPSS) statistical software pack-age version 18?0 (SPSS Inc., Chicago, IL, USA). To assess whether the three study conditions were successfully ran-domized by age, BMI, hunger and food preference, one-way ANOVA was performed. Three assessments using univariate ANOVA were conducted to determine whether the buffet conditions were associated with the three out-come variables, and the effect sizes (h2) are reported. Gender 3 condition interactions were analysed using two-way ANOVA. In case of a significant omnibus F test, plan-ned group comparisons were made using the Bonferroni correction. Mean differences (D) and SE are reported. All
tests are based on a 0?05 significance level.
Results
A total of ninety-eight individuals participated in the pre-sent study, of whom 45?9 % were female (n 45) and 54?1 % were male (n 53). One-way ANOVA did not detect any significant differences between the experimental groups in terms of age (22?8 (SD 2?25) years), BMI (22?0 (SD 2?5)
kg/m2) or hunger levels (2?9 (SD1?3); Table 1). There was
a slight difference in food preference for carrots (vegetable A) between the groups. Participants who were not pre-sented any carrots stated liking them slightly more than participants who could actually serve themselves carrots. The effect, however, was negligible (F(2, 95)53?14,
P 5 0?048, h250?062). High mean ratings for the authenti-city of replica food items give an indication of the usefulness of replica foods (carrots: 4?43 (SD 1?06); beans: 4?34
(SD1?18); chicken: 3?33 (SD1?54); pasta: 4?61 (SD1?18)).
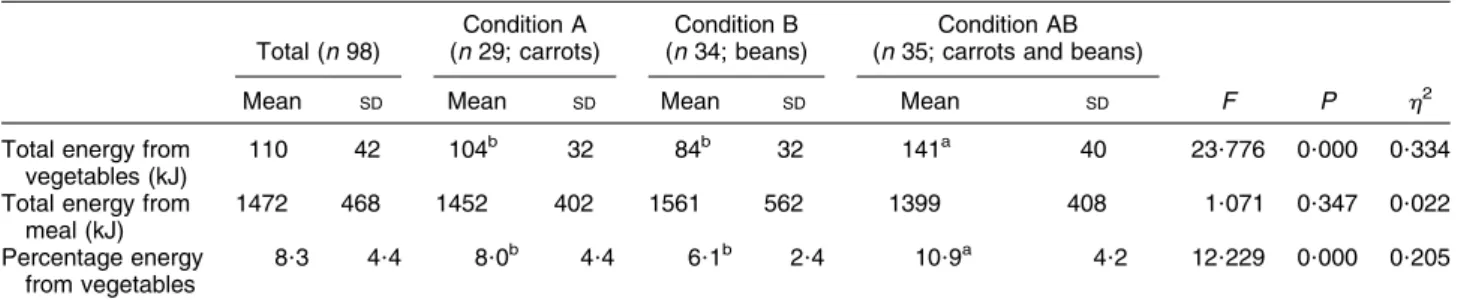
To test whether vegetable variety affects the total energy from vegetables (kJ), the means of the energy derived from vegetables were compared between experimental groups (Table 2). ANOVA revealed a significant main effect of vegetable variety (F(2, 95)523?776, P 5 0?000, h250?334)
on the total energy derived from vegetables. The energy derived from vegetables increased significantly when two vegetables were offered instead of only one. Planned contrasts with Bonferroni’s correction showed statistically significant differences between condition AB (carrots and beans) and conditions A (carrots only; D 5 8?87, SE
2?11, P 5 0?000) and B (beans only; D 5 13?71, SE 2?11,
P 5 0?000). To exclude interactions of gender with experi-mental conditions, a two-way ANOVA was performed. No significant interaction was found (F(2, 92)50?047,
P 5 0?954, h250?001).
A significant main effect of vegetable variety on the percentage energy from vegetables was found (F(2, 95)5
from vegetables was significantly higher in condition AB
compared with conditions A (D 5 2?83 %, SE 1?01,
P 5 0?018) and B (D 5 4?74 %, SE 0?96, P 5 0?000). No
significant interaction of the experimental condition with gender was found (F(2, 92)50?335, P 5 0?716, h250?007).
Few people in the AB condition chose only one vegetable (n 2, 5?9 %). We can therefore rule out that people offered two vegetables served themselves more vege-tables because they had a better chance of finding their favourite vegetable.
Further, the variety of vegetables presented did not influence the total energy of the meal (F(2, 95)51?071,
P 5 0?347, h250?022). There are, however, significant dif-ferences in total energy (kJ) served between genders. Men (mean 5 1699 (SE66) kJ) served themselves on
aver-age 494 kJ more compared with women (mean 5 1205 (SE 40) kJ; t(96)56?11, P 5 0?000, r 5 0?42). The total
amount of energy served from the buffet correlated with the individual daily energy requirement (r 5 0?35, P 5 0?000).
Discussion
The present study shows that, by increasing the vegetable variety, consumers’ food selection can successfully be influenced towards a healthier food choice. An increase in vegetable variety results in a change in meal composition.
Giving participants one additional vegetable to choose from increases the total as well as the relative energy served from vegetables. In contrast, the relative energy derived from non-vegetables (e.g. pasta and chicken) is significantly decreased. This indicates that participants chose a more balanced meal containing a higher pro-portion of vegetables.
Interestingly, the increase in the variety of vegetables did not affect the total energy served, even though the variety effect is in general known to increase consump-tion(21). This finding might be explained by limiting plate
space. The plate restricts the maximal amount of food that can be served. Even though more food items are served once variety increases, plate space is limited at one point. Here, relative energy differences between food items are suspected to play a role. Foods relatively low in energy were chosen for the experiment. It is possible that, by substituting the relatively low-energy-dense chicken and pasta with foods higher in energy density, such as pork and fries, the total energy of the meal might even be reduced when two vegetables are offered instead of one. For the variety effect within a meal, however, it seems important to identify in which food items variety lies. If there is a wider variety of low-energy-dense foods, such as vegetables, the total energy of the meal does not necessarily increase. On the contrary, it might even be strategically used to reduce energy intake.
Table 1 Differences in background and demographic variables of participants in the three experimental conditions (one-way ANOVA) Total (n 98) Condition A (n 29; carrots) Condition B (n 34; beans) Condition AB (n 35; carrots and beans)
Mean SD Mean SD Mean SD Mean SD P h2
Age (years; range: 19–29) 22?80 2?25 23?07 2?62 22?37 2?14 23?00 2?00 0?380 0?020 BMI (kg/m2; range: 17?2–30?0)* 21?98 2?51 22?00 2?96 21?53 2?29 22?42 2?29 0?343 0?023
Hunger level (range: 1–6)- 2?91 1?29 2?79 1?32 2?80 1?13 3?12 1?41 0?505 0?014 Food preference (range: 1–6)-
-Vegetable A 4?81 1?32 4?31 4?31 5?09 1?20 4?94 1?30 0?048 0?062
Vegetable B 4?79 1?28 4?55 1?30 4?69 1?32 5?09 1?19 0?215 0?032
Pasta 5?16 0?95 5?21 1?05 5?17 0?86 5?12 0?98 0?933 0?001
Chicken 5?17 1?06 5?21 1?25 5?11 1?02 5?21 0?98 0?920 0?002
Vegetable A, cooked carrots; vegetable B, cooked beans.
*One individual refused to state her weight. Total n for BMI is therefore 97.
-Hunger levels were measured on a 6-point scale (1 5 not hungry at all; 6 5 very hungry). --Food preference was measured on a 6-point scale (1 5 I do not like it at all; 6 5 I like it very much).
Table 2 Differences in meal composition depending on the experimental conditions (one-way ANOVA)
Total (n 98) Condition A (n 29; carrots) Condition B (n 34; beans) Condition AB (n 35; carrots and beans)
Mean SD Mean SD Mean SD Mean SD F P h2
Total energy from vegetables (kJ)
110 42 104b 32 84b 32 141a 40 23?776 0?000 0?334
Total energy from meal (kJ) 1472 468 1452 402 1561 562 1399 408 1?071 0?347 0?022 Percentage energy from vegetables 8?3 4?4 8?0b 4?4 6?1b 2?4 10?9a 4?2 12?229 0?000 0?205 a,b
The limited plate space forced participants to decide which foods to serve and in what quantity. We assume that participants allocate the available space of the plate equally to chosen food items, which might be explained by the 1/N equality heuristic. People may also be likely to allocate space on the plate equally to N food items. We name this observed tendency the ‘plate space equality heuristic’. Future studies should quantify the relationship between the number of foods offered and the plate space available. It would also be of interest to know how pre-ferences and aversions influence plate space allocation.
Even though the food replicas were of outstanding quality, the foods were fake. However, we found high correlations between the served amounts of replica foods from an FFB and those from a buffet of corresponding real foods (T Bucher, K van der Horst and M Siegrist, unpublished results). Using replica food has numerous advantages over real food. Most important, the replicas
allow studying food choice under well-controlled
laboratory conditions and each individually tested parti-cipant finds an identical food buffet. A limitation of using replica foods might be that the served theoretical energy may not be identical to the consumed energy from an identical buffet of real foods. In a real-life situation, parts of meals might be left over or a second serving eaten(32). It is known from previous research, however, that people tend to empty their plates(16) and take single portions as units for consumption, rather than compensating by eating more portions(33). No sauces were offered along with the replica food items, and minimal fat was assumed for meal preparation and calculation of weight factors. A meal from replica foods might therefore seem lower in energy when compared with the same meal composed from real foods. The study population included students only and hence may not represent the general population.
To verify whether participants behaved naturally in the experiment, gender differences in total energy served were quantified. It was found that women served themselves less energy-dense food compared with men. In addition, the energy served correlated with the actual personal energy requirement. In addition, students rated the appearance of the replica food items as very realistic. Altogether, these findings indicate that participants behaved naturally when serving themselves the replica food.
Eating a balanced diet high in fruit and vegetables is common advice for maintaining good health. However, human food selection is not driven only by individual decisions. Food and eating environments are likely to influence food choice over and even above individual factors such as knowledge, skills or even motivation(34). The present findings show that a simple and inexpensive environmental measure, i.e. increasing the selection of healthy foods, can improve consumers’ food choices. This finding might be of interest for public health authorities to promote adapting out-of-home eating environments. Consumers themselves could profit from this measure at
home. We suggest that serving an assortment of vegetables as side dishes might be a simple and effective strategy to improve meal composition.
Acknowledgements
The present study received no specific grant from any funding agency in the public, commercial or not-for-profit sectors. The authors have no conflict of interest to declare. T.B. contributed towards data acquisition, data analysis and led the writing. K.v.d.H. and M.S. helped interpret the results and provided critical feedback on drafts of the article. All authors contributed to the design of the study.
References
1. US Department of Agriculture (1992) Food Guide Pyramid. A Guide to Daily Food Choices [US Department of Health and Human Services, editor]. Hyattsville, MD: USDA. 2. Derrickson JP, Sakai M & Anderson J (2001) Interpretations
of the ‘balanced meal’ household food security indicator. J Nutr Educ 33, 155–160.
3. Bundeasmt fu¨r Gesundheit BAG (2007) Empfehlungen fu¨ r eine ausgewogene Erna¨hrung [Bundesamt fu¨r Gesundheit DV, editor]. Bern: Bundesamt fu¨r Gesundheit.
4. Melhorn SJ, Krause EG, Scott KA et al. (2010) Acute exposure to a high-fat diet alters meal patterns and body composition. Physiol Behav 99, 33–39.
5. Grundy SM (2000) Metabolic complications of obesity. Endocrine 13, 155–165.
6. Rolls BJ, Ello-Martin JA & Tohill BC (2004) What can intervention studies tell us about the relationship between fruit and vegetable consumption and weight management? Nutr Rev 62, 1–17.
7. World Cancer Research Fund & American Institute for Cancer Research (2007) Food, Nutrition, Physical Activity, and the Prevention of Cancer: A Global Perspective. Washington, DC: WCRF/AICR.
8. Bazzano LA, He J, Ogden LG et al. (2002) Fruit and vegetable intake and risk of cardiovascular disease in US adults: the first National Health and Nutrition Examination Survey Epide-miologic Follow-up Study. Am J Clin Nutr 76, 93–99. 9. Prynne CJ, Mishra GD, O’Connell MA et al. (2006) Fruit and
vegetable intakes and bone mineral status: a cross sectional study in 5 age and sex cohorts. Am J Clin Nutr 83, 1420–1428.
10. Tucker KL, Hannan MT, Chen H et al. (1999) Potassium, magnesium, and fruit and vegetable intakes are associated with greater bone mineral density in elderly men and women. Am J Clin Nutr 69, 727–736.
11. Morris MC, Evans DA, Tangney CC et al. (2006) Associa-tions of vegetable and fruit consumption with age-related cognitive change. Neurology 67, 1370–1376.
12. Epstein LH, Gordy CC, Raynor HA et al. (2001) Increasing fruit and vegetable intake and decreasing fat and sugar intake in families at risk for childhood obesity. Obes Res 9, 171–178.
13. Lanza E, Schatzkin A, Daston C et al. (2001) Implementa-tion of a 4-y, high-fiber, high-fruit-and-vegetable, low-fat dietary intervention: results of dietary changes in the Polyp Prevention Trial. Am J Clin Nutr 74, 387–401.
14. Shepherd R (2006) The Psychology of Food Choice. Wallingford: CABI.
15. Hill JO & Peters JC (1998) Environmental contributions to the obesity epidemic. Science 280, 1371–1374.
16. Wansink B (2004) Environmental factors that increase the food intake and consumption volume of unknowing consumers. Annu Rev Nutr 24, 455–479.
17. Kremers SP, de Bruijn GJ, Visscher TL et al. (2006) Environmental influences on energy balance-related beha-viors: a dual-process view. Int J Behav Nutr Phys Act 3, 9. 18. Orfanos P, Naska A, Trichopoulos D et al. (2007) Eating out of home and its correlates in 10 European countries. The European Prospective Investigation into Cancer and Nutri-tion (EPIC) study. Public Health Nutr 10, 1515–1525. 19. Orfanos P, Naska A, Trichopoulou A et al. (2009) Eating out
of home: energy, macro- and micronutrient intakes in 10 European countries. The European Prospective Investiga-tion into Cancer and NutriInvestiga-tion. Eur J Clin Nutr 63, Suppl. 4, S239–S262.
20. Herman CP & Polivy J (2008) External cues in the control of food intake in humans: the sensory–normative distinction. Physiol Behav 94, 722–728.
21. Remick AK, Polivy J & Pliner P (2009) Internal and external moderators of the effect of variety on food intake. Psychol Bull 135, 434–451.
22. Rolls BJ, Morris EL & Roe LS (2002) Portion size of food affects energy intake in normal-weight and overweight men and women. Am J Clin Nutr 76, 1207–1213. 23. Kahn BE & Wansink B (2004) The influence of assortment
structure on perceived variety and consumption quantities. J Consum Res 30, 519–533.
24. Wansink B (2006) Mindless Eating: Why We Eat More Than We Think. New York, NY: Bantam.
25. Wansink B (2010) From mindless eating to mindlessly eating better. Physiol Behav 100, 454–463.
26. Rolls BJ, Roe LS & Meengs JS (2010) Portion size can be used strategically to increase vegetable consumption in adults. Am J Clin Nutr 91, 913–922.
27. Rolls BJ, Rowe EA, Rolls ET et al. (1981) Variety in a meal enhances food intake in man. Physiol Behav 26, 215–221.
28. DeMiguel V, Garlappi L & Uppal R (2009) Optimal versus naive diversification: how inefficient is the 1/N portfolio strategy? Rev Financ Stud 22, 1915–1953.
29. ETH Zu¨rich (2010) SwissFIR. http://www.swissfir.ethz.ch/ (accessed December 2010).
30. Deutsche Gesellschaft fu¨r Erna¨hrung (2001) Referenzwerte fu¨ r die Na¨hrstoffzufuhr. Frankfurt am Main: Umschau/ Braus.
31. Perez-Cueto FJA & Verbeke W (2009) Reliability and validity of self-reported weight and height in Belgium. Nutr Hosp 24, 366–367.
32. Rolls BJ, Roe LS, Halverson KH et al. (2007) Using a smaller plate did not reduce energy intake at meals. Appetite 49, 652–660.
33. Geier AB, Rozin P & Doros G (2006) Unit bias: a new heuristic that helps explain the effect of portion size on food intake. Psychol Sci 17, 521–525.
34. Story M, Kaphingst KM, Robinson-O’Brien R et al. (2008) Creating healthy food and eating environments: policy and environmental approaches. Annu Rev Public Health 29, 253–272.