Comparison of a classical with a highly formularized body
condition scoring system for dairy cattle
A. Isensee
1†, F. Leiber
1, A. Bieber
1, A. Spengler
1, S. Ivemeyer
1,2, V. Maurer
1and P. Klocke
1,3 1FiBL– Research Institute of Organic Agriculture, Department of Livestock Sciences, Ackerstr. 113, 5070 Frick, Switzerland;2University of Kassel, Farm AnimalBehaviour and Husbandry Section, Nordbahnhofstr. 1a, 37213 Witzenhausen, Germany;3Bovicare– Hermannswerder Haus 14, 14473 Potsdam, Germany
(Received 14 April 2014; Accepted 19 June 2014; First published online 30 July 2014)
Body condition scoring is a common tool to assess the subcutaneous fat reserves of dairy cows. Because of its subjectivity, which causes limits in repeatability, it is often discussed controversially. Aim of the current study was to evaluate the impact of considering the cows overall appearance on the scoring process and on the validity of the results. Therefore, two different methods to reveal body condition scores (BCS),‘independent BCS’ (iBCS) and ‘dependent BCS’ (dBCS), were used to assess 1111 Swiss Brown Cattle. The iBCS and the dBCS systems were both working with the sameflowchart with a decision tree structure for visual and palpatory assessment using a scale from 2 to 5 with increment units of 0.25. The iBCS was created strictly complying with the defined frames of the decision tree structure. The system was chosen due to its formularized approach to reduce the influence of subjective impressions. By contrast, the dBCS system, which was in line with common practice, had a more open approach, where– besides the decision tree – the overall impression of the cow’s physical appearance was taken into account for generating thefinal score. Ultrasound measurement of the back fat thickness (BFT) was applied as a validation method. The dBCS turned out to be the better predictor of BFT, explaining 67.3% of the variance. The iBCS was only able to explain 47.3% of the BFT variance. Within the whole data set, only 31.3% of the animals received identical dBCS and iBCS. The pin bone region caused the most deviations between dBCS and iBCS, but also assessing the pelvis line, the hook bones and the ligaments led to divergences in around 20% of the scored animals. The study showed that during the assessment of body condition a strict adherence to a decision tree is a possible source of inexact classifications. Some body regions, especially the pin bones, proved to be particularly challenging for scoring due to difficulties in assessing them. All the more, the inclusion of the overall appearance of the cow into the assessment process counteracted these errors and led to a fair predictability of BFT with theflowchart-based BCS. This might be particularly important, if different cattle types and breeds are assessed.
Keywords: body condition score, back fat thickness, observer, dairy cow, holistic assessment
Implications
Body condition scoring is a widely used tool for assessing subcutaneous fat appositions to detect metabolic status and health risks like subacute ketosis or fertility problems in dairy cows. The scoring process contains visual and palpatory assessment and is therefore dependent on subjective impres-sions of the observer. Owing to its subjectivity, validity of body condition scoring is sometimes questioned. The current study analysed two body condition scoring systems regard-ing their validity. Further it evaluated the effect of includregard-ing the cow’s overall appearance into the assessment.
Introduction
Body condition, respectively the amount of body fat reserves, vary through the lactation cycle of the cow in a predictable way (Friggens, 2003). After calving, energy output exceeds energy input, resulting in a negative energy balance. Cows usually react with a mobilization of body fat reserves (Gross et al., 2011), which comes along with changes in blood plasma metabolites, for example an increase of non-esterified fatty acids andβ-hydroxy-butyrate and a decrease of triglycerides (Leiber et al., 2011). Fat mobilization post calving is necessary for productivity, but can also impair health and reproduction. Therefore, monitoring the energetic status and the quantity of the cow’s fat storage is recom-mended (Bewley and Schutz, 2008). Subcutaneous adipose tissue seems to represent the proportional change of total
†E-mail: anne.isensee@fibl.org
tomical sites of the tail head, pelvic and loin region in a given order which then leads to the appropriate score. The scale of the scoring system reaches from 2 to 5 points with increment units of 0.25. Body condition score (BCS) benchmarks for the particular time of the lactation cycle exist. Rocheet al.(2009) defined the optimal BCS at calving between 3 and 3.25. Even if several studies showed the usefulness of body condition scoring for assessing the energy balance status of the cow (Wright and Russel, 1984; Butler-Hogget al., 1985), it also has its limitations. Owing to the assessment, which is based on personal perception, repeatability can be a problem (Ferguson
et al., 1994; Kristensenet al., 2006).
The widely used BCS assessment advices by Edmonson
et al.(1989) and Fergusonet al.(1994) were both developed with Holstein cows in the United States. Cattle type differ-ences in body fat distribution and body shape have to be considered when these BCS systems are used for other breeds (Wright and Russel, 1984; Rastani et al., 2001). In mountainous regions like Switzerland, dual purpose cattle are often kept for milk production. If body scoring systems developed for dairy breeds are also used for dual purpose cattle, their application might be inaccurate. Body condition scoring may cause particular problems in breeds which are less homogenous as it is the case in the milk focused dual-purpose Swiss Brown Cattle, which has a varying hybridization of milk-type Brown Swiss and of the more meaty Original Braunvieh. This might require the inclusion of the cows overall appearance into the decision-making process in order to avoid mistakes caused by deviating body fat distribution. On the other hand this overall appearance of the cow might be susceptible for erroneous assessments. Therefore the question might be whether a higher formularization leads to better repeatability.
The aim of this study was to analyse how a formularized strict hierarchic system– or to say a more standardized and guided scoring system with less opportunities for subjective flexibility – performs compared to the common and widely used body condition scoring system with its strong influence of the assessors’ perception of the cows’ overall appearance. Both approaches were validated by ultrasonic back fat thickness (BFT) measurements. A further aim was to identify particularly problematic body regions for the BCS by com-paring the two approaches.
compliance with the Swiss animal welfare act and the animal welfare ordinance (Authorization Nr. 75′541). Lactating and dry cows were measured. For the measurement the cows in the free stall barn needed to be locked in head gates at the feed manger. In the study, 1164 animals were included. After excluding missing values, technical measuring errors or cows of other breeds, 1111 animals were left for statistical analysis.
Methods of assessing the body condition
Two methods were used to assess or measure the body condition of the cow. The thereby generated scores are called independent BCS (iBCS) and dependent BCS (dBCS). Both systems are based on the hierarchically constructed body condition scoring system developed by Fergusonet al.
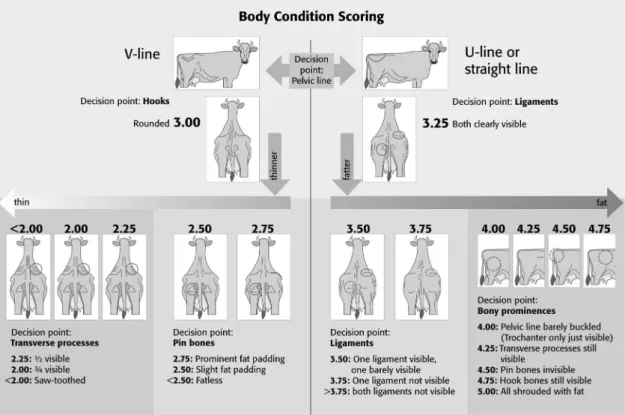
(1994), published as a flowchart by Elanco (1997) and adapted to breed-independent scoring by Ivemeyer et al.
(2006) (Figure 1). The system has a scale from 2 to 5 with increment units of 0.25. The method involves visual assess-ment as well as palpation of specific body parts of the loin, pelvic and tail head region. The flow chart directs the assessor to view the defined body regions in a fixed order. The assessment grades for the respective body regions appear as verbal codes, which are defined and thus guide the scoring process in an unambiguous way (Figure 1). Thefirst step is to decide whether the pelvic area or rather the line from the hooks to the trochanter region to the pin bones is angular (V-shaped) or blunt (U-shaped). This decision step determines if the animals are classified ⩽3.00 or ⩾3.25 and therefore predefines which body regions have to be assessed next. When animals are classified ⩽3.00, the hooks are the next region to be assessed. If they are categorized to be round, the assessing process finishes at this point with a given score for the cow of 3.00. If the hooks show an angular form, the pin bone region has to be assessed next and so on (see Figure 1). If the animals are classified ⩾3.25, the ligaments have to be assessed subsequently. When they are both clearly visible, the animal is scored with a 3.25 and the assessment processfinishes. If not, the assessing process continues as shown in Figure 1.
Although the two scoring systems are based on the same scheme, their assessment process differed. For the iBCS, all
body regions mentioned in the flowchart (Figure 1) were assessed independently, without generating a score but generating an unambiguous verbal code for each body region. Subsequently, thefinal iBCS was generated outside the barn by applying the verbal codesa posterioriwithin the decision tree structure (Figure 1) using Microsoft Excel. This method was developed tofind out if a very strict use of the decision tree without consideration of the cows’ overall appearance can lead to improved BCS assessments.
For the dBCS, which was in line with common practice, the score was given directly in the barn. The decision tree structure was applied, but the overall appearance of the cow was used to correct the scores during the decision-making process. During the scoring process an ongoing reconciliation between the cow’s overall appearance and the scoring process on the base of the flow chart was applied. The ‘overall appearance’ of the cow consists of all body regions listed in theflow chart. The system apparently has a greater subjective impact due to the permitted influence of the overall impression and the resulting range of modification. The score therefore is more dependent on the assessment of the observer and that is why we called it dBCS. This method was developed based on Elanco (1997) and Ivemeyer
et al.(2006).
Body condition scoring and measuring of BFT (as described below) were conducted by two trained persons. In advance of the study, three preliminary tests– calculations ofκ-coefficients based on Grouven et al. (2007) – had been conducted to evaluate inter-observer reliability of body condition scoring.
κ-coefficients of 0.55, 0.67 and 0.75 demonstrated a quite
good inter-observer agreement. The body region-specific grades for the iBCS were defined and BFT was measured in a first independent step. Later on the same day both assessors applied the dBCS system together without being able to see the grades from the iBCS and the BFT values.
Measuring the BFT
The validity of iBCS and dBCS was tested regarding their ability to predict BFT which was measured by ultrasound applying the method of Staufenbiel (1992). The examination point was located in the sacral region on an imaginary line between the pin and the hook at the right side of the cow one hand’s width (about 10 cm) away from the pin. The back fat measurement includes the measurement of the skin which is 5 to 6 mm thick in the sacral area. The fat layer is located between the skin and the profound fascia. The profound fascia separates the back fat from the gluteal muscle (Schröder and Staufenbiel, 2006). For the measure-ment the Tringa Linear ultrasound system (Esaote, Genova, Italy) was used. As contact agent 80% ethanol was applied to the unshaven coat.
Statistical analysis
The BFT values were transformed (ln) before calculating the linear regression models to achieve a Gaussian distribution. In the regression models the BFT-values represented the dependent variable whereas the dBCS and iBCS in each case served as independent variables. The linear regressions were computed with the statistical software R 2.15 (R Core Team, 2012). The Gaussian distribution of the residues of thefitted
values was tested by a Residual v. Fitted and a QQ Plot. Boxplots showing BFT in dependency on dBCS and iBCS were generated with SigmaPlot 10.0 (Systat Software Inc).
Identification of relevant body regions
To investigate the relevant body regions influencing the discrepancies between the two BCS systems, iBCS and dBCS were compared for each individual animal and the respective deviant decision point or body region was identi-fied (Table 1). The body region (or decision point), at which the decision tree paths (according to Figure 1) for iBCS and dBCS separated, was tagged for each individual cow. For example, the hook bones were identified as a deviation point, when a cow showed an iBCS of 2.5 and a dBCS of 3 or reverse. For iBCS 2.25 and dBCS 2.75 or vice versa, the pin bone region would have been tagged as the deviation point. The number of deviations was set in relation to the number
of animals which passed the respective decision point based on iBCS data.
Results
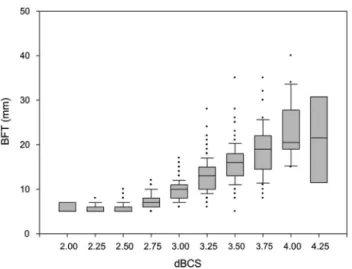
The results of the linear regression of BFT on dBCS and iBCS, respectively, are displayed in Table 2. The dBCS was able to explain the BFT better; 67.3% of the variance of the BFT were explained by this scoring system (Table 2). By contrast, the iBCS could only explain 47.3% of the BFT variance. Although the accuracy to predict BFT differed between dBCS and iBCS, the boxplots (Figures 2 and 3) reveal that there exists a certain coherence for both BCS approaches with the BFT.
Table 1 shows the absolute and relative numbers of cows with deviating iBCS and dBCS scores at the different points of the decision tree. A total of 232 animals were assessed
Hook bones4 4.5–4.75 → 0 0 0 0 0 0 0
Completely adipose
5.0 0 0 0 0 0 0 0
1Arrows indicate that assigning the respective score at the given decision point leads automatically to the assessment of the next decision point in the indicated
numerical direction.
2dependent body condition score (dBCS). Overall appearance of the cow was used to correct the scores during the decision making process.
3independent body condition score (iBCS). This system is characterized by a very strict use of the decision tree structure without consideration of the cows’ overall
appearance.
4
These body regions occur twice in theflowchart, but are only assessed once, either in category ⩽3.00 or ⩾3.25.
Table 2Linear regression of two different body condition scores on back fat thickness in Swiss Brown Cattle (n= 1111)
Items Coefficient Standard Error t-value P-value R2 AdjustedR2 F-statistic
dBCS1 Intercept 0.805 0.0251 32.01 <0.001 dBCS1 0.391 0.0081 47.78 <0.001 Model 0.10431109 df <0.001 0.673 0.673 22831,1109 df iBCS2 Intercept 1.257 0.0238 52.91 <0.001 iBCS2 0.250 0.0079 31.55 <0.001 Model 0.13241109 df <0.001 0.473 0.473 995.51,1109 df 1
dependent body condition score (dBCS). Overall appearance of the cow was used to correct the scores during the decision making process.
2independent body condition score (iBCS). This system is characterized by a very strict use of the decision tree structure without consideration of the cows’ overall
differently when it came to decide whether the pelvis line appears as a U or V. The majority of these animals had a higher iBCS than dBCS, indicating that cows having received the score ‘U’ at the pelvis line, were downgraded by their overall appearance in the dBCS. Also the shape of the hook bones was difficult to assess resulting in 19% deviating cases. Here, dBCS was mostly higher than iBCS. The highest discrepancy between iBCS and dBCS was found in the pin bone region when scoring cows at⩽2.75. The decision point was passed by 429 animals; in more than 60% dBCS and iBCS differed. In most of these cases the dBCS score was higher than the iBCS score, indicating that a low score given at the pin bones was corrected upwards in dBCS by the overall appearance of the cow. Also assessing the ligaments caused considerable deviations, but here the direction of deviation was not as clear as in the other problematic regions. Table 1 shows that 33% of the animals received deviating iBCS and dBCS at the decision point for score 4.0 (trochanter still visible or not). But due to the low number of
animals passing this decision point, the meaningfulness of the result is questionable. In the entire data set, only 31.3% of the animals were classified with the same dBCS and iBCS (Figure 4).
Discussion
Significance of the overall appearance of the cow
The more open and common dBCS system revealed clearly closer matches with the BFT than the iBCS system which strictly followed the paths of the decision tree. The dBCS method included the overall cow’s appearance. Thus, this approach was apparently more open to subjective impres-sions of the assessor. On the other hand it might be argued that the assessment of a particular part of the body is not less subjective than that of a whole animal. The iBCS and the dBCS system of the current study might be characterized as a more particularistic (the former)va more general (the latter) approach. It can be concluded that, given a certain influence of subjective impressions on the decision process, the result gets improved if subjectivity is connected to the general impression rather than only to the particular scorings of separated body regions. For animal behaviour studies, also Wemelsfelderet al.(2001) concluded that a qualitative (and thus‘subjective’) assessment of animals’ behaviour achieves a higher validity if it is directed to the whole animal rather than to separate traits.
According to Elanco (1997) not all cowsfit into the estab-lished Ferguson system. In these cases they also recommend an adjustment of thefinal BCS based on observations of all designated body regions. This approach coincides with the results of the present study. If the overall impression of the cow is included in the assessment process, the decision tree-based system provides valid information about the body reserves. It can be concluded that taking into account the overall appearance of the cow is a necessary step in the assessments of the body condition.
Figure 3 Back fat thickness (BFT) distribution within the categories of the independent body condition score (iBCS) in Swiss Brown Cattle (n= 1111).
Figure 4 Distribution of the individual differences of the dependent and independent body condition score (dBCS and iBCS) in Swiss Brown Cattle (n= 1111).
Figure 2 Back fat thickness (BFT) distribution within the categories of the dependent body condition score (dBCS) in Swiss Brown Cattle (n= 1111).
distinguish between those levels and to clearly assign the amount of fat apposition to the adequate category. Jilg and Weinberg (1998) also stated that among others the pin bone region is particularly difficult to assess due to the muscles in this area. Their observations were made on the dual purpose breedFleckvieh, hence this characteristic might vary between different cattle types.
According to Ferguson et al. (1994), a 0.25-increment accuracy can only be reached between the scores 2.5 and 4.0, while on the upper or lower end of the scale the system loses accuracy and only 0.5 increments are possible. How-ever, BCS below 2.5 and above 4.0 may rather be cases where animal welfare is generally impaired. Such a diagnosis might even not need an accuracy of 0.25 increments, which is however necessary for differentiated body condition curves in normal healthy cows (cf. Vasseur et al., 2013). The weakness of the system for thinner cows may be partly explained by the difficulty to assess the pin bone region correctly. However, also the pelvis line, the hook bones and the ligaments frequently received different iBCS and dBCS assessments in the current study. Thus, the problem is not restricted to thin cows.
Another point which has to be analysed is the possibility of a malfunction of the hierarchic order when it comes to assess the problematic body regions. An erroneous score in one body region would not be too dramatic if it would be corrected by other regions in an open system like that of Edmonsonet al.(1989) or by the whole animals’ appearance like in the current study (dBCS system). By contrast, in a very strict system like iBCS such a regional assessment error cannot be corrected, but may even cause larger errors, because it leads the assessor to the next assessment step within the wrong body region.
Applicability of the Ferguson system to different breeds and ages
Even though in this trial no comparison between different breeds regarding BCS systems took place, some studies indicate that breed related differences might have played a role for the weak performance of the iBCS system. The hierarchic body condition scoring system of Fergusonet al.
(1994) is based on Holstein regularities. If the subcutaneous fat distribution varies between different cattle types and
appositions on Holstein cows.
Another point which exacerbates a consistent scoring of the animals is the age-related fat modification. Dairy cows within the first two lactations are still in process of growth; within the first lactation temporarily fat becomes even mobilized for the buildup of protein (Klawuhn and Staufenbiel, 1997). Hence it could be that the breed and age-related differences in fat storage mechanisms as well as the heterogeneity within the breed aggravated the assessing process in this study. The dBCS system with its more open approach was obviously more capable to mitigate these difficulties.
Conclusion
It can be concluded that the dBCS method which includes the overall appearance of the cow into the flowchart system, performs with a much higher accuracy than the strictly decision tree-based iBCS method. This implies that the flowchart system, if it includes a holistic view of the whole animals’ appearance gives good results even if different cattle types are considered. By contrast, the strictly applied decision tree bears no possibility to correct erroneous decisions, but it is rather at risk to even enhance these errors. Additionally this system can barely account for differences in breeds and individual types. Thus, a formularization of the body condition scoring does not lead to a higher accuracy of the values.
Acknowledgements
The authors gratefully acknowledgefinancial support from the European Community under the 7th framework project Low-InputBreeds, FP7 project No. KBBE 222 632. Special thanks to all the dairy producers who took part in the study.
References
BioSuisse 2014. Richtlinien für die Erzeugung, Verarbeitung und den Handel von Knospe-Produkten. BioSuisse, Basel, Switzerland. Retrieved April 14, 2014, from http://www.bio-suisse.ch/media/de/pdf2014/Regelwerk/rl_2014_d.pdf Bewley JM and Schutz MM 2008. Review: an interdisciplinary review of body condition scoring for dairy cattle. The Professional Animal Scientist 24, 507–529. Butler-Hogg BW, Wood JD and Bines JA 1985. Fat partitioning in British Friesian cows: the influence of physiological state on dissected body composition. The Journal of Agricultural Science 104, 519–528.
EC 1991. Council Regulation (EEC) No 2092/91 of 24 June 1991 on organic production of agricultural products and indications referring thereto on agri-cultural products and foodstuffs. Official Journal of the European Communities L198, 1–15.
EC 1999. Council Regulation (EC) No 1804/1999 of 19 July 1999 supplementing Regulation (EEC) No. 2092/91 on organic crop production of agricultural pro-ducts and indications referring thereto on agricultural propro-ducts and foodstuffs to include livestock production. Official Journal of the European Communities L222, 1–28.
Edmonson AJ, Lean IJ, Weaver LD, Farver T and Webster G 1989. A body con-dition scoring chart for Holstein dairy cows. Journal of Dairy Science 72, 68–78. Elanco 1997. Body condition scoring in dairy cattle. Elanco Animal Health, Greenfield, Indianapolis, USA.
Ferguson JO, Galligan DT and Thomsen N 1994. Principal descriptors of body condition score in Holstein cows. Journal of Dairy Science 77, 2695–2703. Friggens NC 2003. Body lipid reserves and the reproductive cycle: towards a better understanding. Livestock Production Science 83, 18–18.
Gross J, van Dorland HA, Bruckmaier RM and Schwarz FJ 2011. Performance and metabolic profile of dairy cows during a lactational and deliberately induced negative energy balance with subsequent realimentation. Journal of Dairy Science 94, 1820–1830.
Grouven U, Bender R, Ziegler A and Lange S 2007. Der Kappa-Koeffizient – Artikel Nr. 23 der Statistik-Serie in der DMW– The kappa coefficient. Deutsche Medizinische Wochenschrift 132, 65–68.
Ivemeyer S, Klocke P and Spengler Neff A 2006. Körper-Konditions-Beurteilung. Forschungsinstitut für biologischen Landbau (FiBL), Frick, Switzerland. https:// www.fibl.org/fileadmin/documents/shop/1650-bcs.pdf
Jilg T and Weinberg L 1998. Konditionsbewertung: Jetzt auch beim Fleckvieh. Top Agrar 6, 12–15.
Klawuhn D and Staufenbiel R 1997. Aussagekraft der Rückenfettdicke zum Körperfettgehalt beim Rind. Tierärztlliche Praxis 25, 133–138.
Kristensen E, Dueholm L, Vink D, Andersen JE, Jakobsen EB, Illum-Nielsen S, Petersen FA and Enevoldsen C 2006. Within- and across-person uniformity of
body condition scoring in Danish Holstein Cattle. Journal of Dairy Science 89, 3721–3728.
Leiber F, Hochstrasser R, Wettstein HR and Kreuzer M 2011. Feeding transition cows with oilseeds: effects on fatty acid composition of adipose tissue, colostrum and milk. Livestock Science 138, 1–12.
Mösenfechtel S, Eigenmann UJ, Wanner W and Rüsch P 2000. Rückenfettdicke und Fruchtbarkeit bei Braunviehkühen. Schweizer Archiv für Tierheilkunde 142, 679–689.
Rastani RR, Andrew SM, Zinn SA and Sniffen CJ 2001. Body composition and estimated tissue energy balance in Jersey and Holstein cows during early lac-tation. Journal of Dairy Science 84, 1201–1209.
R Core Team 2012. R: a language and environment for statistical computing. R Foundation for Statistical Computing, Vienna, Austria.
Roche JR, Friggens NC, Kay JK, Fisher MW, Stafford KJ and Berry DP 2009. Invited review: body condition score and its association with dairy cow productivity, health, and welfare. Journal of Dairy Science 92, 5769–5801. Schröder UJ and Staufenbiel R 2006. Invited review: methods to determine body fat reserves in the dairy cow with special regard to ultrasonographic measure-ment of backfat thickness. Journal of Dairy Science 89, 1–14.
Staufenbiel R 1992. Energie- und Fettstoffwechsel des Rindes– Untersuchungs-konzept und Messung der Rückenfettdicke. Monatshefte für Veterinärmedizin 47, 467–474.
Truscott TG, Wood JD and Denny HR 1983. Fat deposition in Hereford and Friesian steers: 2. Cellular development of the major fat depots. The Journal of Agricultural Science 100, 271–276.
Vasseur E, Gibbons J, Rushen J and de Passillé AM 2013. Development and implementation of a training program to ensure high repeatability of body condition scoring of dairy cows. Journal of Dairy Science 96, 4725–4737. Wemelsfelder F, Hunter TEA, Mendl MT and Lawrence AB 2001. Assessing the ‘whole animal’: a free choice profiling approach. Animal Behaviour 62, 209–220.
Wright IA and Russel AJF 1984. Partition of fat, body composition and body condition score in mature cows. Animal Production 38, 23–32.