Supporting information for
Synthesis of high molecular weight poly(p-benzamide)s
Michael Badoux, Andreas F.M. Kilbinger*
University of Fribourg, Chemistry Department, Chemin du Musée 9, CH-1700 Fribourg, Switzerland
Synthesis of the ethyl ester monomers M2 to M5. ... 4
Figure S1 Synthesis of monomers M2-‐M5 ... 4
4-‐((Tert-‐butoxycarbonyl)amino)-‐2-‐hydroxybenzoic acid (7) ... 4
2-‐Ethylhexyl 4-‐((tert-‐butoxycarbonyl)amino)-‐2-‐((2-‐ethylhexyl) oxy)benzoate (8) ... 4
2-‐(2-‐Ethylhexyloxy)-‐4-‐amino benzoic acid (9) ... 5
Ethyl 4-‐amino-‐2-‐((2-‐ethylhexyl)oxy)benzoate (10) ... 5
Ethyl 2-‐((2-‐ethylhexyl)oxy)-‐4-‐(isopropylamino)-‐benzoate (M2) ... 5
Ethyl 4-‐(allylamino)-‐2-‐((2-‐ethylhexyl)oxy)benzoate (M3) ... 5
Ethyl 2-‐((2-‐ethylhexyl)oxy)-‐4-‐((1-‐phenylethyl)amino)benzoate (M4) ... 6
4-‐((2-‐ethylhexyl)amino)benzoic acid (11) ... 6
Ethyl 4-‐((2-‐ethylhexyl)amino)benzoate (M5) ... 6
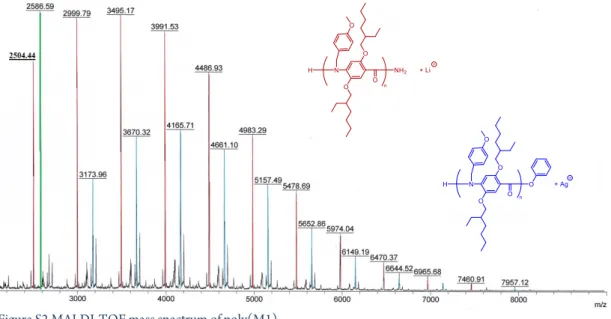
Figure S2 MALDI-‐TOF mass spectrum of poly(M1) ... 6
Side reaction studies ... 7
General procedure for the phenyl ester substitutions. ... 7
Figure S3
1H NMR spectrum (300 MHz, THF-‐d8) of phenyl benzoate with LiHMDS over time. ... 7
Figure S4
1H NMR spectrum (300 MHz, THF-‐d8) of phenyl benzoate with KHMDS over time. ... 7
General procedure for the imine formation. ... 8
Figure S5
1H NMR spectrum (300 MHz, THF-‐d8) of the reaction between N-‐PMB-‐aniline and
LiHMDS. ... 8
Figure S6
1H NMR spectrum (300 MHz, THF-‐d8) of the reaction between N-‐PMB-‐aniline and
KHMDS ... 8
Figure S7
1H NMR spectrum (300 MHz, THF-‐d8) of the reaction between N-‐DMB-‐aniline and
LiHMDS ... 9
Figure S8
1H NMR spectrum (300 MHz, THF-‐d8) of the reaction between N-‐DMB-‐aniline and
KHMDS ... 9
Figure S9
1H NMR spectrum (300 MHz, THF-‐d8) of the reaction between DMB-‐o-‐anisidine and
LiHMDS ... 10
Figure S10
1H NMR spectrum (300 MHz, THF-‐d8) of the reaction between PMB-‐o-‐anisidine and
LiHMDS ... 10
Figure S11 Electro-‐spray ionization mass spectrometry of the reaction between PMB-‐o-‐anisidine
and LiHMDS. ... 11
Figure S12
1H NMR spectrum (400 MHz, THF-‐d8) of the reaction between N-‐(1-‐
phenylethyl)aniline and LiHMDS ... 11
Figure S13
1H NMR spectrum (400 MHz, THF-‐d8) of the reaction between N-‐(2-‐phenylpropan-‐2-‐
yl)aniline and LiHMDS ... 12
Figure S14
1H NMR spectrum (400 MHz, THF-‐d8) of the reaction between N-‐allylaniline and
LiHMDS ... 12
General procedure for the transamidation reactions ... 13
Figure S15
1H NMR spectrum (500 MHz, THF-‐d8) of the reaction between N-‐ethylaniline and N-‐
methylbenzanilide and LiHMDS ... 13
Figure S16
1H NMR spectrum (500 MHz, THF-‐d8) of the reaction between N-‐ethylaniline and N-‐
methylbenzanilide and KHMDS ... 13
Polymerization of M2 to M5. ... 14
Table SI-‐1. Molecular weights (GPC, THF) of polymers prepared from M2 -‐ M5 ... 14
Analysis of polymers M6 to M11. ... 14
Figure S17 Poly(M8) (table 3 entry 3). MALDI-‐TOF mass spectrum ... 14
Figure S18 Poly(M9) (table 3 entry 4). MALDI-‐TOF mass spectrum ... 15
Figure S19
1H-‐NMR spectrum (400 MHz, chloroform-‐d1) of poly(M10) (table 3 entry 7). ... 15
Figure S20
19F NMR spectra (376 MHz, chloroform-‐d1) of the reactant M10 and the crude
poly(M10) (table 3 entry 7) ... 16
Figure S21 poly(M10). Gel permeation chromatography elugram in chloroform. Table 4 entry 4.
... 16
Figure S22 Poly(M10) (table 4 entry 5). MALDI-‐TOF mass spectrum ... 17
Figure S23 Poly(M11).
1H NMR (400 MHz, chloroform-‐d1) spectra of the monomer M11 and the
polymer ... 17
Figure S24 Poly(M11).
19F NMR spectra (376 MHz, chloroform-‐d1) of the monomer M11 and the
polymer ... 18
Figure S25 Poly(M11). Gel permeation chromatography elugram in chloroform ... 18
Figures S26. GPC elugrams of table 1, table SI-‐1, table 3 and table 4. ... 19
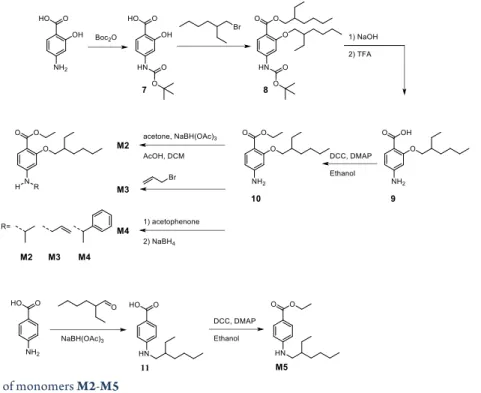
Synthesis of the ethyl ester monomers M2 to M5.
In order to avoid the side reactions described in the first part of the report we first investigated 4-aminobenzoate monomers carrying ethyl esters. We hypothesized that ethyl esters would be less electrophilic and therefore less likely to undergo nucleophilic attack by LiHMDS or KHMDS. Moreover, different amine substituents were used in order to observe their influence on the molecular weight. Figure 5 describes the synthesis of ethyl ester monomers M2-M5. Starting from 4-amino salicylic acid the amine was first N-Boc protected using di-tert-butyl-di-carbonate (7, 91 %). Alkylation with 2-ethyl-hexyl bromide gave the ether and ester derivative 8 in 92 % yield. Hydrolysis of the ester using NaOH gave the free amino acid (9, 85 %) which was subsequently esterified using ethanol (10, 91 %). The amine substituent was introduced via substitution with allyl bromide (ethyl ethylhexyl)oxy)-4-((1-phenylethyl)amino)benzoate M3, 26%) or reductive amination with acetone (ethyl 2-((2-ethylhexyl)oxy)-4-(isopropylamino)benzoate M2, 58%) or acetophenone (ethyl 4-(allylamino)-2-((2-ethylhexyl)oxy)benzoate M4, 15%). Ethyl 4-((2-ethylhexyl)amino)benzoate M5 was synthesized via direct reductive alkylation of 4-aminobenzoic acid with 2-ethyl hexanal (11, 92%) followed by esterification with ethanol (M5, 89%).
The solubility of the monomers M2-M4 as well as of the corresponding polymers was ensured by the 2-ethylhexyl ether side chain in 2 position. Monomer M5 showed excellent solubility due to its N-ethyl-hexyl side chain. In this case, no other solubilizing chain is required on the aromatic ring.
Figure S1 Synthesis of monomers M2-M5
4-((Tert-butoxycarbonyl)amino)-2-hydroxybenzoic acid (7)
4-Amino-2-hydroxybenzoic acid ( 5 g, 32.7 mmol) was dissolved in methanol (22 ml, 1.4 M) in presence of triethylamine (5.46 ml, 39.2 mmol). Boc anhydride (7.13 g, 32.7 mmol) dissolved in THF (18 ml, 1.5 M) was added to the solution. The reaction mixture was heated at 50°C for 3 days and quenched with solution of potassium hydrogen sulfate (32.7 ml, 2 M). The aqueous phase was extracted with ethyl acetate, dried and the solvent was removed under reduced pressure to give 4-((Tert-butoxycarbonyl)amino)-2-hydroxybenzoic acid 7 (7.52 g, 29.7 mmol, 91%). 1H NMR (300 MHz, DMSO-d6) δ ppm 1.42 - 1.60 (m, 9 H) 6.93 - 7.05 (m, 1 H) 7.14 (d, J=1.9 Hz, 1 H) 7.66 (d, J=8.7 Hz, 1 H) 9.71 (s, 1 H) 11.30 (br, 1 H). 13C NMR (75 MHz, DMSO-d6) δ ppm 28.01 (3 Cp) 79.83 (1 Cq) 104.57 (1 Ct) 106.52 (1 Cq) 109.24 (1 Ct) 130.93 (1 Ct) 146.26 (1 Cq) 152.39 (1 Cq) 162.22 (1 Cq) 171.74 (1 Cq). 1
2-Ethylhexyl 4-((tert-butoxycarbonyl)amino)-2-((2-ethylhexyl) oxy)benzoate (8)
4-((Tert-butoxycarbonyl)amino)-2-hydroxybenzoic acid 7 (7.52 g, 29.7 mmol) was dissolved with dry potassium carbonate (20.52 g, 148 mmol) in DMF (150 ml, 0.2 M) in presence of dry ether-18-crown-6 and potassium iodide. 2-Ethylhexylbromide
1 Dhaneshwar, S. S.; Chail, M.; Patil, M.; Naqvi, S.; Vadnerkar, G. Colon-specific mutual amide prodrugs of 4-aminosalicylic acid for
their mitigating effect on experimental colitis in rats. Eur. J. Med. Chem., 2009, 44, 131-142.
(12.74 ml, 71.3 mmol) was added to the solution under a gentle flow of argon. The solution was then heated at reflux (95°C) for 72 hours. The suspension was pourred into water and left one night precipitating. Product was filtered off and redissolved in DCM. Solution was dried and the solvent removed under reduced presssure. Product was dried on a Schlenk line and purified by column chromatography using ethyl acetate/hexane (1:4) as eluent to obtain a slightly red oil 8 (13g, 27.2 mmol, 92%). 1H NMR (360 MHz, CHLOROFORM-d) δ ppm 0.75 - 1.00 (m, 12 H) 1.02 - 1.58 (m, 25 H) 1.67 (dd, J=10.9, 5.4 Hz, 2 H) 3.43 - 4.34 (m, 4 H) 6.84 (d, J=8.6 Hz, 1 H) 7.40 (br. s., 1 H) 7.73 (d, J=8.4 Hz, 1 H) 7.84 (br. s., 1 H). 13C NMR (91 MHz,
CHLOROFORM-d) δ ppm 10.19 - 11.13 (2 Cp) 13.74 (2 Cp) 21.81 - 24.34 (4 Cs) 27.96 (3 Cp) 28.38 - 29.14 (2 Cs) 29.71 - 30.60 (2 Cs) 38.30 -
39.57 (2 Ct) 64.72 (1 Cs) 66.61 (1 Cs) 67.57 (1 Cs) 70.60 (1 Cs) 80.18 (1 Cq) 102.01 (1 Ct) 108.88 (1 Ct) 113.62 (1 Cq) 132.56 (1 Ct) 143.90 (1 Cq) 152.45 (1 Cq) 160.25 (1 Cq) 165.99 (1 Cq).
2-(2-Ethylhexyloxy)-4-amino benzoic acid (9)
2-Ethylhexyl 4-((tert-butoxycarbonyl)amino)-2-((2-ethylhexyl) oxy)benzoate 8 (13 g, 27.2 mmol) was dissolved in a methanol/water (1:1, 50 ml, 0.5 M) mixture in presence of sodium hydroxyde (4.3 g, 108.8 mmol) and heated at reflux during five hours. Concentrated hydrochloric acid (37%) was added to the solution. The pH of the solution was adjusted to around 7 using sodium bicarbonate. Product was then extracted with DCM. The solution was dried and the solvent removed. The resulting yellowish oil was dissolved in a DCM trifluoroacetic acid (1:1, 25 ml, 1 M) mixture and heated at 40°C for three hours. The solution was then washed with a saturated solution of sodium carbonate and then with brine. The organic layer was dried with magnesium sulfate, the solvent removed and the crude product purified by column chromatography using ethyl acetate/hexane (1:3) as eluent to obtain 2-(2-ethylhexyloxy)-4-amino benzoic acid 9 as a yellow solid (6.13 g, 23 mmol, 85 %). 1
H NMR (400 MHz, CHLOROFORM-d) δ ppm 0.80 - 1.05 (m, 6 H) 1.29 - 1.59 (m, 8 H) 1.71 - 1.90 (m, 1 H) 4.06 (d, J=5.4 Hz, 2 H) 6.27 (d, J=2.1 Hz, 1 H) 6.37 (dd, J=8.6, 2.1 Hz, 1 H) 7.95 (d, J=8.6 Hz, 1 H) 9.08 - 12.41 (m, 1 H). 13C NMR (101 MHz, CHLOROFORM-d) δ ppm 10.03 (1 Cp) 13.28 (1 Cp) 22.83 (1 Cs) 23.88 (1 Cs) 28.88 (1 Cs) 30.46 (1 Cs) 38.41 (1 Ct) 72.06 (1 Cs) 95.90 (1 Ct) 107.09 (1 Cq) 107.82 (1 Ct) 134.72 (1 Ct) 152.76 (1 Cq) 159.58 (1 Cq) 165.81 (1 Cq). Ethyl 4-amino-2-((2-ethylhexyl)oxy)benzoate (10)
2-(2-Ethylhexyloxy)-4-amino benzoic acid 9 (2.5 g, 9.42 mmol) was dissolved in DCM (18.84 ml, 0.5 M) in presence of DMAP (0.23 g, 1.884 mmol) and ethanol (5.5 ml, 94 mmol) and cooled to 0°C. DCC (2 g, 9.69 mmol) was added and the solution was stirred 5 minutes. Solution was allowed to warm to room temperature and stirred overnight. The precipitate was filtered off and the solvent removed. The product was purified by column chromatography using ethyl acetate/hexane (3:1) as eluent to obtain the product 10 as a orange liquid (2.51 g, 8.55 mmol, 91%). 1
H NMR (400 MHz, CHLOROFORM-d) δ ppm 0.76 - 1.04 (m, 6 H) 1.21 - 1.67 (m, 11 H) 1.67 - 1.85 (m, 1 H) 3.76 - 3.87 (m, 2 H) 3.88 - 4.07 (m, 1 H) 4.29 (q, J=7.1 Hz, 2 H) 6.09 - 6.30 (m, 2 H) 7.73 (d, 1 H). 13 C NMR (101 MHz, CHLOROFORM-d) δ ppm 10.99 (1 Cp) 13.82 (1 Cp) 14.40 (1 Cp) 22.43 (1 Cs) 23.22 (1 Cs) 28.37 (1 Cs) 29.53 (1 Cs) 39.39 (1 Ct) 56.56 (1 Cs) 67.40 (1 Cs) 98.47 (s1 Ct) 106.20 (1 Ct) 107.37 (1 Cq) 134.18 (1 Ct) 150.09 (1 Cq) 159.15 (1 Cq) 166.11 (1 Cq). Ethyl 2-((2-ethylhexyl)oxy)-4-(isopropylamino)-benzoate (M2)
Ethyl 4-amino-2-((2-ethylhexyl)oxy)benzoate 10 (120 mg, 409 μmol) was dissolved in DCM (409 μl, 1 M) with acetone (60.1 μl, 818 μmol) and acetic acid (117 μl, 2.045 mmol). Sodium triacetoxyborohydride (173 mg, 818 μmol) was added and the solution was stirred overnight. The reaction was quenced using sodium bicarbonate solution. The organic layer was recovered and dried. The product was purified by column chromatography using ethyl acetate/hexane (1:4) as eluent to obtain M2 (80 mg, 238 μmol, 58%). 1H NMR (400 MHz, THF) δ ppm 0.82 - 1.02 (m, 6 H) 1.18 (d, J=6.2 Hz, 6 H) 1.22 - 1.39 (m, 7 H) 1.39 - 1.71 (m, 5 H) 3.65 (d, J=7.8 Hz, 1 H) 3.84 (t, J=5.0 Hz, 2 H) 4.18 (q, J=7.2 Hz, 2 H) 5.26 (d, J=7.9 Hz, 1 H) 6.08 (d, J=2.1 Hz, 1 H) 6.11 (s, 1 H) 7.65 (d, 1 H). 13 C NMR (101 MHz, THF) δ ppm 11.75 (1 Cp) 14.66 (1 Cp) 15.21 (1 Cp) 23.12 (2 Cp) 23.68 (1 Cs) 24.48 (1 Cs) 29.27 (1 Cs) 30.92 (1 Cs) 40.94 (1 Ct) 44.50 (1 Ct) 58.88 (1 Cs) 69.56 (1 Cs) 97.14 (1 Ct) 104.73 (1 Ct) 107.59 (1 Cq) 134.99 (1 Ct) 152.90 (1 Cq) 161.80 (1 Cq) 166.01 (1 Cq). Ethyl 4-(allylamino)-2-((2-ethylhexyl)oxy)benzoate (M3)
To a stirring solution of ethyl 4-amino-2-((2-ethylhexyl)oxy)benzoate 10 (0.1 g, 341 μmol) in THF (682 μl, 0.5 M) with DIPEA (119 μl, 682 μmol) at 0°C, allyl bromide (29 μl, 341 μmol) was added drop by drop. The reaction was stirred 4 hours at 0°C and allowed to stirr overnight at room temperature. The solution was pourred into water and filtered. The product was purified by column chromatography using ethyl acetate/hexane (1:4) as eluent to obtain product M3 (30 mg, 90 μmol, 26%). 1H NMR (400 MHz, THF) δ ppm 0.84 - 0.99 (m, 6 H) 1.24 - 1.69 (m, 12 H) 3.75 - 3.81 (m, 2 H) 3.84 (t, J=4.8 Hz, 2 H) 4.18 (q, J=7.1 Hz, 2 H) 5.10 (dd, J=10.3, 1.6 Hz, 1 H) 5.24 (dd, J=17.2, 1.8 Hz, 1 H) 5.55 - 5.71 (m, 1 H) 5.81 - 6.01 (m, 1 H) 6.10 - 6.15 (m, 2 H) 7.64 (d, J=8.4 Hz, 1 H). 13C NMR (101 MHz, THF) δ ppm 11.61 (1 Cp) 14.42 (1 Cp) 14.61 (1 Cp) 24.03 (1 Cs) 24.76 (1 Cs) 30.16 (1 Cs) 31.52 (1 Cs) 40.85 (1 Ct) 46.50 (1 Cs) 60.52 (1 Cs) 70.85 (1 Cs) 96.81 (1 Ct) 104.69 (1 Ct) 108.94 (1 Cq) 115.92 (1 Cs) 134.69 (1 Ct) 136.51 (1 Ct) 154.58 (1 Cq) 162.33 (1 Cq) 166.21 (1 Cq).
Ethyl 2-((2-ethylhexyl)oxy)-4-((1-phenylethyl)amino)benzoate (M4)
Ethyl 4-amino-2-((2-ethylhexyl)oxy)benzoate 10 (0.5 g, 1.7 mmol) was dissolved with acetophenone (0.2 ml, 1.71 μmol) in toluene (5 ml, 0.34 M) and refluxed under Dean-Stark conditions during 3 days. Solution was cooled to room temperature and the solvent was evaporated under reduced pressure. The imine was dissolved in a mixture of methanol and THF (1:1, 14 ml, 0.05 M), placed under argon athmosphere and cooled to 0°C before sodium borohydride (64 mg, 1.7 mmol) was added. Solution was warmed to room temperature and stirred overnight. Water was added and the mixture was extracted with DCM (3 x 10 ml). The organic phase was washed wiht brine and dried over magnesium sulfate. The solvent was removed under reduced pressure and the product purified by column chromatography with neutral aluminium oxide as adsorbant using DCM/hexane (3:1) as eluent to obtain product M4 (100 mg, 0.25 mmol, 15%). 1
H NMR (400 MHz, CHLOROFORM-d) δ ppm 0.80 - 1.06 (m, 6 H) 1.18 - 1.69 (m, 14 H) 1.69 - 1.82 (m, 1 H) 3.70 - 4.00 (m, 2 H) 4.11 (br. s., 1 H) 4.30 (qt, J=7.1, 1.4 Hz, 2 H) 6.09 - 6.30 (m, 2 H) 7.25 - 7.30 (m, 1 H) 7.31 - 7.43 (m, 4 H) 7.74 (dt, J=8.3, 1.4 Hz, 1 H). 13C NMR (101 MHz, CHLOROFORM-d) δ ppm 11.03 (1 Cp) 14.04 (1 Cp) 14.57 (1 Cp) 22.97 (1 Cs) 23.64 (1 Cs) 24.58 (1 Ct) 29.03 (1 Cs) 30.32 (1 Cs) 39.31 (1 Ct) 53.23 (1 Ct) 59.77 (1 Cs) 70.49 (1 Cs) 95.93 (1 Ct) 103.98 (1 Ct) 108.28 (1 Cq) 125.65 (2 Ct) 127.06 (1 Ct) 128.69 (2 Ct) 134.17 (1 Ct) 144.34 (1 Cq) 151.79 (1 Cq) 161.29 (1 Cq) 166.55 (1 Cq). 4-((2-ethylhexyl)amino)benzoic acid (11)
Para-aminobenzoic acid (10 g, 72.9 mmol) was dissolved with 2-ethylhexanal (12.51 ml, 80 mmol) in a mixture of MeOH (130
ml, 0.5 M) and acetic acid (20 ml) and was cooled to 0°C. Solution was stirred 1 hour before addition of sodium triacetoxyborohydride (30.9 g, 146 mmol). The solution was stirred overnight at room temperature and quenched with a saturated solution of sodium bicarbonate (100 ml). Product was extracted with DCM, dried over magnesium sulfate and the solvent was removed under reduced pressure. The product was purified by column chromatography using ethyl acetate/hexane (1:3) as eluent to obtain 11 (16.73 g, 67.1 mmol, 92%). 1
H NMR (300 MHz, CHLOROFORM-d) δ ppm 0.78 - 1.04 (m, 6 H) 1.19 - 1.44 (m, 9 H) 1.57 (d, J=6.0 Hz, 1 H) 3.09 (d, J=6.2 Hz, 2 H) 6.56 (d, J=8.8 Hz, 2 H) 7.94 (d, J=8.8 Hz, 2 H). 13 C NMR (75 MHz, CHLOROFORM-d) δ ppm 10.73 (1 Cp) 12.71 (1 Cp) 22.36 (1 Cs) 23.57 (1 Cs) 27.96 (1 Cs) 30.04 (1 Cs) 38.88 (1 Ct) 44.64 (1 Cs) 111.15 (1 Ct) 114.87 (1 Cq) 132.20 (1 Ct) 149.98 (1 Cq) 170.06 (1 Cq). Ethyl 4-((2-ethylhexyl)amino)benzoate (M5)
To a stirring solution of 4-((2-ethylhexyl)amino)benzoic acid 11 (1 g, 4.02 mmol) with DMAP (98 mg, 802 μmol) and ethanol (1 ml, 17.13 mmol) in dry DCM (10 ml, 0.4 M) at 0°C, DCC (910 mg, 4.41 mmol) was added. The solution was stirred for 5 min at 0°C and then allow to stir further 3 hours at room temperature. The suspension was filtered and the solvent removed under reduced pressure. The residue was redissolved in DCM and washed with 0,5 M HCl and saturated sodium bicarbonate solution. The organic phase was dried over magnesium sulfate and the solvent was removed. The product purified by column chromatography using ethyl acetate/hexane (1:4) as eluent to obtain product M5 as a transparent oily liquid (0.99 g, 3.57 mmol, 89%). 1H NMR (400 MHz, CHLOROFORM-d) δ ppm 0.66 - 1.16 (m, 6 H) 1.18 - 1.49 (m, 11 H) 1.49 - 1.72 (m, 1 H) 3.07 (t,
J=5.9 Hz, 2 H) 4.05 - 4.27 (m, 1 H) 4.32 (q, J=7.2 Hz, 2 H) 6.23 - 6.79 (dd, 2 H) 7.87 (dd, 2 H). 13
C NMR (101 MHz, CHLOROFORM-d) δ ppm 10.45 (1 Cp) 13.63 (1 Cp) 14.04 (1 Cp) 22.69 (1 Cs) 23.86 (1 Cs) 28.29 (1 Cs) 30.27 (1 Cs) 38.59 (1 Ct) 45.47 (1 Cs) 58.99 (1 Cs) 110.80 (1 Ct) 117.00 (1 Cq) 131.06 (1 Ct) 151.53 (1 Cq) 166.42 (1 Cq).
Figure S2 MALDI-TOF mass spectrum of poly(M1).
Side reaction studies
General procedure for the phenyl ester substitutions.
LiHMDS or KHMDS (90 μl, 1 M) was dried on a Schlenk line. Phenyl benzoate (18 mg, 90 μmol) in deuterated THF (0.75 ml, 0.12 M) was added to the base and transferred into an NMR tube. 1H NMR were recorded on 400 MHz spectrometer.
Figure S3 1H NMR spectrum (300 MHz, THF-d
8) of phenyl benzoate with LiHMDS over time.
Figure S4 1
General procedure for the imine formation.
LiHMDS or KHMDS (90 μl, 1 M) was dried on a Schlenk line. N-benzylaniline derivatives (100 μmol) in deuterated THF (0.75 ml, 0.13 M) was added to the base and transferred into an NMR tube. 1H NMR were recorded on 400 MHz spectrometer.
N-PMB-ANILINE - H IN THF-D8.ESP
8.5 8.0 7.5 7.0 6.5 6.0 5.5 5.0 4.5 4.0 Chemical Shift (ppm) 2.00 0.93 3.11 2.27 2.06 1.96 7.2 7 7.2 4 7.0 4 7.0 1 6.9 9 6.8 5 6.8 2 6.5 7 6.5 4 6.5 2 5.1 8 4.2 1 4.1 9
N-PMB-ANILINE - H IN THF-D8 + LIHMDS.ESP
2.00 11.02 0.20 0.10 8.3 6 7.8 2 7.7 9 7.1 4 7.1 3 7.1 2 7.1 0 7.0 7 7.0 2 7.0 2 6.9 6 6.7 7 6.7 4 6.7 1 6.6 5 6.6 2 6.5 2 6.5 0 6.4 7 4.3 8 4.1 6 Reactant Figure S5 1
H NMR spectrum (300 MHz, THF-d8) of the reaction between N-PMB-aniline and LiHMDS.
N-PMB-ANILINE - H IN THF-D8 (FOR KHMDS).ESP
8.5 8.0 7.5 7.0 6.5 6.0 5.5 5.0 4.5 4.0 Chemical Shift (ppm) 2.03 0.93 3.18 0.31 2.30 2.11 2.00 4.2 3 4.2 4 5.2 3 6.5 5 6.5 8 6.6 0 6.8 5 6.8 8 7.0 2 7.0 5 7.0 5 7.0 8 7.2 8 7.3 0
N-PMB-ANILINE - H IN THF-D8 + KHMDS.ESP
2.00 1.13 2.11 4.53 2.04 0.16 0.08 4.0 6 4.4 4 6.0 4 6.0 6 6.0 8 6.2 2 6.2 4 6.5 5 6.6 7 6.7 0 6.7 9 6.8 0 6.8 3 6.8 4 6.8 4 6.8 7 7.0 7 7.0 8 7.1 2 7.1 5 7.2 4 7.2 7 7.2 8 7.8 5 7.8 8 8.4 2 Reactant Figure S6 1
H NMR spectrum (300 MHz, THF-d8) of the reaction between N-PMB-aniline and KHMDS
N-DMB-ANILINE - H IN THF-D8.ESP 8.5 8.0 7.5 7.0 6.5 6.0 5.5 5.0 4.5 4.0 Chemical Shift (ppm) 2.00 0.93 1.11 4.56 2.23 1.00 7. 17 7.15 7.03 7. 00 7.00 6. 97 6. 55 6. 54 6.52 6. 52 6. 50 6. 49 6. 41 6. 40 6.39 6. 38 5. 02 4.40 4. 20 4. 19
N-DMB-ANILINE - H IN THF-D8 + LIHMDS.ESP
2.00 1.53 5.79 2.57 1.44 0.32 0.16 0.16 Reactant Figure S7 1H NMR spectrum (300 MHz, THF-d
8) of the reaction between N-DMB-aniline and LiHMDS
N-DMB-ANILINE - H IN THF-D8 (FOR KHMDS).ESP
8.5 8.0 7.5 7.0 6.5 6.0 5.5 5.0 4.5 4.0 Chemical Shift (ppm) 2.04 0.97 0.99 4.11 2.11 1.00 7.2 1 7.1 8 7.0 6 7.0 4 7.03 7.0 1 6.5 8 6.5 5 6.5 4 6.53 6.5 3 6.4 5 6.4 4 6.4 2 6.4 1 5.0 8 4.4 3 4.2 4 4.2 2
N-DMB-ANILINE - H IN THF-D8 + KHMDS.ESP
2.00 3.03 1.30 2.05 2.10 1.77 0.51 0.24 0.23 8.7 7 8.0 9 8.0 6 7.2 9 7.2 7 7.1 5 7.1 2 7.1 0 7.1 0 6.8 6 6.8 4 6.8 4 6.8 1 6.6 1 6.5 66.5 2 6.5 2 6.4 1 6.4 0 6.3 8 6.2 2 6.1 9 6.1 2 6.1 0 4.3 8 4.0 3 Reactant Figure S8 1H NMR spectrum (300 MHz, THF-d
8) of the reaction between N-DMB-aniline and KHMDS
BMP2-001+LIHMDS - H.ESP 7.5 7.0 6.5 6.0 5.5 5.0 4.5 4.0 3.5 3.0 Chemical Shift (ppm) 9.06 1.92 0.99 2.91 2.04 0.95 7 .1 3 7 .1 1 6 .7 3 6 .7 3 6.70 6 .6 8 6 .6 6 6.5 1 6.4 9 6 .4 0 6 .3 9 6 .3 7 6 .3 6 4 .2 0 3 .7 9 3 .7 5 3 .7 0 3 .5 8 3 .5 7 3 .5 7 3 .5 6 3 .5 5 BMP2-001 - H.ESP 9.00 2.07 1.92 1.87 1.03 0.96 1.10 7 .2 7 7.25 7.23 6 .8 8 6 .8 8 6 .8 1 6 .7 9 6 .6 9 6 .6 6 6 .5 2 6.51 6 .4 8 6 .4 5 6 .4 5 4 .3 2 3 .8 8 3 .8 7 3 .8 6 Reactant Figure S9 1H NMR spectrum (300 MHz, THF-d
8) of the reaction between DMB-o-anisidine and LiHMDS
BMP2-002 - H.ESP 8.5 8.0 7.5 7.0 6.5 6.0 5.5 5.0 4.5 4.0 3.5 3.0 Chemical Shift (ppm) 6.19 2.03 1.01 2.02 1.88 2.14 2.00 7.3 5 7.3 2 6.9 3 6.9 0 6.8 8 6.81 6.8 0 6.7 3 6.6 6 6.6 6 4.3 2 4.3 0 3.8 7 3.8 3 BMP2-002 + LIHMDS - H.ESP 3.34 3.92 0.70 2.15 0.96 2.12 1.08 1.06 2.17 0.24 0.48 0.44 0.24 2.12 0.42 0.22 8.3 8 7.8 4 7.8 4 7.8 3 7.82 7.2 6 7.2 6 7.2 6 7.24 7.2 3 6.99 6.8 4 6.8 4 6.8 2 6.7 4 6.7 3 6.7 2 6.5 2 6.5 1 6.50 6.4 8 4.8 6 4.2 5 4.2 4 3.8 3 3.7 9 3.7 3 3.6 3 3.6 2 3.5 8 3.58 3.5 8 3.5 7 Reactant Figure S10 1
Figure S11 Electro-spray ionization mass spectrometry of the reaction between PMB-o-anisidine and LiHMDS. BMP1-135 - H (T=0) THF-D8.ESP 7.5 7.0 6.5 6.0 5.5 5.0 4.5 4.0 3.5 3.0 2.5 2.0 1.5 1.0 Chemical Shift (ppm) 3.07 1.02 0.98 3.05 1.98 1.20 2.00 2.00 1.4 3 1.4 5 4.4 2 4.4 4 4.4 7 5.1 3 5.1 5 6.4 7 6.5 0 6.5 0 6.5 0 6.5 2 6.9 4 6.9 7 7.0 0 7.1 0 7.2 3 7.3 3 7.3 6 7.3 6
BMP1-135 - H (T=1 H) + 2 EQ LIHMDS THF-D8.ESP
3.00 0.84 0.69 2.07 0.95 1.43 1.53 2.26 1.92 Reactant Figure S12 1H NMR spectrum (400 MHz, THF-d
BMP2-103 - H.ESP 7.5 7.0 6.5 6.0 5.5 5.0 4.5 4.0 3.5 3.0 2.5 2.0 1.5 1.0 Chemical Shift (ppm) 6.09 0.99 1.98 1.01 1.99 1.02 2.00 0.00 2.00 7. 53 7. 53 7. 50 7.50 7. 27 7. 25 6. 91 6. 88 6.88 6. 85 6. 46 6. 35 6. 34 6. 32 6. 31 1. 61 BMP2-103 - H + LDA.ESP 6.00 0.85 1.70 0.94 1.72 1.13 1.97 2.00 Reactant Figure S13 1H NMR spectrum (400 MHz, THF-d
8) of the reaction between N-(2-phenylpropan-2-yl)aniline and LiHMDS
BMP4-024 - H REACTANT.ESP 7.5 7.0 6.5 6.0 5.5 5.0 4.5 4.0 3.5 3.0 Chemical Shift (ppm) 1.96 0.93 2.13 1.02 3.03 2.00 7 .1 2 7 .1 2 7 .1 0 7 .1 0 7 .0 9 7 .0 7 7 .0 5 7 .0 5 6 .5 9 6 .5 8 6 .5 6 6 .5 6 6 .5 5 6 .5 5 5 .9 8 5 .9 7 5 .9 6 5 .9 4 5 .9 3 5 .9 1 5 .9 0 5 .8 9 5 .2 9 5 .2 8 5 .2 8 5 .2 4 5 .2 4 5 .1 85 .1 1 5 .1 1 5 .1 0 5 .0 8 5 .0 8 5 .0 7 4 .8 5 3 .7 3 3 .7 3 3 .7 1 3 .7 1 BMP4-024 - H + LIHMDS.ESP 2.02 0.55 2.26 1.12 2.84 2.00 6 .9 1 6 .4 1 6 .4 0 5 .9 5 5 .9 3 5 .9 2 5 .9 0 5 .8 9 5 .8 8 5.17 5 .1 3 5 .1 3 5 .1 2 5 .0 9 5 .0 8 4.98 4.96 3 .8 7 3 .8 5 3 .7 2 3.6 2 3 .6 1 3 .6 0 3 .6 0 3 .5 9 3 .5 7 Reactant Figure S14 1H NMR spectrum (400 MHz, THF-d
General procedure for the transamidation reactions
LiHMDS or KHMDS (1 ml, 1 M) was dried on a Schlenk line. N-Ethylaniline (0.14 ml, 1.11 mmol) and N-Methylbenzanilide (0.235 g, 1.11 mmol) in deuterated THF (1 ml, 1 M) were added to the base and 1H NMR were recorded first every 2 minutes, until the signals were stable, and then the time gaps between measurements were elongated up to 30 minutes. 1H NMR measurements were recorded on a 500 MHz spectrometer.
bado5631.400_001001r 7.0 6.5 6.0 5.5 5.0 4.5 4.0 3.5 3.0 2.5 2.0 1.5 1.0 0.5 0 Chemical Shift (ppm) 3.80 2.37 3.50 15.00 1.1 8 1.2 0 1.2 2 1.7 3 3.0 7 3.0 9 3.4 1 3.5 9 6.5 1 6.5 3 7.0 3 7.0 7 7.0 8 7.1 2 7.1 7 7.1 9 7.2 7 7.2 9 bado5631.400_099001r 3.86 1.47 1.19 2.03 1.02 15.00 0.0 5 1.1 5 1.1 7 1.1 9 1.2 0 1.2 1 1.7 7 1.7 8 1.7 9 2.7 5 3.0 8 3.0 9 3.4 1 3.6 1 3.6 2 3.6 4 3.9 3 3.9 5 7.1 0 7.1 1 7.1 7 7.1 7 7.2 6 7.2 7 7.2 8 TIme = 0 TIme = 7 hours Figure S15 1H NMR spectrum (500 MHz, THF-d
8) of the reaction between N-ethylaniline and N-methylbenzanilide and
LiHMDS
N-ETHYL-ANILINE + N-METHYL-BENZANILIDE + KHMDS T=0.ESP
7.5 7.0 6.5 6.0 5.5 5.0 4.5 4.0 3.5 3.0 2.5 2.0 1.5 1.0 Chemical Shift (ppm) 3.00 1.92 2.81 0.88 2.63 6.32 2.78 1.71 1.1 8 1.2 0 1.2 2 1.7 3 3.0 9 3.4 1 3.5 9 4.6 4 6.4 9 6.5 1 6.5 3 7.0 1 7.0 3 7.0 3 7.0 7 7.0 8 7.1 2 7.1 7 7.1 9 7.2 7 7.2 8 7.2 9
N-ETHYL-ANILINE + N-METHYL-BENZANILIDE + KHMDS END.ESP
1.77 2.94 3.00 2.06 1.62 1.04 0.89 2.70 1.89 4.03 7.76 1.66 1.2 1 1.2 2 1.2 5 1.2 7 1.2 9 1.8 0 1.8 0 1.8 2 1.8 3 1.8 3 1.8 3 1.8 4 1.8 5 1.8 6 2.8 0 3.0 5 3.0 6 3.0 8 3.1 0 3.4 7 3.6 5 3.6 7 3.6 8 3.7 0 3.9 9 4.0 1 4.0 2 6.1 6 6.3 1 6.3 1 6.3 3 6.3 3 6.4 1 6.4 3 6.9 4 6.9 4 6.9 8 6.9 9 7.1 7 7.1 8 7.2 3 7.2 5 7.2 5 7.3 2 Time = 7 hours Time = 0 Figure S16 1
H NMR spectrum (500 MHz, THF-d8) of the reaction between N-ethylaniline and N-methylbenzanilide and
Polymerization of M2 to M5.
All polymers were prepared following the same reaction sequence whereby LiHMDS was cooled to the desired temperature before addition of phenylbenzoate and finally a THF solution of the monomer.
Table SI-1. Molecular weights (GPC, THF) of polymers prepared from M2 - M5
Entry Monomer Temperature LiHMDS (eq.) Initiator
(eq.) Mn Mw PDI 1 M2 0°C 1.1 0.01 1200 1200 1.012 2 M3 -20°C 1.1 0.01 2500 2900 1.15 3 M3 0°C 1.1 0.01 2800 3300 1.14 4 M4 0°C 1.1 0.01 1900 2100 1.06 5 M5 0°C 1.1 0.01 4800 6600 1.37
aGPC was measured in THF using UV detection
Analysis of polymers M6 to M11.
Figure S17 Poly(M8) (table 3 entry 3). MALDI-TOF mass spectrum (matrix: DCTB). The green distribution shows the non initiated oligomers.
Figure S18 Poly(M9) (table 3 entry 4). MALDI-TOF mass spectrum (matrix: DCTB with NaTFA). The green distribution shows the non initiated and ester substituted oligomers.
BMPP5-01 - H.ESP 7.5 7.0 6.5 6.0 5.5 5.0 4.5 4.0 3.5 3.0 2.5 2.0 1.5 1.0 0.5 Chemical Shift (ppm) 6.43 8.56 1.19 1.96 1.97 2.00 DCM Chloroform 0.7 4 0.7 6 0.8 5 0.8 6 1.2 2 1.2 6 1.2 8 1.3 0 1.4 8 3.7 9 6.7 7 6.7 9 7.0 3 7.0 5 7.2 7
Figure S19 1H-NMR spectrum (400 MHz, chloroform-d
Figure S20 19F NMR spectra (376 MHz, chloroform-d
1) of the reactant M10 (top) and the crude poly(M10) (table 3 entry 7,
bottom). Only traces of the pentafluorophenol are visible, showing ester substitution by LiHMDS.
Figure S21 poly(M10). Gel permeation chromatography elugram in chloroform. Table 4 entry 4.
-‐2 3 8 13 18 23
Figure S22 Poly(M10) (table 4 entry 5). MALDI-TOF mass spectrum (matrix: DCTB and NaTFA). BMP5-461 - H RECRYST.ESP 8.5 8.0 7.5 7.0 6.5 6.0 5.5 5.0 4.5 4.0 3.5 3.0 Chemical Shift (ppm) 6.22 2.05 0.97 1.02 0.99 2.04 1.00 2.00 3.8 2 3.8 2 3.8 6 4.3 6 4.7 7 6.4 6 6.4 8 6.4 8 6.5 1 6.5 2 6.6 5 6.6 8 7.1 7 7.1 9 7.9 9 8.0 1 BMPP5-08E - H.ESP 3.00 3.12 2.02 0.98 1.03 2.00 2.01 1.07 3.4 6 3.7 1 4.9 5 6.3 1 6.3 1 6.3 5 6.3 7 6.6 5 6.6 7 6.9 7 6.9 9 7.1 5 7.1 7 7.2 7 N O O O O O F F F F F NH O O F F F F F O O Figure S23 Poly(M11). 1
BMP5-461 - F RECRYST.ESP -125 -130 -135 -140 -145 -150 -155 -160 -165 -170 -175 -180 -185 -190 -195 -200 Chemical Shift (ppm) 2.24 1.01 2.00 BMPP5-08E - F.ESP 2.08 1.57 2.00 Reactant Figure S24 Poly(M11). 19
F NMR spectra (376 MHz, chloroform-d1) of the monomer M11 (bottom) and the polymer (top).
The polymer is terminated with PFP ester.
Figure S25 Poly(M11). Gel permeation chromatography elugram in chloroform. Mn 44'000, Mw 141'000, PDI 3.2.
0 5 10 15 20 25 30
Figures S26. GPC elugrams of table 1, table SI-1, table 3 and table 4.
Poly(M1) table 1 entry 1 (UV trace of the THF GPC)
Poly(M1) table 1 entry 2 (UV trace of the THF GPC)
Poly(M1) table 1 entry 3 (UV trace of the THF GPC)
Poly(M1) table 1 entry 4 (UV trace of the THF GPC)
0 5 10 15 20 25 30 t/min 0 5 10 15 20 25 30 t/min 0 5 10 15 20 25 30 t/min 0 5 10 15 20 25 30 t/min
Poly(M2) table SI-1 entry 1 (UV trace of the THF GPC)
Poly(M3) table SI-1 entry 2 (UV trace of the THF GPC)
Poly(M3) table SI-1 entry 3 (UV trace of the THF GPC)
Poly(M4) table SI-1 entry 4 (UV trace of the THF GPC)
0 5 10 15 20 25 30 t/min 0 5 10 15 20 25 30 t/min 0 5 10 15 20 25 30 t/min 0 5 10 15 20 25 30 t/min
Poly(M5) table SI-1 entry 5 (UV trace of the THF GPC)
Poly(M6) table 3 entry 1 (UV trace of the THF GPC)
Poly(M7) table 3 entry 2 (UV trace of the THF GPC)
Poly(M8) table 3 entry 3 (UV trace of the THF GPC)
0 5 10 15 20 25 30 t/min 0 5 10 15 20 25 30 t/min 0 5 10 15 20 25 30 t/min 0 5 10 15 20 25 30 t/min
Poly(M9) table 3 entry 4 (UV trace of the THF GPC)
Poly(M9) table3 entry 5 (UV trace of the THF GPC)
Poly(M10) table 3 entry 6 (UV trace of the THF GPC)
Poly(M10) table 3 entry 7 (UV trace of the THF GPC)
0 5 10 15 20 25 30 t/min 0 5 10 15 20 25 30 t/min 0 5 10 15 20 25 30 t/min 0 5 10 15 20 25 30 t/min
Poly(M10) table 3 entry 8 (UV trace of the THF GPC)
Poly(M10) table 4 entry 1 (UV trace of the THF GPC)
Poly(M10) table 4 entry 2 (UV trace of the THF GPC)
Poly(M10) table 4 entry 3 (UV trace of the THF GPC)
0 5 10 15 20 25 30 t/min 0 5 10 15 20 25 30 t/min 0 5 10 15 20 25 30 t/min 0 5 10 15 20 25 30 t/min
Poly(M10) table 4 entry 4 (RI trace of the THF GPC)
Poly(M10) table 4 entry 5 (UV trace of the THF GPC)
Poly(M10) table 4 entry 6 (UV trace of the THF GPC)
0 5 10 15 20 25 30 t/min 0 5 10 15 20 25 30 t/min 0 5 10 15 20 25 30 t/min