Article title: Invasive alien plants benefit more from clonal integration in heterogeneous environments than natives
Authors: Yong-Jian Wang, Heinz Müller-Schärer, Mark van Kleunen, Ai-Ming Cai, Ping Zhang, Rong Yan, Bi-Cheng Dong and Fei-Hai Yu
Article acceptance date: 29 August 2017
The following Supporting Information is available for this article:
Fig. S1 Leaf mass (a, d and g), clonal organ mass (b, e and h), and root mass (c, f and i) of the recipient ramets (a-c), the donor ramets (d-f) and the whole clone (g-i) of the invasive alien and native clonal species when the clone was grown in heterogeneous light, nutrient and water conditions
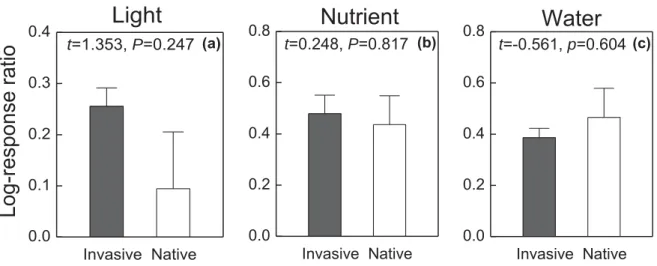
Fig. S2 Differences in the relative benefit of clonal integration, measured as the log-response ratio of biomass of intact clones to biomass of severed clones per species, between alien invasive and native species in the experimental heterogeneous light (a), nutrient (b) and water (c)
conditions
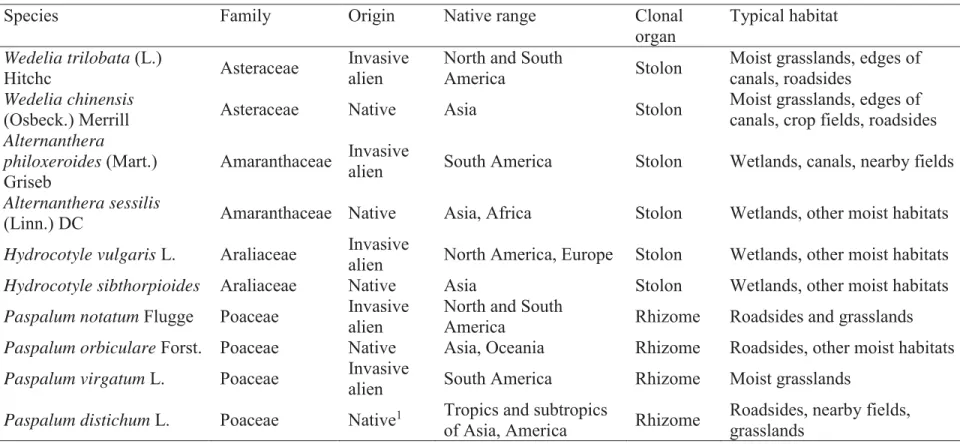
Table S1 Clonal plant species used in the experiment
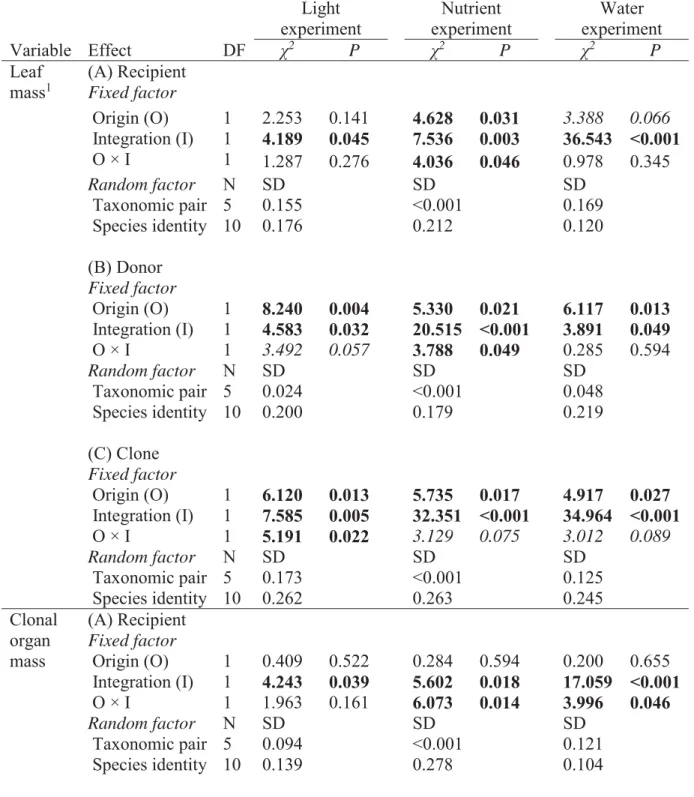
Table S2 Results of generalized linear mixed models testing effects of origin and integration on leaf mass, clonal organ mass and root mass of the recipient ramets (A), the donor ramets (B) and the whole clone (C) when the clone was grown in heterogeneous light, nutrient and water
Fig. S1 Leaf mass (a, d and g), clonal organ mass (b, e and h), and root mass (c, f and i) of the recipient ramets (a-c), the donor ramets (d-f) and the whole clone (g-i) of the invasive alien and native clonal species when the clone was grown in heterogeneous light,
nutrient and water conditions. Means ± SEs are given.
0.0 0.2 0.4 0.6 0.8 1.0 Recipient (b) 0.0 0.5 1.0 1.5 Invasive Native (a) 0.0 0.2 0.4 0.6 (c) 0.0 0.5 1.0 1.5 2.0 (Leaf mass)^0.5 (g) (d) 0.0 0.2 0.4 0.6 0.8 1.0 Root mass (g) (f) Intact
Severed IntactSevered IntactSevered
0.0 0.5 1.0 1.5 2.0
Light Nutrient Water
(g)
Intact
Severed IntactSevered IntactSevered
0 1 2 3
Light Nutrient Water
Clone
(h)
Intact
Severed IntactSevered IntactSevered
0.0 0.5 1.0 1.5
Light Nutrient Water
(i) 0.0 0.5 1.0 1.5 2.0 Donor
Clonal organ mass (g)
Fig. S2 Differences in the relative benefit of clonal integration, measured as the log-response ratio of biomass of intact clones to biomass of severed clones per species, between alien invasive and native species in the experimental heterogeneous light (a), nutrient (b) and water (c)
conditions. Means ± SEs are given. Values of t and P are based on paired t-tests (n = 5 pairs of invasive and native species).
0.0 0.1 0.2 0.3 0.4 Invasive Native
Log-r
esponse ratio
(a) t=1.353, P=0.247Light
0.0 0.2 0.4 0.6 0.8Nutrient
Invasive Native t=0.248, P=0.817 (b) 0.0 0.2 0.4 0.6 0.8Water
Invasive Native t=-0.561, p=0.604 (c)Table S1 Clonal plant species used in the experiment.
Species Family Origin Native range Clonal
organ Typical habitat Wedelia trilobata (L.) Hitchc Asteraceae Invasive alien
North and South
America Stolon
Moist grasslands, edges of canals, roadsides
Wedelia chinensis
(Osbeck.) Merrill Asteraceae Native Asia Stolon Moist grasslands, edges of canals, crop fields, roadsides
Alternanthera
philoxeroides (Mart.)
Griseb
Amaranthaceae Invasive alien South America Stolon Wetlands, canals, nearby fields
Alternanthera sessilis
(Linn.) DC Amaranthaceae Native Asia, Africa Stolon Wetlands, other moist habitats
Hydrocotyle vulgaris L. Araliaceae Invasive alien North America, Europe Stolon Wetlands, other moist habitats
Hydrocotyle sibthorpioides Araliaceae Native Asia Stolon Wetlands, other moist habitats
Paspalum notatum Flugge Poaceae Invasive alien North and South America Rhizome Roadsides and grasslands
Paspalum orbiculare Forst. Poaceae Native Asia, Oceania Rhizome Roadsides, other moist habitats
Paspalum virgatum L. Poaceae Invasive
alien South America Rhizome Moist grasslands
Paspalum distichum L. Poaceae Native1 Tropics and subtropics
of Asia, America Rhizome
Roadsides, nearby fields, grasslands
Origin and habitat information are based on the Flora of China (www.efloras.org), Scientific Database of China Plant Species (DCP) (http://www.plants.csdb.cn/eflora) and other references He (2012) and Wan et al. (2012).1The native status of this species in China is not fully resolved, with some references to support this, and exclusion of the species and the species pair which it is part of does not change the results qualitatively (results not shown).
References
Wan FH, Liu QR, Xie M. 2012. Biological invasions: color illustrations of invasive alien plants in China. Beijing, China: Science Press.
Table S2 Results of generalized linear mixed models for effects of origin and integration on leaf mass, clonal organ mass and root mass of the recipient ramets (A), the donor ramets (B) and the whole clone (C) when the clone was grown in heterogeneous light, nutrient and water conditions
Light experiment Nutrient experiment Water experiment Variable Effect DF χ2 P χ2 P χ2 P
Leaf (A) Recipient
mass1 Fixed factor
Origin (O) 1 2.253 0.141 4.628 0.031 3.388 0.066 Integration (I) 1 4.189 0.045 7.536 0.003 36.543 <0.001 O × I 1 1.287 0.276 4.036 0.046 0.978 0.345 Random factor N SD SD SD Taxonomic pair 5 0.155 <0.001 0.169 Species identity 10 0.176 0.212 0.120 (B) Donor Fixed factor Origin (O) 1 8.240 0.004 5.330 0.021 6.117 0.013 Integration (I) 1 4.583 0.032 20.515 <0.001 3.891 0.049 O × I 1 3.492 0.057 3.788 0.049 0.285 0.594 Random factor N SD SD SD Taxonomic pair 5 0.024 <0.001 0.048 Species identity 10 0.200 0.179 0.219 (C) Clone Fixed factor Origin (O) 1 6.120 0.013 5.735 0.017 4.917 0.027 Integration (I) 1 7.585 0.005 32.351 <0.001 34.964 <0.001 O × I 1 5.191 0.022 3.129 0.075 3.012 0.089 Random factor N SD SD SD Taxonomic pair 5 0.173 <0.001 0.125 Species identity 10 0.262 0.263 0.245
Clonal (A) Recipient organ Fixed factor
mass Origin (O) 1 0.409 0.522 0.284 0.594 0.200 0.655
Integration (I) 1 4.243 0.039 5.602 0.018 17.059 <0.001 O × I 1 1.963 0.161 6.073 0.014 3.996 0.046 Random factor N SD SD SD Taxonomic pair 5 0.094 <0.001 0.121 Species identity 10 0.139 0.278 0.104 (B) Donor Fixed factor
Origin (O) 1 1.886 0.176 0.031 0.861 0.034 0.853 Integration (I) 1 9.930 0.002 11.991 <0.001 10.301 0.001 O × I 1 1.085 0.298 0.435 0.510 0.203 0.652 Random factor N SD SD SD Taxonomic pair 5 0.328 0.218 0.387 Species identity 10 0.389 0.360 0.386 (C) Clone Fixed factor Origin (O) 1 0.402 0.526 0.184 0.668 0.011 0.914 Integration (I) 1 4.569 0.033 26.593 <0.001 37.194 <0.001 O × I 1 10.719 0.001 7.158 0.008 0.050 0.823 Random factor N SD SD SD Taxonomic pair 5 0.392 <0.001 0.330 Species identity 10 0.488 0.724 0.503
Root (A) Recipient
mass Fixed factor
Origin (O) 1 3.421 0.066 4.172 0.041 2.154 0.142 Integration (I) 1 18.939 <0.001 0.202 0.653 17.533 <0.001 O × I 1 3.821 0.048 4.352 0.037 3.212 0.075 Random factor N SD SD SD Taxonomic pair 5 0.082 0.125 0.081 Species identity 10 <0.001 0.057 <0.001 (B) Donor Fixed factor Origin (O) 1 5.090 0.024 2.202 0.138 2.686 0.099 Integration (I) 1 4.028 0.044 11.771 <0.001 5.533 0.019 O × I 1 4.897 0.029 4.331 0.037 22.457 <0.001 Random factor N SD SD SD Taxonomic pair 5 0.159 0.169 0.138 Species identity 10 0.097 0.085 0.136 (C) Clone Fixed factor Origin (O) 1 5.246 0.022 3.005 0.083 3.630 0.057 Integration (I) 1 5.576 0.019 7.111 0.008 24.387 <0.001 O × I 1 3.968 0.044 5.817 0.016 13.697 <0.001 Random factor N SD SD SD Taxonomic pair 5 0.248 0.282 0.219 Species identity 10 0.121 0.162 0.133
1Data were square-root transformed. Values are in bold when P<0.05 and in italic when 0.05<P<0.1.