*To whom correspondence should be addressed.
Abbreviations: 2D, 3D, two-, three-dimensional; TOCSY, total correlation spectroscopy; NOE, nuclear Overhauser enhancement; NOESY, nuclear Overhauser enhancement spectroscopy; REDAC, use of redundant dihedral angle constraints; rmsd, root-mean-square distance; RD, reliability distance.
KLUWER/ESCOM
© 1997 Kluwer Academic Publishers. Printed in The Netherlands.
J-Bio NMR 470
Automated combined assignment of NOESY spectra and
three-dimensional protein structure determination
Christian Mumenthaler
a, Peter Güntert
a, Werner Braun
band Kurt Wüthrich
a,*
aInstitut für Molekularbiologie und Biophysik, Eidgenössische Technische Hochschule-Hönggerberg, CH-8093 Zürich, Switzerland bDepartment of Human Biological Chemistry and Genetics, NMR Center, University of Texas Medical Branch, Galveston, TX 77555, U.S.A.Received 24 April 1997 Accepted 24 June 1997
Keywords: Protein structure determination; NOESY assignment; Error-tolerant target function
Summary
A procedure for automated protein structure determination is presented that is based on an iterative procedure during which the NOESY peak list assignment and the structure calculation are performed simultaneously. The input consists of a list of NOESY peak positions and a list of chemical shifts as obtained from sequence-specific resonance assignment. For the present applications of this approach the previously introduced NOAH routine was implemented in the distance geometry program DIANA. As an illustration, experimental 2D and 3D NOESY cross-peak lists of six proteins have been analyzed, for which complete sequence-specific1H assignments are available for the polypeptide backbone and the
amino acid side chains. The automated method assigned 70–90%of all NOESY cross peaks, which is on average 10%less than with the interactive approach, and only between 0.8%and 2.4%of the auto-matically assigned peaks had a different assignment than in the corresponding manually assigned peak lists. The structures obtained with NOAH/DIANA are in close agreement with those from manually assigned peak lists, and with both approaches the residual constraint violations correspond to high-quality NMR structure determinations. Systematic comparisons of the bundles of conformers that represent corresponding automatically and interactively determined structures document the absence of significant bias in either approach, indicating that an important step has been made towards automation of structure determination from NMR spectra.
Introduction
Protein structure determinations by NMR spectroscopy consist of two main phases (Wüthrich, 1986): (i) sequence-specific resonance assignment; and (ii) collection of dis-tance constraints from the assignment of 2D homonuclear or 3D and 4D heteronuclear-resolved [1
H,1
H]-NOESY spectra, which is based primarily on the chemical shifts obtained through the sequence-specific assignments. In principle, the steps needed to obtain resonance assign-ments and conformational constraints are well understood. In practice, however, considerable difficulties in their execution may arise from spectral artifacts and noise bands, absence of expected signals because of fast relax-ation and, most of all, peak overlap with concomitant
limitations in the determination of accurate peak posi-tions and peak volumes. These inevitable shortcomings of NMR data collection are the main reason that manual procedures, usually now supported by interactive com-puter programs, have so far been used almost exclusively in 3D protein structure determinations.
Although many attempts have been made to automate the sequential resonance assignment (Hare and Preste-gard, 1994; Olson and Markley, 1994; Zimmermann et al., 1994; Morelle et al., 1995; Bartels et al., 1996,1997), only few attempts of automatic assignment of NOESY spectra have so far been described, including combined automatic sequential resonance assignment and NOESY assignment (Oshiro and Kuntz, 1993; Kraulis, 1994) as well as semiautomatic procedures (Güntert et al., 1993;
Meadows et al., 1994). Assignment ambiguities caused by
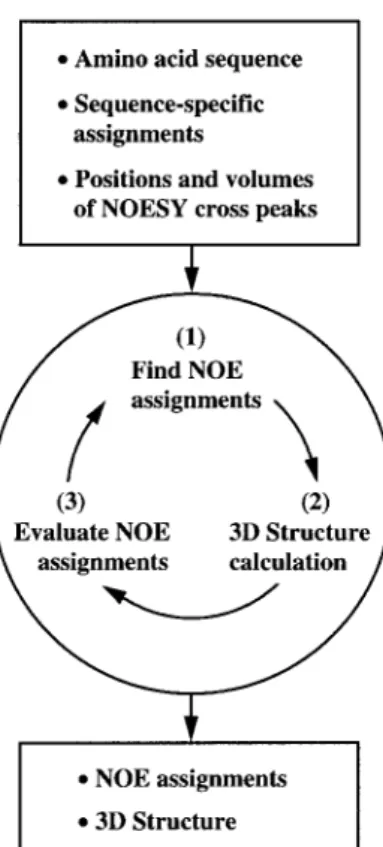
Fig. 1. Flow diagram for combined NOESY cross-peak assignment and 3D structure determination using NOAH/DIANA. Three main steps of each assignment cycle are indicated in the circle. In all calcu-lations described in this paper, the procedure of NOE assignment and structure calculation, followed by analysis of the intermediary results obtained, was repeated 25 times.
limited accuracy of peak positions and proton chemical shifts were usually not explicitly treated in these studies, except for Nilges (1993,1995) who accounted for this problem with an approach based on simulated annealing molecular dynamics, where peak volumes are interpreted as an r−6
-weighted sum of all possible peak assignments in the NOE target function. This procedure was applied to calculations of the structure of the basic pancreatic tryp-sin inhibitor (BPTI) from simulated NOESY spectra (Nilges, 1995), and has also been used for the calculation of symmetric oligomeric structures from NMR data, where all peaks are a superposition of at least two NOE signals (Donoghue et al., 1996).
Recently, the NOAH routine was proposed as an alter-native approach for automatic NOESY assignment (Mu-menthaler and Braun, 1995). NOAH uses as input only the chemical shift lists obtained from the sequence-specific resonance assignment and a list of NOESY cross-peak positions. Ambiguous peak assignments are treated as separate distance constraints in the distance geometry calculations, and erroneous assignments are eliminated in iterative cycles using the principle of ‘self-correcting dis-tance geometry’ as employed by NOAH, where an error-tolerant target function reduces the impact of erroneous
constraints on the calculated structures. In contrast to the Nilges approach, noise and artifactual peaks can be auto-matically removed during the procedure, and peaks are ultimately assigned to single proton pairs. This allows a critical comparison of NOAH results with those from manual procedures not only on the level of the final structures but also on the level of individual NOE assign-ments.
The present paper describes an implementation of NOAH in the distance geometry program DIANA (Gün-tert et al., 1991), and the use of the method with 2D and 3D experimental NOESY data sets. For proteins where complete, or very nearly complete, sequence-specific 1
H assignments are available for the polypeptide backbone and the amino acid side chains, excellent agreement is achieved between the results obtained with the automatic and manual approaches, indicating that the NOAH/ DIANA method is on the way to routine applications in protein structure determination.
Methods
The NOAH/DIANA routine for NOE assignment and 3D structure determination
Figure 1 illustrates the main steps of the procedure. The input required for NOAH/DIANA includes the amino acid sequence, a list of the chemical shifts obtained from the sequence-specific resonance assignment, and one or several NOESY peak lists containing the peak positions and peak volumes. Optionally, predefined distance or dihedral angle constraints may be added. NOAH/DIANA performs a user-defined number of cycles of automatic assignment (typically, 25 cycles yield satisfactory results), each with the following three main steps (Fig. 1, Mumen-thaler and Braun, 1995): (1) identification of those NOESY cross peaks for which the chemical shift list and the result of the structure determination from the previous cycle enable either a unique assignment or a small number of possible assignments; (2) structure calculation using the peak assignments from (1); and (3) evaluation of the result obtained, whereby NOAH tries to identify the correct assignment for peaks with multiple possible as-signments at the start of the cycle. In the following, these three steps are explained in more detail.
In step (1) a listing is prepared for each so far unas-signed NOESY cross peak, which contains all possible combinations of spins with shifts that lie within a toler-ance range, ±∆tol, of the peak position. For protons we used∆tol=0.01 ppm in 2D NOESY spectra and∆tol=0.02 ppm in 3D heteronuclear-resolved NOESY spectra. In peak lists from15
N- or13
C-resolved 3D [1 H,1
H]-NOESY spectra, the tolerance range for15
N or13
C was set to∆tol =0.3 ppm. The fundamental considerations leading to these tolerance ranges are given in the Discussion and Conclusions section.
After the first NOAH/DIANA cycle, a low-resolution 3D structure is available, and following Güntert et al. (1993) this preliminary structure is used to eliminate all tentative NOE assignments to proton pairs that are fur-ther apart than 5.0 Å+dtol+dpseud. A ‘tolerance distance’ dtol is added to allow for the large deviations within the bundles of conformers that represent the NMR structure in the early NOAH/DIANA cycles. Here, dtolwas linearly decreased from 5.8 Å in the first cycle to 0.4 Å in cycle 25. dpseud, where applicable, is the standard pseudo-atom correction (Wüthrich et al., 1983) used by DIANA (Gün-tert et al., 1991). In peak lists from 3D heteronuclear-resolved [1
H,1
H]-NOESY spectra, a check for expected transposed peaks can be used to discriminate between correct and erroneous assignments. The expected position of the transposed peak is determined from the known chemical shifts, and the peak list is screened for peaks situated within ±0.03 ppm of this position in the proton dimensions, and±0.6 ppm in the15
N or13
C dimension. If no transposed peak is found, the assignment is discarded. The check for transposed peaks can only be performed for pairs of protons that are attached to heavy atoms of the same type with known chemical shifts. At the outset of each new cycle, all peaks with less than a user-defined number of possible assignments, Npa, are included into a ‘test assignment list’. Here, Npawas 2 for cycles 2 to 15, 3 for cycles 16 to 19, and 4 for cycles 20 to 25. Until cycle 10 the unambiguously assigned peaks are translated into distance constraints of fixed length (5.0 Å, plus pseudo-atom correction where applicable). Afterwards, they are calibrated using an automatic calibration procedure in-cluded in DIANA (see below). If several NOESY peak lists are assigned simultaneously, the automatic calibration is applied to each peak list separately. The test assignments are always added with fixed distances of 5.0 Å plus pseu-do-atom correction, except in cycles 4, 8, 12, 16, 20 and 24 when they are not used for the structure calculation.
In step (2) an ensemble of N+20 conformers is calcu-lated in cycle N, using the variable target function method with an error-tolerant target function (Mumenthaler and Braun, 1995). During the initial cycles the input constraints include large errors, and a smaller number of conformers is sufficient to detect them. In cycles 16, 20 and 24 the REDAC strategy (Güntert and Wüthrich, 1991) is used to obtain better structures. One to four REDAC cycles were necessary, depending on the size and the fold of the protein. The dihedral angle constraints produced by the REDAC procedure are used in cycles 17, 18, 19, 21, 22 and 23 to calculate conformers which are subsequently minimized on the highest target level with the experimen-tal angle constraints.
In step (3) the 10 conformers with the lowest target function values obtained after each cycle are analyzed. For each assignment the percentage of conformers in which the residual constraint violation exceeds a given
user-defined value is evaluated and the corresponding NOESY cross peaks are classified as follows (Mumen-thaler and Braun, 1995). Peaks with a single test assign-ment possibility are unambiguously assigned if the corre-sponding constraint is fulfilled in more than L1percent of the conformers. Peaks with multiple assignment possibil-ities are assigned only if one assignment is satisfied in all conformers and the second-best assignment is violated in L2 or more percent of the conformers. Peaks that have been assigned in previous cycles can be reclassified if the corresponding distance constraint is violated in L3 or more percent of the conformers. Values of 50%, 50%and 80%were used for the parameters L1, L2 and L3, and L3 was decreased to 60%in the last cycle.
To provide the user with an indication of the reliability of each individual peak assignment, NOAH calculates the ‘reliability distance’ (RD) (Mumenthaler and Braun, 1995), which measures the superiority of the actual as-signment over all alternative asas-signments. For this pur-pose, a virtual distance constraint of 5.0 Å (plus pseudo-atom correction where applicable) is given to each alter-native assignment, and the RD is determined as the mini-mal violation any of these constraints have in the ensem-ble of 10 conformers. Thus, a high RD value indicates that no other assignment is compatible with the current structure bundle, while RD values close to 0 Å indicate that an alternative assignment could in principle be ful-filled.
Structure refinement
The final structure was obtained by a calculation using up to five REDAC cycles with the standard DIANA target function. Subsequent restrained energy minimiza-tion using the AMBER all-atom force field (Cornell et al., 1995) was performed with the program OPAL (Lugin-bühl et al., 1996) on the 10 NOAH/DIANA conformers with lowest target function values. The minimization was carried out after surrounding the DIANA conformers with a 6 Å thick shell of water molecules, and using the dielectric constantε =1 for the electrostatic interactions. The potential for violated distance constraints was pro-portional to the sixth power of the violation and scaled such that a violation of 0.1 Å corresponded to an energy of kT/2 at room temperature. For each conformer 2000 steps of conjugate gradient minimization were performed.
Automatic NOE-distance calibration
The present automatic calibration makes use of the fact that the spatial distribution of hydrogen atoms in different globular proteins is closely similar, and of the assumption that the range of NOE-observable 1
H–1 H distances is comparable in the different NOESY spectra used. On this basis, it predicts that the average of the dis-tance constraints calculated from a fully assigned NOESY spectrum should be similar for all globular proteins.
The NOE cross peaks are divided into three distinct
TABLE 1
EXPERIMENTAL PEAK LISTS USED AS INPUT FOR NOAH/ DIANA; THESE ARE FINAL PEAK LISTS OBTAINED AF-TER MULTIPLE CYCLES OF NOESY CROSS-PEAK ASSIGN-MENT AND STRUCTURE CALCULATION
Protein Residues Spectra useda Peaks
picked Er-2b 040 2D, H 2O 2D, D2O 0986 1221 Hirudin (1–51)c 051 2D, H 2O 2D, D2O 0551 0722 434(R10M) (1–63)d 063 2D, H 2O 1282 WmKTe 088 2D, H 2O 1998 DnaJ (2–108)f 107 3D,15N, H 2O 3D,13C, H 2O 0761 2080 P14ag 135 3D,15N, H 2O 3D,13C, H 2O 2D, H2O 2D, D2O 1457 3055 1925 2001
a2D stands for 2D [1H,1H]-NOESY; H
2O and D2O indicate the
sol-vent used; 3D stands for heteronuclear-resolved 3D [1H,1H]-NOESY,
where13C and15N specify the heterospin used.
bPheromone Er-2 from Euplotes raikovi (Ottiger et al., 1994). c N-terminal 51-residue fragment of hirudin from the leach Hirudo
medicinalis (Szyperski et al., 1992).
dN-terminal 63-residue domain of the phage 434 repressor carrying
the mutation R10M (Pervushin et al., 1996).
e Killer toxin from Williopsis mrakii (WmKT) (Antuch et al., 1996). f Fragment of residues 2–108 of the E. coli molecular chaperone DnaJ
(Pellecchia et al., 1996).
gPathogenesis-related protein P14a from tomato leaves (Fernández et
al., 1997).
TABLE 2
EXTENT OF THE NOESY ASSIGNMENTS OF SIX PROTEINS ACHIEVED BY THE AUTOMATIC NOAH/DIANA PROCEDURE AND BY THE INTERACTIVE APPROACH USED IN THE ORIGINAL STRUCTURE DETERMINATION
Protein Assignments (%)a
Manualb NOAH/DIANAc Identicald Differente Inconsistentf
Er-2 72 74 66 0.8 5.3 Hirudin (1–51) 99 93 91 1.1 0.5 434(R10M) (1–63) 99 80 78 2.4 1.1 WmKT 85 83 75 1.0 3.3 DnaJ (2–108) 96 82 80 1.4 2.0 P14a 90 78 74 1.0 5.1
aAll data are given as the percentage of the total number of identified NOESY cross peaks. bPeaks assigned by the original interactive approach.
c Peaks assigned by NOAH/DIANA.
dPeaks with identical assignments by the interactive and automatic procedures. e Peaks assigned differently in the interactively and automatically assigned peak lists.
f Peaks that are inconsistent with the final structure obtained by NOAH/DIANA, i.e., for which all possible assignments within the given chemical
shift tolerance range are violated by more than 1.0 Å in all conformers.
calibration classes. Backbone–backbone NOEs between all Hαand HN
are in class (i), which also includes intra-residual, sequential and medium-range NOEs (Wüthrich, 1986) where one of the protons is Hβ. Class (ii) includes all the remaining NOEs except those with methyl groups. Class (iii) are all NOEs involving methyl groups. The corresponding peak volumes, V, are calibrated into
dis-tance constraints, d, with the functions (i) d=(A/V)1/6, (ii) d=(B/V)1/4
, and (iii) d=(C/V)1/4
(Güntert et al., 1991). The parameter A is estimated automatically by assuming that the average distance limit from the calibration class (i) is 3.4 Å. B is then determined from the condition that the calibration curves (i) and (ii) must intersect at dmin= 2.4 Å, i.e., B=A/d2
min. C is set to B/2.
All distance constraints are confined to the range 2.4– 5.5 Å by setting outliers to the closest boundary of this distance interval.
Results
Comparison of protein structure determinations using auto-matically or interactively assigned NOESY peak lists
The NOAH/DIANA procedure was applied to the experimental data that were previously used for NMR structure determinations of the six proteins listed in Table 1. For all these proteins very nearly complete sequence-specific 1H assignments for the backbone and the side chains are available. The NOESY peak lists used here are ‘final’ lists that had been obtained by multiple cycles of interactive peak assignment and 3D structure calculation (Güntert et al., 1993). For the tests of the NOAH/DIANA procedure all assignments in these NOESY peak lists were deleted, and the resulting unassigned peak lists were used as input for the automated structure determination. The lists with the1
H,15
N and13
C chemical shifts were used as published, or as deposited in a data bank. Since corre-sponding chemical shifts may vary in different NOESY spectra of the same protein due to isotope shifts or slight differences in the experimental conditions, an ‘adapted’ chemical shift list was prepared for each different NOESY spectrum, which specifies the actual shift value within an allowance range of, usually, ±0.01–0.02 ppm. For Er-2, DnaJ (2–108) and P14a, such adapted chemical shift lists were derived from the peak lists by averaging the
posi-tions of all peaks assigned to the same proton. For the
a
b
c
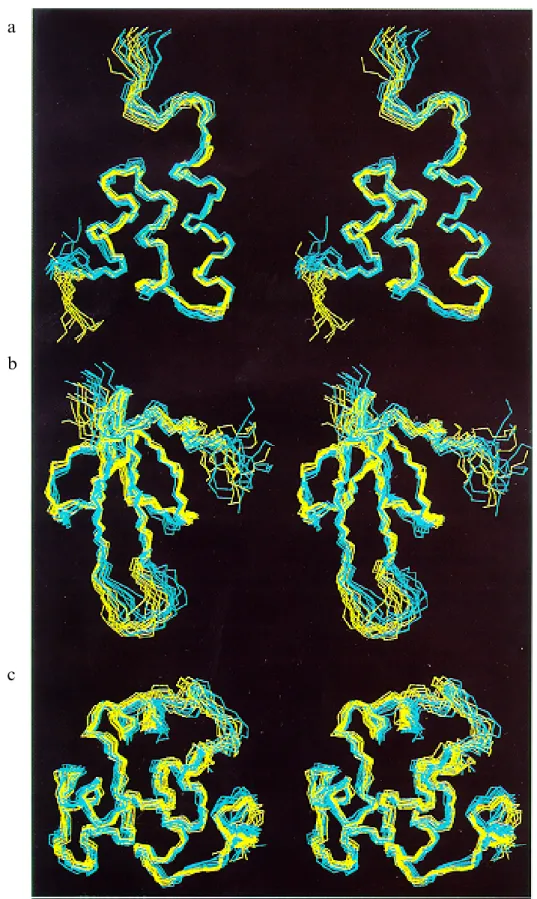
Fig. 2. Stereoviews of NMR conformers obtained using either interactive NOESY cross-peak assignments (yellow) or automatic assignments with NOAH/DIANA (cyan): (a) Er-2; (b) hirudin (1–51); (c) 434(R10M) (1–63). The figure was prepared with the program MOLMOL (Koradi et al., 1996).
other three proteins, adapted chemical shift lists for all spectra used (Table 1) were available from the previous
structure determinations. Stereospecific assignments and dihedral angle constraints obtained in the earlier structure determinations were included in the NOAH/DIANA
calculation. Additionally, distance constraints for disulfide
TABLE 3
CONFORMATIONAL CONSTRAINTS USED IN THE FINAL STRUCTURE CALCULATION BASED EITHER ON INTERACTIVE NOESY ASSIGNMENTS OR ON NOAH/DIANA
Protein Interactive assignment NOAH/DIANA
ir/seq/mr/lra N
conb ir/seq/mr/lra Nconb
Er-2 141/157/169/145 0612 114/157/174/133 0578 Hirudin (1–51) 158/159/56/216 0589 127/166/59/192 0544 434(R10M) (1–63) 203/183/213/147 0746 206/182/204/124 0716 WmKT 317/285/99/352 1053 322/306/122/388 1138 DnaJ (2–76) 310/158/121/93 0682 229/169/107/72 0577 P14a 414/332/292/672 1710 308/337/282/524 1451
aNumber of intraresidual (ir), sequential (seq), medium-range (mr) and long-range (lr) constraints. bTotal number of conformational constraints used in the structure determination.
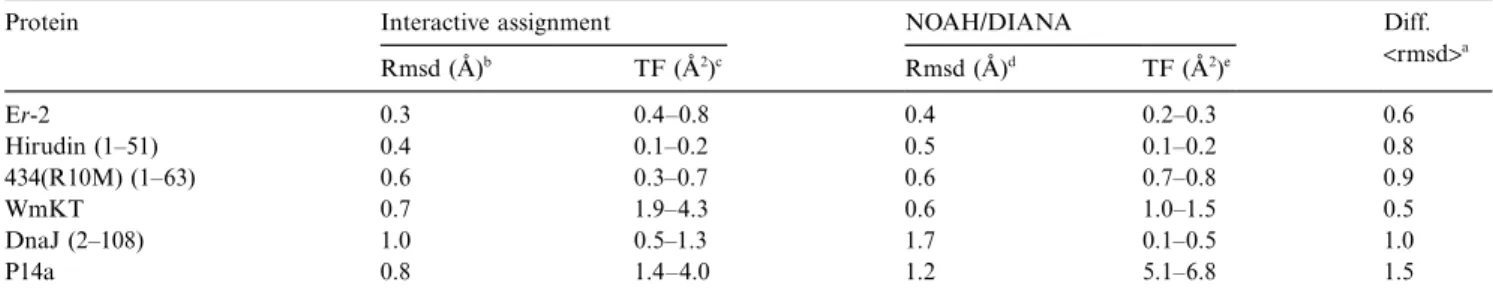
TABLE 4
PARAMETERS CHARACTERIZING THE QUALITY OF CORRESPONDING STRUCTURE DETERMINATIONS BASED EITHER ON INTERACTIVE NOESY ASSIGNMENTS OR ON NOAH/DIANA
Protein Interactive assignment NOAH/DIANA Diff.
<rmsd>a Rmsd (Å)b TF (Å2)c Rmsd (Å)d TF (Å2)e Er-2 0.3 0.4–0.8 0.4 0.2–0.3 0.6 Hirudin (1–51) 0.4 0.1–0.2 0.5 0.1–0.2 0.8 434(R10M) (1–63) 0.6 0.3–0.7 0.6 0.7–0.8 0.9 WmKT 0.7 1.9–4.3 0.6 1.0–1.5 0.5 DnaJ (2–108) 1.0 0.5–1.3 1.7 0.1–0.5 1.0 P14a 0.8 1.4–4.0 1.2 5.1–6.8 1.5
aRmsd between mean structures obtained with the interactive and automatic assignments,<rmsd>int− <rmsd>NOAH/DIANA.
bAverage rmsd values relative to the mean for the backbone heavy atoms in groups of 20 conformers used to describe the NMR structure. The
following residues were used to calculate the rmsd values: 3–37 for Er-2, 3–30 and 37–48 for hirudin (1–51), 1–63 for 434(R10M) (1–63), 3–39 and 47–87 for WmKT, 6–57 for DnaJ, and 1–135 for P14a.
c Final DIANA target function values for the 20 best conformers from the references given in Table 1.
dRmsd values for the 10 best energy-minimized conformers obtained with NOAH/DIANA calculated as described in footnote b. e Final DIANA target function values of the 10 best conformers from NOAH/DIANA.
bonds (Williamson et al., 1985) were used in all structure calculations. For the 3D peak lists of P14a the high qual-ity of the spectra and the resulting good match between peak positions and chemical shifts allowed one to lower the tolerance range,∆tol, from±0.02 ppm to±0.015 ppm in the proton dimensions.
All DIANA computations were performed on Cray J-90 computers using six processors simultaneously for the structure calculations. The total CPU time needed for a full NOAH/DIANA calculation ranged from 3 h for Er-2 to about 60 h for P14a.
Table 2 contains the results of the automatic assign-ment procedure for the experiassign-mental peak lists of the six proteins. On average, NOAH/DIANA assigned about 82% of all peaks, which is lower than the average of about 90% assigned peaks by the interactive approach, with the most significant differences in cases where the manually established peak lists were nearly completely assigned. The percentage of peaks that were assigned to the same proton pair by the interactive and the automatic procedure was on average 77%. About 5% of the peaks picked in the NOESY spectra were only assigned by
NOAH/DIANA, and 13% only by the interactive ap-proach. On average, different assignments by the two approaches were obtained for less than 2%of the peaks. Table 3 provides an analysis of the meaningful confor-mational constraints used in the final structure calculation of both approaches. As expected from the lower percen-tage of assigned peaks, NOAH/DIANA usually produced a smaller total number of distance constraints, but the distribution among intraresidual, short-range, medium-range and long-medium-range constraints does not differ signifi-cantly between the two approaches.
The final structures obtained by NOAH/DIANA are analyzed and compared with those obtained from interac-tive assignment in Table 4. Residual constraint violations in the automatically determined structures were small, as evidenced by the fact that the DIANA target function values are comparable and sometimes even lower than those from the interactive procedure. The higher value for P14a is largely due to the fact that, compared to the interactive approach, the calculation schedule had to be shortened by a factor of 2 in the NOAH/DIANA calcula-tion to avoid excessive computacalcula-tion times. Restrained energy minimization with OPAL (Luginbühl et al., 1996)
removed nearly all the remaining constraint violations.
Fig. 3. Ramachandran plot of the 10 energy-minimized NOAH/DIANA structures of 434(R10M) (1–63). (φ,ψ)-conformations of all residues are marked with white symbols (triangles are glycines, squares are other residue types). The figure was prepared with the program PROCHECK-NMR (Laskowski et al., 1996).
a
b
Fig. 4. Spectral region (ω1=2.4–3.1 ppm,ω2=7.6–8.3 ppm) from the 2D [1H,1H]-NOESY spectrum of WmKT, with black dots identifying
picked peaks. (a) Final peak list from the previous interactive struc-ture determination (Antuch et al., 1996). (b) New peak list picked manually without reference to the 3D WmKT structure.
No distance constraint violation larger than 0.12 Å and no angle constraint violation larger than 0.31° was de-tected in any of the energy-minimized conformers of all six proteins.
The average backbone rmsd values of the energy-mini-mized NOAH/DIANA structures to their mean structure are 0.4–1.7 Å (Table 4). In four of the proteins studied, this is higher than the corresponding rmsd values for the final conformers from the interactive assignment. Super-positions of the conformers obtained from NOAH/DIANA with those from interactive NOESY assignments (Fig. 2) visualize the good match between the two results.
The program PROCHECK-NMR v. 3.4 (Laskowski et al., 1996) was used to analyze the groups of energy-mini-mized NOAH/DIANA conformers. The average of the ‘equivalent resolution’ parameters for main-chain hydro-gen bond energies, percentage of residues in the most favored regions of the (φ,ψ)-space, pooled standard devi-ations of χ1
from the three staggered rotamer positions and standard deviations of χ2 angles that are in trans position ranged from 1.7 to 2.3 Å for the six proteins. As an example, Fig. 3 shows the Ramachandran plot of the 434(R10M) conformer group.
Calculation of the structure of WmKT from a de novo picked NOESY peak list
The peak lists in Table 1 are those used for the final calculation of the NMR structures. They are refined descendants of initial lists, which were altered by
refer-ence to the results of early structure calculations (Güntert et al., 1993).
To investigate possible bias that might be introduced through the use of these refined peak lists, and to test the performance of NOAH/DIANA when using an initial, possibly automatically picked peak list, we repicked the NOESY spectrum of WmKT. Neither the previous peak lists nor the proton chemical shift tables were used to guide this peak picking, and peaks were interactively picked at intensity maxima in the 2D NOESY spectrum recorded in H2O. Especially in regions of strong peak overlap, major differences to the refined peak list were apparent. For example, we found only 15 peak positions in the spectral region of the lower part of Fig. 4b, where-as the refined peak list contained 24 peak positions (Fig.
4a). (In the refined peak list some of these peak
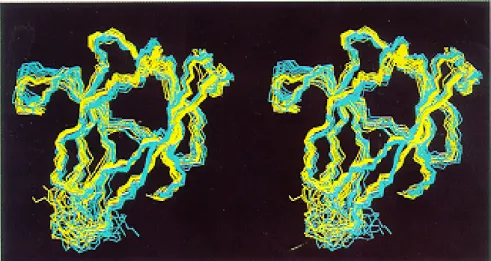
identifi-Fig. 5. Stereoview of a superposition for minimal rmsd of 10 conformers obtained with manual NOESY assignment (yellow) with 10 conformers calculated by NOAH/DIANA (cyan) using a peak list that was manually picked without consideration of other peak lists or the known proton chemical shifts (see text).
cations were based on a TOCSY peak list that was used as a starting point for the picking of the NOESY spec-trum; here, only NOESY data were considered.)
The 1746 peaks contained in the newly picked peak list were integrated automatically by the in-house software SPSCAN (unpublished). The resulting list was compared with the previous final list, and 1424 peaks were found to be common to both lists within a distance of±0.01 ppm. Five hundred and seventy-four peaks, mainly located in overlap regions, were present only in the refined list, and 322 peaks turned out to be mostly noise peaks or very weak NOEs. In spite of these differences, NOAH/DIANA yielded similar structures as the calculation based on the refined peak list (Fig. 5). Overall, 1328 peaks (76%of all entries in the peak list) were assigned. With an average backbone rmsd of 0.6 Å to the mean structure for resi-dues 4–39 and 47–87, the structures obtained from this input with NOAH/DIANA were nearly as well defined as those calculated from the refined peak list. The rmsd between the mean structures obtained with the de novo picked NOESY peak list as input for NOAH/DIANA and with the interactive assignment approach was 1.0 Å.
Discussion and Conclusions
A rationale for the functioning of NOAH/DIANA
In the initial assignment cycle (Fig. 1) all peaks with two assignment possibilities are included in the structure calculation. In view of the large number of erroneous conformational constraints that are likely to be included at this stage, it seems nontrivial that the NOAH/DIANA approach ultimately converges to the correct structure. The explanation is related to the fact that while minimiz-ing its target function, DIANA attempts to satisfy a maximum number of conformational constraints
simulta-neously. The correctly assigned constraints form a large subset of self-consistent constraints, whereas, in contrast, the erroneously assigned constraints are randomly distrib-uted in space, generally contradicting each other. As a consequence, erroneously assigned constraints may distort the structure but will not lead to a distinctly different protein fold. Thereby, one must keep in mind that the elimination of erroneously assigned constraints through contradiction with correct constraints will in general be less efficient in regions of low NOE density, such as chain ends, surface loops or the periphery of long side chains, than in the well-defined protein core.
Another peculiarity of the randomly distributed erron-eously assigned constraints is that they are more likely to be long-range than short-range or intraresidual. This contrasts with the overall constraint distribution of a correctly assigned NOESY spectrum, where more than 50%of all NOESY cross peaks manifest intraresidual or short-range NOEs (Wüthrich, 1986). Short-range straints are generally more uniformly satisfied in all con-formers because of their inclusion at an early stage of the variable target function method (Braun and Go¯, 1985; Güntert et al., 1991).
Impact of the choice of tolerance ranges allowing for vari-able peak positions and chemical shifts
Probably the most important parameter to be defined in applications of NOAH/DIANA is the tolerance range,
∆tol, that enables one to obtain assignments in spite of the fact that there are inevitably small errors in the determi-nation of chemical shifts and peak positions within a spectrum. Here, we use a simple mathematical model for the treatment of 2D [1
H,1
H]-NOESY spectra to gain deeper insight into the consequences of different choices of ∆tol. N is the total number of hydrogen atoms in the protein, Npeaksis the total number of peaks picked in the
spectrum, and∆ωis the chemical shift range within which
a
b
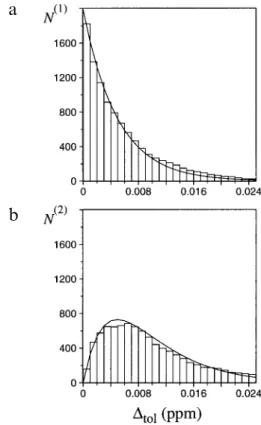
Fig. 6. The bars represent histograms of N(1) and N(2) versus the
selected chemical shift tolerance range, ∆tol, allowed between peak position and chemical shift of the peaks in a simulated NOESY peak list for the protein WmKT. (a) Peaks that have one possible assign-ment, N(1). (b) Peaks with two possible assignments, N(2). The NOESY
peak list for WmKT was simulated by postulating that there is a cross peak between any pair of protons that are closer than 4.0 Å in the best NMR conformer. To avoid artifacts when using very small values for∆tol, the peak list had to be simulated so as to provide peak posi-tions that perfectly match the proton shifts. No structural information has been used to resolve ambiguities. In both (a) and (b) the curved lines represent the corresponding values predicted by Eqs. 1–3 with the parameters Npeaks=1986, N=457 and∆ω =9.0 ppm.
the vast majority of proton chemical shifts are located. Assuming that the proton shifts are distributed evenly over the region∆ω, the probability p of finding a proton shift in an interval [ω−∆tol,ω+∆tol] about any selected position ωis
p= 2 tol
1 ∆
∆ω ( )
The number of peaks with only one possible assignment, N(1)
, i.e., peaks where for each dimension all N proton shifts except one are outside the tolerance range from the peak position, is then
N(1)= Npeaks(1−p) 2N−2≈ Npeakse −2Np (2) Equation 2 predicts that the percentage of a priori unam-biguous peaks decreases exponentially with both increas-ing size of the protein and increasincreas-ing value of the toler-ance range.
Peaks with two assignment possibilities are also included in the NOAH/DIANA calculations from the beginning. Their number, N(2), is N(2)= Npeaks2p(N−1)(1−p) 2N−3≈ 2Np N(1) (3) N(2) vanishes for very small∆
tolvalues, but increases lin-early as a function of N(1)
with a coefficient that is pro-portional to the protein size and the ∆tol value. In our calculations, with ∆tol=0.01 ppm, N
(2)
was usually 2–3 times larger than N(1)(Fig. 6). Figure 6 further shows that Eqs. 1–3 provide a good description of the situation in the protein WmKT.
In order to assign the majority of the NOESY cross peaks, the initial ambiguity of peak assignments based on chemical shifts must be resolved by reference to the pre-liminary protein structure, and the ambiguity is complete-ly resolved if all but one of the potential assignments correspond to pairs of hydrogen atoms that are spatially separated by more than a maximal distance, dmax, for which a NOE may be observed. Assuming that the hydro-gen atoms are evenly distributed within a sphere of radius R that represents the protein, the probability that two randomly selected hydrogen atoms are closer to each other than dmax, q, is approximately given by the ratio between the volumes of two spheres with radii dmaxand R, respectively: q= d max R 3 4 ( )
WmKT is a nearly spherical protein with a radius of about 15 Å. Using dmax=5.0 Å, q becomes approximately 4%, indicating that only 96% of the peaks with two as-signment possibilities can be uniquely assigned by
refer-ence to the protein structure. The total number of unique-ly assigned peaks, Nunique, can optimally be increased to
Nunique=N (1)+ (1−q)N(2)+ (1−q)2 N(3)+ ... (5) Even by reference to a perfectly refined structure, it is therefore impossible, on fundamental grounds, to resolve all assignment ambiguities, since q will always be larger than 0. In particular for small structures, where R ap-proaches dmax, the decrease in ambiguity achieved by reference to the molecular structure becomes less import-ant. Here, separate treatment of peaks with different intensities is helpful, since peaks with larger volumes will have smaller corresponding dmaxvalues.
For peak lists obtained from13 C- or 15
N-resolved 3D [1H,1H]-NOESY spectra, two additional elements play an important role. First, ambiguity in the proton dimension correlated to the heterospin is usually resolved, so that Eq. 2 adopts the form
a
b
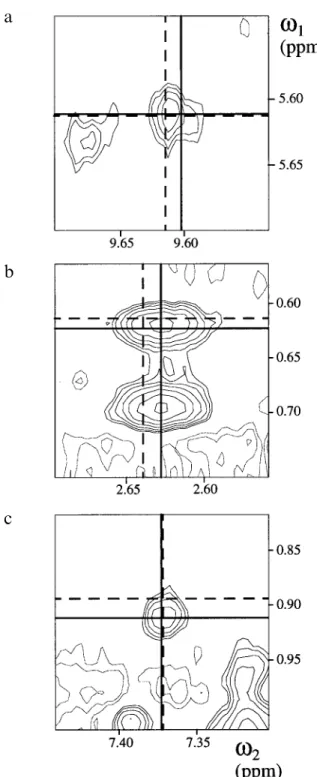
c
Fig. 7. Three spectral regions from the 2D NOESY spectrum of WmKT. Lines represent the proton shifts to which a peak was as-signed interactively (dashed lines), or automatically with NOAH/ DIANA (solid lines). (a) Both assignments are fully compatible with the final conformer calculated with NOAH/DIANA and lie within the tolerance range of±0.01 ppm from the peak position. (b) Both assign-ments are compatible with the final conformers from NOAH/DIANA, but along one dimension (ω2) the assignment from the interactive approach lies outside the tolerance range of ±0.01 ppm about the picked peak position. (c) The interactive assignment is violated in the conformers from NOAH/DIANA, and along one dimension (ω1) the assignment from the interactive approach lies outside the tolerance range of±0.01 ppm about the picked peak position. The coinciding solid and broken lines in theω1dimension of (a) and in theω2 dimen-sion of (c) indicate the same proton shift.
N(1)≈N peakse
−Np
(6) This effect is equivalent to reducing the influence of the size (and therefore N) of the protein by a factor of 2. Second, supplementary analysis of transposed peaks, as described in the Methods section, can significantly reduce the number of possible peak assignments. However, this advantage of the heteronuclear experiments cannot be fully exploited in practice, since the tolerance ranges must be increased due to the lower digital resolution in 3D NMR experiments.
Analysis of the differences between the assignments ob-tained interactively and with NOAH/DIANA
For peaks that were assigned differently by the interac-tive approach and the automatic NOAH/DIANA pro-cedure, two parameters have been introduced that can be evaluated from the final conformers determined with NOAH/DIANA: Vmin, the minimal violation of the inter-active assignment in any of the conformers; and the RD of the NOAH/DIANA assignment (Mumenthaler and Braun, 1995). Peaks with different assignments can thus be grouped into three categories. (a) Both assignments are satisfied in the conformers from NOAH/DIANA (RD= 0.0 Å; Vmin=0.0 Å). Assuming that the conformers are correct solutions, such peaks must be superpositions of two NOE signals, so that both assignments are correct. (b) The assignment from NOAH/DIANA is supported by RD>0.0 Å, but the interactive assignment is also satisfied (Vmin=0.0 Å). Here, the interactive assignment was never considered by NOAH, because one of its proton shifts is too far away from the cross-peak position. Unless either the proton shifts were not properly determined or the tolerance range∆tolwas too small, the NOAH assignment seems more appropriate in such cases. (c) The assignment from the interactive approach is violated in the conformers calculated with NOAH/DIANA (RD≥0.0 Å; Vmin>0.0 Å). These are the interesting cases, since they reflect a significant discrepancy between the two assigned peak lists and the groups of conformers calculated from them. Figure 7 gives one example for each of these three possi-bilities from the 2D NOESY spectrum of WmKT. In Fig. 7a, the shoulder on the right indicates that the peak is probably a superposition of two NOE signals, which correspond to the two different assignments and are both satisfied in the structure calculated using NOAH/DIANA. Figure 7b is a similar case, although the peak center clearly corresponds to the assignment given by NOAH/ DIANA. The apparent small error in the interactive ω2 chemical shift determination has no obvious consequences since both NOEs are compatible with the calculated struc-ture. Finally, Fig. 7c shows a peak that was assigned wrongly in the manual peak list, since the peak is not lo-cated at the intersection of the chemical shifts of the as-signed protons. This case illustrates the use of NOAH/
DIANA to check and correct manually derived assign-ments.
Among the 168 differently assigned peaks of all spectra from Table 1 situation (a) is by far the most common one, with 68% of all differently assigned peaks after as-signment by NOAH/DIANA or by the interactive pro-cedure, respectively, being characterized by RD=0.0 Å and Vmin=0.0 Å. Only 18% of the distance constraints derived from the differently assigned peaks are violated in the structures calculated by NOAH/DIANA. This indi-cates that the generally observed differences in the extent of 1–2%of the total number of assignments between the interactively and automatically assigned peak lists are for the most part insignificant because they have no bearing on the 3D protein structure. Overall, the RD performs rather well in identifying ‘problematic’ assignments: 76%of the differently assigned peaks have an RD value of 0.0 Å.
Influence of incomplete sequence-specific assignment
An important parameter for assessing proper function-ing of NOAH/DIANA is the number of NOESY cross peaks that are inconsistent with the final protein struc-ture, i.e., peaks for which no possible assignment within the given chemical shift tolerance range is compatible with the group of conformers used to represent the NMR structure (Table 2). In practice, the sequence-specific assignments and hence the chemical shift lists tend to be incomplete, and peaks originating from the unassigned nuclei cannot be explained correctly by NOAH/DIANA. Similarly, noise peaks included after de novo peak picking cannot be assigned, so that a large number of inconsistent peaks is not necessarily a reliable criterion for evaluation of a structure obtained from NOAH/DIANA.
To test the impact of incomplete or partly erroneous input, we repeated the calculation for WmKT using dif-ferent chemical shift lists. First, we randomly deleted 10% of the proton shifts, which implies that about 20%of the cross peaks cannot be assigned. As a consequence, only 66% of the peaks were assigned by NOAH/DIANA, which is 17%less than with the complete list of chemical shifts. When compared with the NOAH/DIANA calcula-tion using the complete input for WmKT (Table 2), the percentage of different assignments relative to the interac-tive approach stayed at 1.0%, and the percentage of in-consistent peaks increased from 3.3%to 12.1%. The num-ber of correct assignments was insufficient for obtaining conformers of good quality, since the target function values of the final conformers were around 17 Å2
. In a second test, we displaced the same 10% of the proton chemical shifts by 0.015 ppm. In principle, this should have the same consequences as removal to these shifts, ex-cept that the displaced chemical shifts lead to additional assignment possibilities for neighboring peaks. Again, around 66% of the peaks were assigned by NOAH/ DIANA, but the percentage of different assignments
relative to the interactive approach was 4.5%and thus 4 times higher than after elimination of the peaks from the list. When the tolerance range was increased from the standard±0.01 ppm to±0.02 ppm, 73%of the peaks were assigned by NOAH/DIANA, with 2.9% of the assign-ments being different from those of the interactive ap-proach.
In practice, missing chemical shifts are often from peripheral side-chain protons, which are typically involved in only few NOEs. Therefore, the problems caused by random deletion of 1/10th of the chemical shifts from a nearly complete list may be more severe than those in a typical experiment where the same fraction of protons has remained unassigned. Nonetheless, on the basis of the above tests, in particular the observation that incomplete chemical shift lists tend to lead to unacceptable structures, the use of NOAH/DIANA for proteins with incomplete 1
H chemical shift lists cannot presently be recommended. The rationale for the observation that absence of chemi-cal shifts for significant fractions of all protons degrades the performance of the NOAH/DIANA procedure is that incomplete shift lists exclude the correct assignments for many NOESY peaks. NOAH/DIANA then tends to incorrectly assign such peaks to other protons with chemi-cal shifts in the same range as the unassigned protons, which can lead to distorted structures.
Stereospecific assignment
In the NOAH/DIANA calculations presented in this paper, we included the stereospecific assignments and the dihedral angle constraints from the earlier interactive struc-ture determinations, which used the programs HABAS (Güntert et al., 1989) and GLOMSA (Güntert et al., 1991). This enabled a direct comparison of the resulting conformers with the interactively obtained ones without bias from other factors than the NOESY assignments, although stereospecific assignment by the NOAH/DIANA procedure has not yet been implemented.
Outlook
The impressive performance, when using an input of high-quality experimental data, of the combination of self-correcting distance geometry and structure-based spectral filters (Güntert et al., 1993; Mumenthaler and Braun, 1995) implemented in NOAH/DIANA provides a platform for both continued methods development and practical applications. (i) The tests conducted in this paper show that NOAH/DIANA is remarkably robust with respect to imperfect NOE peak lists and can yield acceptable structure calculations for incomplete NOE input. This is encouraging for future work where struc-ture calculations might start with automatically picked, incomplete NOESY peak lists, which would then be im-proved by reference to the preliminary structures (Güntert et al., 1993). In contrast, for the reasons outlined above,
NOAH/DIANA performs rather poorly with incomplete 1
H chemical shift lists, such as lists with missing assign-ments for the aromatic rings or other amino acid side chains for which complete assignments are difficult to obtain. (ii) For proteins where the sequence-specific as-signment is nearly complete and peak lists with few arti-facts are available, the method is ready for practical use in the determination of the 3D structure; a structure determination of a mutant form of crambin has been reported (Xu et al., 1997) and additional automated struc-ture determinations are in progress in our laboratories.
In spite of the progress made with the automatic NOAH/DIANA method, spectroscopists working inter-actively with original NOESY spectra still have several advantages, since they can exclude assignment possibilities by line-shape considerations and (in good-quality spectra and for well-separated peaks) intuitively use smaller toler-ance ranges between peak positions and chemical shifts. This will in general contribute to a more complete NOESY assignment by the interactive method than by the auto-mated approach. However, as long as the sequence-speci-fic assignment is nearly complete and artifacts are scarce in the NOESY peak list, it appears that this does not cause major differences between the structures based either on interactive or on NOAH/DIANA assignment of the NOESY spectra. Nonetheless, further progress with automated procedures will foreseeably depend on tighter interaction with the original spectral data. Note also that NOAH/DIANA cannot replace the manual analysis of NOESY spectra for obtaining sequence-specific resonance assignments, for example, for the assignment of aromatic rings (Wüthrich, 1986).
For larger proteins the computing power is also a critical factor. The REDAC strategy employed here for the structure calculation is time-consuming for large and complicated folds such as the one of P14a, since good convergence is only achieved with multiple REDAC cycles. New structure calculation methods, such as molecular dynamics in torsion angle space (Güntert et al., 1996; Stein et al., 1997), will be needed to enable practical applications of the presently outlined principles for auto-mated NMR structure determination to larger proteins.
Acknowledgements
The use of the computing facilities of the ETHZ-Cray J-90 SuperCluster Cooperation and of the NEC SX-4 supercomputer of the Centro Svizzero di Calcolo Scien-tifico is gratefully acknowledged. Financial support was obtained from the ETH Zürich, the Schweizerischer Na-tionalfonds (Project 31.32033.91, K.W.) and the U.S. National Science Foundation (Project BIR-9632326, W.B.). We thank M. Salzmann for reports on the use of NOAH/ DIANA with his protein structure determinations, and Mrs. E. Ulrich for the careful processing of the manuscript.
References
Antuch, W., Güntert, P. and Wüthrich, K. (1996) Nat. Struct. Biol.,
3, 662–665.
Bartels, Ch., Billeter, M., Güntert, P. and Wüthrich, K. (1996) J. Biomol. NMR, 7, 207–213.
Bartels, Ch., Güntert, P., Billeter, M. and Wüthrich, K. (1997) J. Comput. Chem., 18, 139–149.
Braun, W. and Go¯, N. (1985) J. Mol. Biol., 186, 611–626.
Cornell, W.D., Cieplak, P., Bayly, C.I., Gould, I.R., Merz Jr., K.M., Ferguson, D.M., Spellmeyer, D.C., Fox, T., Caldwell, J.W. and Kollman, P.A. (1995) J. Am. Chem. Soc., 117, 5179–5197. Donoghue, S.I., King, G.F. and Nilges, M. (1996) J. Biomol. NMR,
8, 193–206.
Fernández, C., Szyperski, T., Bruyère, T., Ramage, P., Mössinger, E. and Wüthrich, K. (1997) J. Mol. Biol., 266, 576–593.
Güntert, P., Braun, W., Billeter, M. and Wüthrich, K. (1989) J. Am. Chem. Soc., 111, 3997–4004.
Güntert, P., Braun, W. and Wüthrich, K. (1991) J. Mol. Biol., 217, 517–530.
Güntert, P. and Wüthrich, K. (1991) J. Biomol. NMR, 1, 447–456. Güntert, P., Berndt, K.D. and Wüthrich, K. (1993) J. Biomol. NMR,
3, 601–606.
Güntert, P., Mumenthaler, Ch. and Wüthrich, K. (1996) Abstracts XVIIth International Conference on Magnetic Resonance in Biologi-cal Systems, Keystone, CO, U.S.A., August 18–23, p. 175. Hare, B.J. and Prestegard, J.H. (1994) J. Biomol. NMR, 4, 35–46. Koradi, R., Billeter, M. and Wüthrich, K. (1996) J. Mol. Graph., 14,
51–55.
Kraulis, P.J. (1994) J. Mol. Biol., 243, 696–718.
Laskowski, R.A., Rullmann, J.A.C., MacArthur, M.W., Kaptein, R. and Thornton, J.M. (1996) J. Biomol. NMR, 8, 477–486. Luginbühl, P., Güntert, G., Billeter, M. and Wüthrich, K. (1996) J.
Biomol. NMR, 8, 136–146.
Meadows, R.P., Olejniczak, E.T. and Fesik, S.W. (1994) J. Biomol. NMR, 4, 79–96.
Morelle, N., Brutscher, B., Simorre, J.-P. and Marion, D. (1995) J. Biomol. NMR, 5, 154–160.
Mumenthaler, Ch. and Braun, W. (1995) J. Mol. Biol., 254, 465–480. Nilges, M. (1993) Proteins, 17, 297–309.
Nilges, M. (1995) J. Mol. Biol., 245, 645–660.
Olson Jr., J.B. and Markley, J.L. (1994) J. Biomol. NMR, 4, 385–410. Oshiro, C.M. and Kuntz, I.D. (1993) Biopolymers, 33, 107–115. Ottiger, M., Szyperski, T., Luginbühl, P., Ortenzi, C., Luporini, P.,
Bradshaw, R.A. and Wüthrich, K. (1994) Protein Sci., 3, 1515–1526. Pellecchia, M., Szyperski, T., Wall, D., Georgopoulos, C. and
Wüth-rich, K. (1996) J. Mol. Biol., 260, 236–250.
Pervushin, K., Billeter, M., Siegal, G. and Wüthrich, K. (1996) J. Mol. Biol., 264, 1002–1012.
Stein, E.G., Rice, L.M. and Brünger, A.T. (1997) J. Magn. Reson.,
124, 154–164.
Szyperski, T., Güntert, P., Stone, S.R. and Wüthrich, K. (1992) J. Mol. Biol., 228, 1193–1205.
Williamson, M.P., Havel, T.F. and Wüthrich, K. (1985) J. Mol. Biol.,
182, 295–315.
Wüthrich, K., Billeter, M. and Braun, W. (1983) J. Mol. Biol., 169, 949–961.
Wüthrich, K. (1986) NMR of Proteins and Nucleic Acids, Wiley, New York, NY, U.S.A.
Xu, Y., Wu, J., Gorenstein, D. and Braun, W. (1997) Abstracts 38th Experimental Nuclear Magnetic Resonance Conference, Orlando, FL, U.S.A., March 23–27.
Zimmermann, D., Kulikowski, C., Wang, L., Lyons, B. and Monte-lione, G.T. (1994) J. Biomol. NMR, 4, 241–256.