Reverse Iontophoresis as a
Noninvasive Tool for Lithium
Monitoring and
Pharmacokinetic Profiling
Benoıˆt Leboulanger,1,2Marc Fathi,3 Richard H. Guy,1,2and
M. Begon˜a Delgado-Charro1,2,4
Received December 16, 2003; accepted March 18, 2004
Purpose. Transdermal iontophoresis was investigated as a
noninva-sive tool for drug monitoring and pharmacokinetic profiling. Lithium, a frequently monitored drug, was used as a model. The objectives were a) to demonstrate the linear dependence of the iontophoretic extraction flux of lithium on the subdermal concentration of the drug, b) to evaluate the capacity of iontophoresis to monitor sudden changes in the subdermal level, c) to investigate the utility of reverse iontophoresis as a tool in pharmacokinetic studies, and d) to examine the validity of an internal standard calibration procedure to render the method completely noninvasive.
Methods. Transdermal, iontophoretic extraction was performed in vitro
using dermatomed pig-ear skin. The subdermal solution consisted of a physiological buffer containing lithium chloride at concentrations in the therapeutic range and two putative internal standards, sodium and potassium, at fixed physiological levels. The subdermal concen-tration of lithium was changed either in a stepwise fashion or by simulating one of two pharmacokinetic profiles.
Results. Lithium was extracted via electromigration to the cathode.
A excellent correlation between subdermal lithium concentration and iontophoretic extraction flux was observed. Iontophoresis tracked sudden concentration changes and followed kinetic profiles. In addi-tion, the effective elimination rate constant could be directly, and noninvasively, estimated from the extraction flux data.
Conclusions. Reverse iontophoresis is a potentially useful and
non-invasive tool for lithium monitoring.
KEY WORDS: iontophoresis; lithium; reverse iontophoresis;
thera-peutic drug monitoring; transdermal extraction. INTRODUCTION
Currently, therapeutic drug monitoring and pharmacoki-netic studies depend principally upon the quantification of the
molecule in one or more blood samples. The invasive nature of the procedure, the associated risks of infection, the need for trained personnel, and, for some populations (e.g., neo-nates), the technical difficulty, limit the frequency and com-plexity of these studies. As a result, drug kinetics in certain patient groups are poorly understood, and drug monitoring, in general, is performed much less often than it should.
There is a clear need, therefore, for the development of noninvasive techniques, which would be much better ac-cepted by the patient and would offer the possibility of fre-quent and ambulatory self-monitoring (1,2). Pediatric, neona-tal, and geriatric patients, as well as the chronically and criti-cally ill, would benefit most from the availability of such tools. For example, manic-depressive patients receiving chronic lithium therapy would profit from frequent monitoring that does not demand repeated visits to the hospital. These pa-tients are carefully supervised because of a) the wide inter-subject variability observed in dose requirement and toler-ance to the drug, b) the very narrow therapeutic index, and c) a half-life that depends on kidney function, sodium intake, and age (3). Monitoring is initially performed to adjust the dose: daily, weekly and, finally, monthly evaluations are car-ried out during the first 6 months. Thereafter, lithium levels are checked at least every three months to detect drifts in concentration (4). The latter may be due to age, pregnancy, low salt diet, fever, infection, drug interactions, other medical problems, and/or poor compliance with the dosage regimen (4–6). At present, lithium monitoring requires blood sam-pling. Attempts to use either saliva or urine as alternative matrices have not been successful (3,7–9).
Reverse, transdermal iontophoresis has been proposed as an alternative technique for noninvasive monitoring (10– 15). Potential applications in clinical chemistry and thera-peutic drug monitoring have been identified. Iontophoresis involves the application of a small electrical current (<0.5 mA/cm2) to the skin (16,17) and results in enhanced transport
across the membrane via two possible mechanisms (18–20). The first, electromigration, only concerns ions, which carry the current through the skin toward the electrode of opposite polarity. Thus, in reverse iontophoresis, anions are extracted at the anode and cations (such as lithium) at the cathode (negative electrode). The ion flux is related to the intensity of current applied via equation 1:
Ja=
I⭈ ta
za⭈ F (1)
where, Ja, ta, and zaare the flux, transport number, and va-lence, respectively, of the ion “a”; I is the intensity of current applied, and F is Faraday’s constant. It has been shown that, in the presence of competing ions, the transport number (i.e., the percentage of the charge carried) of a given ion is pro-portionally related to its concentration in the donor solution (21). Thus, in reverse iontophoresis, it is expected that the flux of a given analyte should be related to its concentration in the subdermal fluid. The second mechanism of transport is electroosmosis, which is a convective solvent flow, in the an-ode-to-cathode direction, due to the fact that the skin has a net negative charge. This flow increases the transdermal transport of neutral (e.g., glucose) and zwitterionic species and supplements the electromigration of cations. It has also
1School of Pharmacy, University of Geneva, CH-1211 Geneva 4,
Switzerland.
2Centre International de Recherche et d’Enseignement
(“Pharma-peptides”), F-74160 Archamps, France.
3Clinical Chemistry Central Laboratory, Geneva University
Can-tonal Hospital, CH-1211 Geneva 14, Switzerland.
4To whom correspondence should be addressed. (e-mail: begonia.
delgado@pharm.unige.ch)
ABBREVIATIONS: J, extraction flux (units: nmol/h); RI.S., ratio
between lithium (Li) and internal standard (I.S.) extraction fluxes (JLi/JI.S.); CLi, lithium subdermal concentration (units: mM);␥,
pro-portionality constant (units:l/h) between JLiand CLi;␥
#,
propor-tionality constant (units: M−1) between R
I.S.and CLi; ta, transport
number of ion a; Ke, elimination rate constant (units: min −1); T
1/2,
half-life (min); Ct, concentration at a given time t (mM); Vd, volume
of distribution (ml); Cl, clearance (ml/h).
1214
been shown that the electroosmotic transport of an analyte is directly proportional to the concentration of the species pres-ent in the solvpres-ent (19,22).
The Glucowatch Biographer (Cygnus, Inc., Redwood City, CA, USA), which monitors blood sugar, is the only approved reverse iontophoretic system on the market (23). Before use, the device has to be calibrated via a conventional finger-stick so that the amount of electroosmotically ex-tracted glucose (measured in situ by the appparatus), in a defined period of current passage, can be related to the cor-responding blood level. At present, it is unknown whether iontophoretic devices relying on electromigrative extraction will also require a similar calibration; such would be the case, for example, if the transport number of a specific ion dem-onstrated a significant inter-individual variability in vivo.
In any case, the development of a noninvasive calibration procedure can clearly be identified as a sensible priority for future applications of reverse iontophoresis in drug monitor-ing, and, recently, the use of an “internal standard” approach has been proposed (10,11,24). The procedure takes advantage of the fact that iontophoretic extraction is not specific. For example, in the case of lithium, several other cations will be simultaneously extracted at the cathode. If one of these ions, which may be referred to as the “internal standard,” is present in the body at a relatively constant concentration, then its iontophoretic flux (JI.S.) would be expected to be constant as well. It follows that the ratio of the extraction fluxes, JLi/JI.S,
should be directly proportional to the ratio of their respective concentrations (CLi/CI.S.) (10,11,24). Given that CI.S.is
con-stant, JLi/JI.S.becomes directly proportional to CLi:
JLiⲐJI.S.= RI.S.= ␥ #⭈ C
Li (2)
where␥#is a constant. This hypothesis is tested here using
sodium and potassium as candidate internal standards for lithium.
In summary, this work explores the potential of reverse iontophoresis as a noninvasive procedure for lithium moni-toring and for pharmacokinetic profiling. In particular, the following questions have been addressed: i) Are iontophoret-ic extraction fluxes of lithium proportional to the correspond-ing subdermal concentrations? ii) Is iontophoresis capable of following sudden changes in the lithium subdermal concen-tration? iii) To what extent may reverse iontophoresis be use-ful for pharmacokinetic studies? iv) Does the “internal stan-dard” calibration approach work?
MATERIALS AND METHODS Materials
Eight molar (8 M) LiCl solution, NaCl, KCl, NaOH, KOH, Hepes, Tris, TrisHCl, Mops, Ag wire 99.9%, AgCl 99%, and Pt 99.9% were purchased from Sigma-Aldrich (Saint Quentin Fallavier, France). Deionized water (resistiv-ityⱖ18.2 M⍀ ⭈ cm) was used to prepare all solutions.
Skin Preparation
Porcine ears were obtained fresh from the local slaugh-terhouse (S.O.D.E.X.A., Annecy, France) and were cleaned under cold running water. The whole skin was removed care-fully from the outer region of the ear and separated from the
underlying cartilage with a scalpel. Both full thickness and dermatomed (∼750 m) skin were used. The skin was wrapped individually in Parafilm and maintained at –20°C for no longer than 2 months. All experiments were performed with 3 to 6 replicates, using skin samples originating from different pigs.
Equipment
Two types of iontophoretic cells were used: a) vertical iontophoretic cells (25) with an effective transport area of 0.78 cm2, a 6.5-ml subdermal volume and 1-ml electrode
chambers; and b) side-by-side three-compartment cells (11) with a 1-cm2skin surface area, a 4.54 ± 0.15 ml subdermal
compartment, and 1.5-ml electrode chambers. Access ports to the subdermal compartment permitted the lithium concentra-tion to be perfused at a fixed level, to be changed abruptly, and to be modulated continuously over time so as to mimic a pharmacokinetic profile. A manual power supply (either a KEPCO 1000M, Flushing, NY, USA, or a Yokogawa 7651, Tokyo, Japan) was used to deliver a constant current via Ag/AgCl electrodes (26).
Fixed-Concentration Extraction Experiments
Full-thickness skin was clamped in vertical iontophoretic cells. First, the subdermal and anodal compartments were filled with a pH 7.4 buffer comprising 25 mM Hepes and 133 mM NaCl. The cathodal compartment was filled with a pH 7.4 buffer comprising 25 mM Hepes and 10 mM KCl.
After 30 min equilibration, the anodal and cathodal so-lutions were refreshed. The subdermal chamber was filled with the “donor” solution, which consisted of the same buffer to which lithium chloride was added at one of three different concentrations (0.6, 1.0, and 1.5 mM) corresponding to the drug’s therapeutic range. Iontophoresis was performed for 5 h by applying a constant current of 0.4 mA via Ag/AgCl elec-trodes. The current was stopped hourly to permit the collec-tion and replacement of the entire electrode chambers solu-tions. Three replicates were made. The samples were assayed for lithium by graphite furnace atomic spectrometry (GFAS).
Stepwise Concentration Change Experiments
Dermatomed skin was clamped between the three com-partments of side-by-side cells. During a 30-min equilibration period, the subdermal compartment was filled with 3.5 ml of a pH 7.4 buffer solution containing 32 mM Tris, 34 mM Mops and 133 mM NaCl. The anodal chamber was filled with a pH 7.4 buffer comprising 90 mM Tris/Tris HCl, whereas the cathodal chamber was also buffered at physiological pH with 32 mM Tris and 34 mM Mops. Subsequently, the anodal and cathodal solutions were refreshed. The subdermal chamber was filled with the same buffer to which 4 mM potassium chloride and lithium chloride at either 0.95 mM (first experi-ment) or 1.7 mM (second experiexperi-ment) were added. The con-centration of LiCl in the subdermal donor solution was then changed in a stepwise fashion at 120 and 210 min: in the first experiment, to 2.7 mM and 1.8 mM, respectively; in the sec-ond, to 0.6 and 1.1 mM.
Iontophoresis was performed for 5 h at a constant cur-rent of 0.4 mA. Six replicates were carried out. Every 30 min, the current was stopped and the entire electrode chamber
solutions were sampled and refilled with fresh buffer. The samples were assayed for lithium by graphite furnace atomic spectrometry (GFAS) and for potassium and sodium by flame atomic absorption spectrometry (FAAS).
Concentration-Profile Kinetic Experiments
Dermatomed skin was clamped in side-by-side cells. Af-ter an equilibration period as described before, the solutions in the three compartments were refreshed. Then, the lithium content of the subdermal solution was varied to simulate the plasma concentration profile observed after either an IV bolus or a continuous infusion (see below). Iontophoresis was performed at a constant current of 0.4 mA for 5 h. Every 30 min, the current was stopped (for a period of∼5 min) to permit the collection and the replacement of the entire elec-trode solutions. At the midpoint of each of iontophoretic pe-riod, 10l of the subdermal solution were sampled, and the actual concentrations of lithium, sodium and potassium therein were quantified by ionic chromatography with con-ductimetric detection, allowing their iontophoretic extraction fluxes to be calculated.
Intravenous Bolus
A syringe pump (Genie 8, Kent Scientific Corporation, Torrington CT, USA) infused the subdermal buffer (pH 7.4, 32 mM Tris, 34 mM Mops, 133 mM NaCl, 4 mM KCl) at a rate of 1 ml/h. After 1 h of iontophoresis, 6.2l of a 0.8 M aqueous solution of LiCl were directly added via a bolus injection into the subdermal compartment of each cell.
Constant Rate Infusion
A syringe pump infused the subdermal buffer as before, but at a rate of 4 ml/h. After 1 h of iontophoresis, the com-position of the infused solution was modified to incorporate 1.4 mM LiCl.
Analytical Techniques
Graphite furnace atomic absorption spectrometry with Zeeman effect quantified lithium at 670.8 nm (Perkin Elmer 4100 ZL, Norwalk, CT, USA).
The samples were diluted 20-fold in 0.2% HNO3before injection.
Flame atomic absorption spectrometry (Perkin Elmer AA Analyst 300, Perkin-Elmer Corporation) was used to measure sodium and potassium concentrations in iontopho-retic and donor samples. The ions were quantified at 589.1 nm and 769.9 nm, respectively, after a 10-fold dilution of the samples in 10% HNO3.
Ionic chromatography was used to quantify lithium, so-dium, and potassium. The Dionex DX-600 system (Voisins le Bretonneux, France) was equipped with a GP-50 pump and an AS-50 thermal compartment (25°C). A 6 mM H2SO4 mo-bile phase was pumped (1 ml/min) through a CS-16 cationic column. Detection involved a ED-50 detector and an Atlas suppressor (61 mA) .
Statistics
Data analysis, linear and nonlinear regressions were per-formed with Graph Pad Prism V.4.0 (GraphPad Software Inc.
San Diego, CA, USA). All linear regressions shown in this work were significant (p < 0.001). The data from each ionto-phoresis cell was individually fitted to the corresponding re-gression equation, and the “kinetic” values derived corre-spond to the average and standard deviation (SD) of 6 cells. Kruskal-Wallis and repeated measures ANOVA analysis were performed with SigmaStat V.2.03 (SPSS Science Soft-ware GmbH, Erkrath, Germany). The statistical significance level was fixed at p < 0.05. (AUC)0→twas determined via the trapezoidal method (Prism V.4.); (AUC)t→⬁ was calculated from the ratio of the last value measured to the elimination constant rate (27).
RESULTS AND DISCUSSION
Fixed-Concentration Extraction Experiments
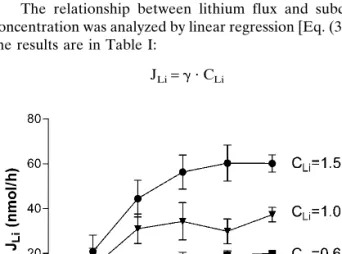
This first set of experiments verified the concentration dependence of the lithium iontophoretic extraction flux over the therapeutic range. Lithium was extracted at the cathode as expected. Figure 1 shows that lithium flux stabilized after approximately 2–3 h of iontophoresis. The delay results from the fact that, when the current is started, the most readily available charge carriers are the endogenous ions already present inside the skin (18); only after this “reservoir” is de-pleted can lithium assume its full role in transporting charge across the barrier. Lithium transport became steady after a few hours of iontophoresis, in a similar manner to that re-ported for acetate (11), but more rapidly than valproate (∼5 h) (10) and phenytoin (>10 h) (11). The iontophoretic lithium flux, when the “donor” concentration was 0.6 mM, reached 20.0 ± 1.0 nmol⭈ h−1, a value nearly an order of magnitude
greater than that found for valproate (2.3 nmol⭈ h−1) under
similar conditions (10). This illustrates the critical role of the physicochemical properties of the analyte of interest in deter-mining the feasibility of iontophoretic extraction. Lithium, being smaller, more mobile and much less lipophilic than val-proate, competes much better in carrying the charge across the skin. Furthermore, electroosmosis assists lithium trans-port while reducing that of the anionic valproate (19).
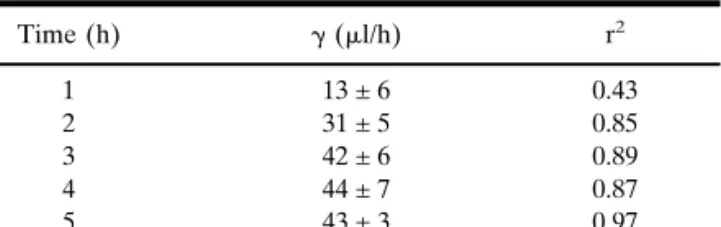
The relationship between lithium flux and subdermal concentration was analyzed by linear regression [Eq. (3)], and the results are in Table I:
JLi= ␥ ⭈ CLi (3)
Fig. 1. Reverse iontophoretic extraction fluxes of lithium as a
func-tion of time and subdermal lithium concentrafunc-tion. Each data point represents the mean ± standard deviation (n⳱ 3).
The values of the slope (␥) progressively increased until the third hour of extraction. Satisfactory correlation coefficients were observed as early as 2 h after the initiation of iontopho-resis (r2 ⳱ 0.85), with the best correlation obtained at 5 h
(r2⳱ 0.97). Overall, this first experiment demonstrated that
a linear relation between lithium extraction flux and the sub-dermal concentration of the drug is established after a rela-tively short sampling time.
Stepwise Concentration Change Experiments
The experiments began with an initial 2-h period of cur-rent passage, during which the lithium subdermal concentra-tion was maintained constant at either 0.95 mM or 1.7 mM (Figs. 2a and 2b, respectively). During this time, the ionto-phoretic fluxes increased and reached steady values faster than observed before. This was probably due to the smaller thickness of the skin membrane used (dermatomed vs. full-thickness tissue) and the shorter sampling intervals used (30 min vs. 1 h), which allowed the kinetics to be determined more precisely.
The concentration of LiCl in the subdermal solution was then changed in a stepwise fashion at 120 and 210 min: in the first experiment, to 2.7 mM and 1.8 mM, respectively
Table I. Linear Regressions of the Iontophoretic Extraction Fluxes of
Lithium (JLiin Units of nmol/h) as a Function of the Drug’s Subdermal
Concentration (CLi in mM) After Different Times of Iontophoresis
(Data in Fig. 1), According to the Equation JLi⳱ ␥ ⭈ CLi+ Intercept*
Time (h) ␥ (l/h) r2 1 13 ± 6 0.43 2 31 ± 5 0.85 3 42 ± 6 0.89 4 44 ± 7 0.87 5 43 ± 3 0.97
* The absolute values of the intercepts were 9 nmol/h or less.
Fig. 2. Monitoring of lithium subdermal concentration changes: (a) first experiment, (b) second experiment. The
continuous lines indicate the stepwise changes in the subdermal lithium concentrations. The open squares are the lithium iontophoretic fluxes. Each data point represents the mean ± standard deviation (n⳱ 6). Transport numbers of lithium (tLi, open bars) potassium (tK, solid bars), and sodium (tNa, hatched bars) determined from the
ionto-phoretic fluxes in (c) the first experiment and (d) the second experiment. Linear regressions between the ratio of extraction fluxes (RNa) and either the lithium subdermal concentration or the ratio of subdermal concentrations
(Fig. 2a); in the second, to 0.6 and 1.1 mM (Fig. 2b). These sudden changes, which are much more abrupt than any pos-sible in an in vivo situation of course, were carried out to test the responsiveness of reverse iontophoresis to such variations.
Figure 2 shows that iontophoresis was quite efficient in following the stepwise changes in the subdermal composition. Lithium fluxes responded appropriately to the new conditions established in each case and reached new steady values after a relatively short delay. As the “physiological” buffer used remained constant, increasing or decreasing the lithium con-centration conferred, respectively, a better or worse chance for the drug to compete to carry the charge across the skin [i.e., to adopt a higher or smaller transport number (18)].
Taken together, the first two sets of experiments confirm that reverse iontophoresis of a highly mobile drug, such as lithium, can provide credible information about concentra-tion changes occurring in the internal medium with a rela-tively short time-lag.
Internal Standard Calibration
As discussed before, the Glucowatch Biographer re-quires an initial calibration to be performed via a conven-tional (“finger-stick”) blood measurement. Clearly, for thera-peutic drug monitoring, an alternative, noninvasive calibra-tion procedure is essential. We have, therefore, considered the use of an internal standard calibration [Eq. (2)] (10). En-dogenous electrolytes, such as sodium and potassium, seemed, a priori, good candidates as internal standards for lithium reverse iontophoresis. First, these are cations, ex-tracted at the cathode and, like lithium, principally by elec-tromigration. Second, their physiological concentrations are normally quite constant, ranging from 135 to 143 mM for sodium and between 3.3 and 4.6 mM for potassium (28).
To test this idea, potassium and sodium extraction fluxes were also measured in the experiments discussed above. The essential requirement for the internal standard is that its ex-traction flux is independent of the target analyte concentra-tion; in other words, that the transport number of the internal standard is constant and is not affected by variations in the analyte’s subdermal level. Figures 2c and 2d show the trans-port numbers of the three cations calculated using the JLidata in Figs. 2a and 2b and the corresponding measured values of JNa and JK. It is apparent that the sodium and potassium transport numbers were indeed constant within each experi-ment, while that of lithium varied in proportion to the drug’s subdermal concentration.
This finding is completely logical for sodium, which is present subdermally at a much higher concentration than lithium. When lithium transports a slightly greater or smaller amount of charge, due to its subdermal level changing, so-dium (as the major current carrier) is able to “take up the slack” without a significant impact on its transport number (18). On the other hand, for potassium, whose physiological concentration is much closer to lithium’s therapeutic range, one might have expected some compensation between the transport numbers of the two cations. That this is not the case may be explained by the fact that potassium is, in some re-spects, a more “efficient” charge carrier than sodium; that is, while sodium is 30 times more concentrated than potassium in the subdermal solution, the ratio of their extraction fluxes
was only ∼20, meaning that potassium has the significantly higher mobility of the two ions. It is not simply concentration, therefore, which determines the absolute value of a transport number.
The next step was to verify the validity of Eq. (2). The regressions shown in Figs. 2e and 2f demonstrate the corre-lations between the ratio of lithium to sodium extraction fluxes (RNa) and either the lithium subdermal concentration, or the ratio of the subdermal concentrations of the two ions. When the corresponding regressions were performed for RK,
the correlations were satisfactory, though smaller (r2⳱ 0.89
and 0.83, respectively), presumably because of the slightly higher variability observed in potassium fluxes as compared to those of sodium. Nevertheless, overall, this component of the study demonstrated unequivocally that the internal stan-dard concept works in vitro and may constitute a viable ap-proach to normalize lithium iontophoretic extraction for drug monitoring purposes.
Concentration-Profile Kinetic Experiments
Further experiments examined whether transdermal ion-tophoresis could be used to determine pharmacokinetic pa-rameters noninvasively. This was evaluated by simulating two classic plasma profiles in the subdermal compartment of the iontophoretic cells. It should be noted that the goal of these studies was to illustrate the versatility of reverse iontophore-sis; there was no intention here to simulate “real” lithium pharmacokinetics, which can be complex (4,29).
IV Bolus
The first kinetic profile considered was an IV bolus. The one-compartment model was characterized by an average volume of distribution of 4.54 ml (the mean subdermal com-partment volume of diffusion cells) and a clearance of 1 ml/h (the syringe pump rate of perfusion). The dose “injected” was 4.96 moles. The subdermal concentration profile should therefore follow an exponential decay post-injection:
Ct= C0⭈ e−Ke⭈t (4)
where Ctand C0are the lithium subdermal concentration at a given time t and at t⳱ 0, respectively, and Keis the
elimi-nation rate constant. Upon combielimi-nation of i) Eqs. (3) and (4), and ii) Eqs. (2) and (4), two testable hypotheses were defined for this experiment, namely:
JLi= ␥ ⭈ C0⭈ e−Ke⭈t (5)
RI.S.= ␥#⭈ C0⭈ e−Ke⭈t (6)
where the significance of JLi, RI.S.,␥, and ␥#have been
pre-viously defined.
Throughout these experiments, sodium and potassium extraction fluxes were constant averaging 9.4mol/h (±4%) and 0.55mol/h (±11%), respectively. On the other hand, the lithium fluxes, in general, tracked the changes in its subder-mal concentrations. Figure 3 shows the lithium subdersubder-mal concentration, the lithium extraction flux and the ratios of extraction fluxes (JLi/JNa and JLi/JK) as a function of time postinjection. In general, good agreement with the model is observed. The subdermal concentration data allowed the ref-erence values for the parameters characterizing the model to
be determined (Table II). These experimental parameters agreed well with the theoretical values cited above.
Figure 3 reveals that the values of JLi, RNa, and RKdo not conform to the expected profiles [Eqs. (5) and (6)] during the first hour of extraction. In fact, the profiles are reminis-cent of an oral administration, for example, with a very fast absorption phase. After 1 h, however, the three profiles de-creased in parallel with the subdermal Li concentration. It appears therefore, that during the first hour, JLi, RNa, and RK
reflect two concurrent processes: i) the subdermal lithium kinetics and ii) the establishment of steady iontophoresis ex-traction fluxes across the skin. That is, until␥ and ␥#become
constant, the JLi, RNa, and RKprofiles report on both pro-cesses. Once this is achieved, the extraction flux becomes directly and proportionally dependent on the subdermal con-centration, and the slopes of the lines in Fig. 3 are parallel.
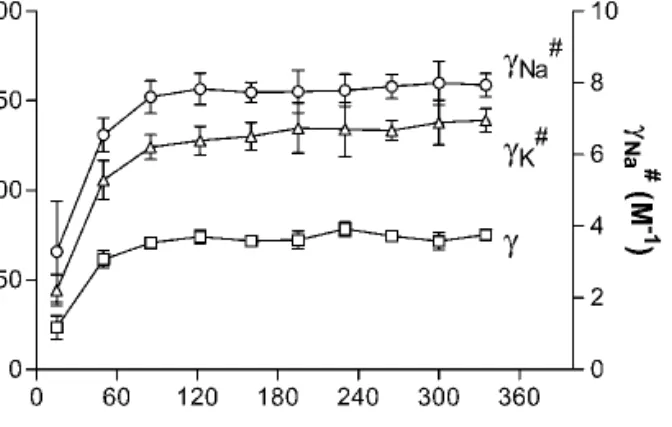
Figure 4 presents the values of␥ and ␥#as a function of
time. A repeated measures ANOVA demonstrates that␥ and ␥# become constant from the third sampling period (after
85 min of iontophoresis). Mean values for␥ (68.8 ± 1.7 l/h), ␥Na
#(7.3 ± 0.2 M−1), and␥ K
#(114.1 ± 4.2 M−1) were
deter-mined by linear regression through the data obtained post 85 min of iontophoresis.
Linear regression of the semi-logarithmic data (after the third sampling period) in Fig. 3 permitted the elimination rate constant (Ke) to be determined from the iontophoretic ex-traction data and compared to the reference value (Table II). In general, Ke was slightly underestimated relative to that calculated from the decay of the subdermal concentrations. Nevertheless, overall, the agreement was really quite good. One possible source of the differences observed is the time required for the iontophoretic sampling. The data point at 85 min, for example, reflects a moving average, so to speak, of the instantaneous values during the sampling period between 70 and 100 min. On the other hand, the subdermal CLiwas measured in a sample taken at exactly 85 min (i.e., the mid-point of the iontophoretic extraction period). An analogy may be drawn between measurements of urinary excretion rates and plasma concentrations. Clearly, when comparing kinetic parameters from the two types of measurement, the degree of error (difference) becomes greater as the sampling period increases. This fact has been recognized in the Gluco-watch with which glycemia is now assessed every 10 min such that very close tracking of glucose levels is possible. In the end, analytical sensitivity is the determining factor—for lithium, with the assay sensitivity and precision presently pos-sible, 5–10 min sampling intervals are feasible.
The iontophoretic extraction data were next used to es-timate additional pharmacokinetic parameters [including the clearance (Cl) and volume of distribution (Vd)]. Equations (5) and (6) indicate that C0can be found provided that␥ and
␥#, respectively, are known. Knowing C
0, it is then
straight-forward to assess Vd(⳱ dose/C0) and Cl (⳱ Ke⭈ Vd). The
first step, therefore, was to identify the values of␥ and ␥#to
be used. Figure 4 shows that these coefficients of proportion-ality become reasonably constant after about 1.5 h of
ionto-Fig. 3. Simulated lithium bolus administration (top panel) and a
semi-logarithmic transformation of the data (bottom panel). The solid squares are the subdermal lithium concentrations; the open squares are the iontophoretic extraction fluxes of the drug (JLi). The
open circles and open triangles are, respectively, the extraction flux ratios, RNaand RK. Each data point represents the mean ± standard
deviation (n⳱ 6). Solid lines of simple interpolation through the data are shown in the top panel; the dashed lines in the bottom panel, on the other hand, are linear regressions.
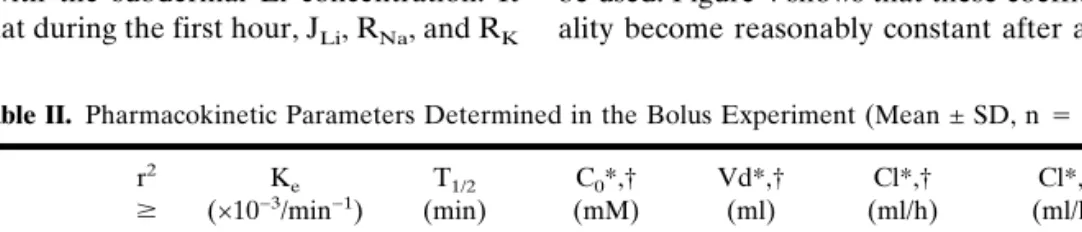
Table II. Pharmacokinetic Parameters Determined in the Bolus Experiment (Mean ± SD, n⳱ 6)
r2 ⱖ Ke (×10−3/min−1) T1/2 (min) C0*,† (mM) Vd*,† (ml) Cl*,† (ml/h) Cl*,‡ (ml/h) CLi Subdermal 0.99 4.2 ± 0.3 168 ± 14 1.01 ± 0.06 4.9 ± 0.3 1.22 ± 0.05 1.21 ± 0.04 JLi 0.99 3.9 ± 0.2 180 ± 10 0.99 ± 0.06 5.0 ± 0.3 1.17 ± 0.02 1.21 ± 0.03 RK 0.96 3.6 ± 0.3§ 193 ± 15§ 0.97 ± 0.06 5.1 ± 0.3 1.10 ± 0.07§ 1.21 ± 0.09 RNa 1.00 3.8 ± 0.2 181 ± 9 0.98 ± 0.06 5.1 ± 0.3 1.17 ± 0.04 1.22 ± 0.06
* Values determined using␥, ␥#, or␥, Na
#, respectively.
† Calculated assuming a one-compartment model: Vd⳱ dose/C0, Cl⳱ Ke⭈Vd.
‡ Model independent calculation using the corresponding area-under-the-curve.
§ Value significantly different from reference value obtained from the direct measurements of CLi(p <
phoresis, and the mean values from this point on are the logical choices for the determination of the pharmacokinetic parameters of interest (Table II). The Vdand Cl determined
in this way are quite close to the reference values. Though this type of calculation based on in vitro data is usefully illustra-tive, it remains to be seen in vivo the extent to which␥ and/or ␥#vary within and between subjects; that is, will it be
neces-sary to determine␥ and/or ␥#for every patient or will a
popu-lation average be sufficiently precise for all subjects? In the former ease, of course, careful calibration with blood sam-pling would be necessary for each person in order to define the value of the constant(s) to be used.
Self-evidently, the internal standard calibration approach leading to the deduction of ␥# is envisaged as a means to
completely avoid calibration with blood sample. The con-stancy of Na+extraction in this work speaks to its
consider-able potential in this regard; on the other hand, potassium, which was also evaluated, yielded more variable results. Cer-tainly with Na+, then, the approach could be useful for a
therapeutic monitoring application during lithium therapy. Care is necessary with respect to the kinetics, however, as a finite time is required before ␥ and ␥# reach stable values
(Fig. 4). Whether this delay is partly an artefact, caused by the experimental design in which Na+ and K+ extraction fluxes
were stabilized before Li was “injected” into the subdermal solution, remains to be seen. In a recent study (10) examining the idea of valproate monitoring by reverse iontophoresis, and using glutamate as an internal standard, the value of␥#
was constant from the very first sampling period, even though the extraction fluxes had not stabilized by this time. It is important to note, in this case, that the two ions were intro-duced simultaneously into the subdermal compartment. It fol-lows that, for a patient receiving chronic lithium therapy, it is reasonable to expect␥#to become constant more rapidly than
that observed in the in vitro work presented here.
Constant Rate Infusion
The second situation considered was a constant infusion (5.6moles/h) of lithium chloride into the subdermal com-partment having Vd∼4.54 ml. The clearance was 4 ml/h. The drug concentration profile, in this case, is described by Eq. (7) (27,30):
Ct= Css共1 − e−Ke⭈t兲 = K0 Ke⭈ Vd
共1 − e−Ke⭈t兲 (7)
which predicts that CLiwill increase exponentially to a steady-state plateau, Css. Figure 5 shows that this plateau level (∼1.3 mM) was attained after 3–3.5 h of perfusion. When the subdermal concentration profile was fitted to equation 7 (r2ⱖ 0.94, nonlinear regression), the following reference
val-ues were obtained; Ke⳱ 0.014 ± 0.001 min−1; T
1/2⳱ 50 ± 4 min;
Css⳱ 1.32 ± 0.03 mM; Vd⳱ 5.1 ± 0.3 ml; and Cl ⳱ 4.2 ± 0.1
ml/h.
Figure 5 also demonstrates that the iontophoretic extrac-tion of Li flux and the extracextrac-tion flux ratios (RNaand RK) also increased exponentially toward steady-state values, conform-ing to the followconform-ing equations, which result from the substi-tution of Eqs. (3) and (2), respectively, into Eq. (7):
Jt= Jss⭈ 共1 − e−Ke⭈t兲 = ␥ ⭈ Css⭈ 共1 − e−Ke⭈t兲 (8)
Rt= Rss⭈ 共1 − e−Ke⭈t兲 = ␥#⭈ C
ss⭈ 共1 − e
−Ke⭈t兲 (9)
The significance of JLi, RI.S.,␥, and ␥#are as before; Jss
and Rss represent the steady-state values of JLi and RI.S., respectively.
Interpretation and analysis of the iontophoretic extrac-tion flux data were more complicated than the IV bolus case. In the latter situation, the only “pharmacokinetic” process taking place in the subdermal compartment is drug elimina-tion. In contrast, in the infusion scenario, there is both “input” and elimination; it should be recalled, furthermore, that the time to steady-state under these circumstances is on the order of four elimination half-lives. Again, because of these concur-rent processes, the model described by Eqs. (8) and (9) fits the results very well after about 1 h (when the two first samples are omitted). The evolution of␥ and ␥#with time is
shown in Fig. 6. It is first noted that the absolute values of these parameters are very similar to those observed in the I.V. bolus experiments (Fig. 4), supporting the contention that these proportionality constants may show very small interin-dividual differences. However, it takes longer (2.5–3 h) for the values of␥ and ␥# to stabilize in the infusion situation
(repeated measures ANOVA). At this point, it was deduced
Fig. 4. Proportionality constants␥ and ␥#[defined in Eqs. (3) and (2),
respectively, and determined from the bolus experiment] vs. time. Each data point represents the mean ± standard deviation (n⳱ 6).
Fig. 5. Iontophoretic monitoring of lithium during a simulated
con-stant infusion to steady-state. The subdermal lithium concentration profile is represented by the solid squares, and the line through the data is a fitted curve according to Eq. (7); the open squares are the iontophoretic extraction fluxes of the drug (JLi) [data fitted to Eq.
(8)]. The open circles and open triangles are, respectively, the extrac-tion flux ratios, RNaand RK[results fitted using Eq. (9)]. Each data
that␥ ⳱ 65 ± 14 l/h, ␥K#⳱ 135 ± 43 M−1, and␥ Na
#⳱ 7.6
± 1.4 M−1. It is logical to suppose that the increased time for
stabilization is due to the fact that steady-state kinetics are approached slowly in the experimental infusion model here tested.
Thus, iontophoretic extraction fluxes become progres-sively more reflective of the subdermal kinetics with increas-ing time. When the iontophoretic data in Fig. 5 are fitted to Eqs. (8) and (9), the values of Jss, and Rssare very close either
to the experimental results or to the theoretical value. Simi-larly, the derived values for clearance were 4.1 ± 0.1 (from JLi), 4.1 ± 0.2 (from RNa) and 4.1 ± 0.1 ml/hour (from RK) which are in excellent agreement with the reference value of 4.2 ± 0.1 ml/h.
Estimation of Kefrom the iontophoretic extraction data was more challenging. This parameter was obviously under-estimated when data from the earliest sampling times were included (Fig. 7). When these initial results were omitted, the fitting procedure improved (r2ⱖ 0.8); for example, analysis of
data from 85 min onward resulted in values of Ke(in min−1)
of 0.0095 ± 0.0003 (from JLi), 0.0091 ± 0.0009 (from RK), and
0.0091 ± 0.0005 (from RNa). The “reference” value, it is
re-called, was 0.014 min−1. Thereafter, if results only from the
latter half of the experiment are fitted (Fig. 7), the resulting Ke increased somewhat but not significantly, and the good-ness-of-fit decreased. It is not clear whether, in this experi-ment, the iontophoretic fluxes could ever provide a better estimation of Ke. Once steady-state is achieved, of course, the sensitivity of the model to determine Keis lost. It follows that there is a temporal “window of opportunity” for the estima-tion of Ke; long enough has to have elapsed so that the
ex-traction fluxes have caught up with the subdermal kinetics, but not so long that steady-state is close to having been at-tained. On the other hand, the results demonstrate an effec-tive means with which to determine noninvasively, and quite accurately, a drug’s clearance.
In conclusion, the results presented here demonstrates that reverse iontophoretic monitoring of lithium is concentra-tion-dependent, and that quantitative information about the drug’s subdermal level can be obtained without a “blood” measurement via the use of Na+ and/or K+ as an “internal
standard”. The iontophoretic extraction flux of Li, and the ratio of this flux to that of either Na+or K+, tracks
pharma-cokinetic changes in the drug’s subdermal concentration rap-idly and faithfully, allowing the remarkably noninvasive de-termination of certain pharmacokinetic parameters that are presently available only via plasma or whole blood measure-ments.
ACKNOWLEDGMENTS
We thank P. Bonnabry and H. Ing at the Central Phar-macy of the Geneva University Cantonal Hospital for making available the flame atomic absorption spectrometry appara-tus. This research was supported by the Swiss National Research Foundation (3200-059042.99/1) and by the U.S. National Institutes of Health (EB-001420).
REFERENCES
1. B. Bailey, J. Klein, and G. Koren. Noninvasive methods for drug measurement in pediatrics. Pediatr. Clin. North Am. 44:15–26 (1997).
2. L. J. Rice. Needle phobia. An anesthesiologist’s perspective.
J. Peadiatr. 122:S9–S13 (1993).
3. A. Amdisen. Serum concentration and clinical supervision in monitoring of lithium treatment. Ther. Drug Monit. 2:73–83 (1980).
4. A. Amdisen. Serum level monitoring and clinical pharmacokinet-ics of lithium. Clin. Pharmacokinet. 2:73–92 (1977).
5. R. F. Kehoe. Monitoring lithium treatment. BMJ 306:269–270 (1993).
6. M. Schou. Lithium treatment during pregnancy, delivery, and lactation: an update. J. Clin. Psychiatry 51:410–413 (1990). 7. S. Pichini, I. Altieri, P. Zuccaro, and R. Pacifici. Drug monitoring
in nonconventional biological fluids and matrices. Clin.
Pharma-cokinet. 30:211–228 (1996).
8. J. P. Moody. Biologic variation of serum and salivary lithium.
Ther. Drug Monit. 21:97–101 (1999).
9. R. Obach, J. Borja, J. Prunonosa, J. M. Valles, J. Torrent, I. Iz-quierdo, and F. Jane. Lack of correlation between lithium phar-macokinetic parameters obtained from plasma and saliva. Ther.
Drug Monit. 10:265–268 (1988).
10. M. B. Delgado-Charro and R. H. Guy. Transdermal reverse ion-tophoresis of valproate: a non-invasive method for therapeutic drug monitoring. Pharm. Res. 20:1508–1513 (2003).
11. B. Leboulanger, R. H. Guy, and M. B. Delgado-Charro. Reverse iontophoretic monitoring of free phenytoin. Ther. Drug Monit.
25:499 (2003). Fig. 6. Proportionality constants␥ and ␥#[defined in Eqs. (3) and (2),
respectively, and determined from the constant infusion experiment] vs. time. Each data point represents the mean ± standard deviation (n⳱ 6).
Fig. 7. Values of Ke(mean ± SD; n⳱ 6) determined from the
con-stant infusion experiment. Data for JLi, RNa, and RK(filled, open,
and hatched bars, respectively) were fitted to Eqs. (8) and (9). The results were calculated from the individual data obtained during the different time intervals indicated on the abscissa. The dashed line at Ke⳱ 0.014 min
12. V. Merino, A. Lopez, D. Hochstrasser, and R. H. Guy. Nonin-vasive sampling of phenylalanine by reverse iontophoresis.
J. Control. Rel. 61:65–69 (1999).
13. G. Rao, P. Glikfeld, and R. H. Guy. Reverse iontophoresis: de-velopment of a non invasive approach for glucose monitoring.
Pharm. Res. 10:1751–1755 (1993).
14. J. A. Tamada, N. J. V. Bohannon, and R. O. Potts. Measurement of glucose in diabetic subjects using noninvasive transdermal ex-traction. Nat. Med. 1:1198–1201 (1995).
15. M. J. Tierney, J. A. Tamada, R. O. Potts, R. C. Eastman, K. Pitzer, N. R. Ackerman, and S. J. Fermi. The GlucoWatch威 biographer: a frequent automatic and noninvasive glucose moni-tor. Ann. Med. 32:632–641 (2000).
16. R. R. Burnette. Iontophoresis. In J. Hadgraft and R. H. Guy (eds.), Transdermal Drug Delivery, Marcel Dekker, New York, 1989, pp. 247–291.
17. P. W. Ledger. Skin biological issues in electrically enhanced transdermal delivery. Adv. Drug Deliv. Rev. 9:289–307 (1992). 18. J. B. Phipps and J. R. Gyory. Transdermal ion migration. Adv.
Drug Deliv. Rev. 9:137–176 (1992).
19. M. J. Pikal. The role of electroosmotic flow in transdermal ion-tophoresis. Adv. Drug Deliv. Rev. 9:201–237 (1992).
20. B. Leboulanger and R. H. Guy. and M. B. Delgado-Charro Re-verse iontophoresis for non-invasive transdermal monitoring.
Physiol. Meas. 25:R35–R50 (2003).
21. D. Marro, Y. N. Kalia, M. B. Delgado-Charro, and R. H. Guy.
Contributions of electromigration and electroosmosis to ionto-phoretic drug delivery. Pharm. Res. 18:1701–1708 (2001). 22. R. R. Burnette and B. Ongpipattanakul. Characterization of the
permselective properties of excised human skin during iontopho-resis. J. Pharm. Sci. 76:765–773 (1987).
23. R. O. Potts, J. A. Tamada, and M. J. Tierney. Glucose monitoring by reverse iontophoresis. Diabetes Metab. Res. Rev. 18:S49–S53 (2002).
24. A. Sieg, R. H. Guy, and M. B. Delgado-Charro. Reverse ionto-phoresis for non-invasive glucose monitoring: the internal stan-dard concept. J. Pharm. Sci. 92:2295–2302 (2003).
25. P. Glikfeld, C. Cullander, R. S. Hinz, and R. H. Guy. A new system for in vitro studies of iontophoresis. Pharm. Res. 5:443– 446 (1988).
26. P. G. Green, R. S. Hinz, C. Cullander, G. Yamane, and R. H. Guy. Iontophoretic delivery of amino acids and amino acid de-rivatives across the skin in vitro. Pharm. Res. 8:1113–1120 (1991). 27. G. Houin. Pharmacocinétique, Edition Marketing, Paris, France,
1990.
28. R. J. Flanagan. Guidelines for the interpretation of analytical toxicology results and unit of measurement conversion factors.
Ann. Clin. Biochem. 35:261–267 (1998).
29. M. E. Winter. Lithium. In M. E. Winter (ed), Basic clinical
phar-macokinetics, Applied Therapeutics, Vancouver, WA, USA,
1994, pp. 257–265.
30. M. E. Winter. Basic Clinical Pharmacokinetics, Applied Thera-peutics, Vancouver, WA, USA, 1994.
![Fig. 6. Proportionality constants ␥ and ␥ # [defined in Eqs. (3) and (2), respectively, and determined from the constant infusion experiment]](https://thumb-eu.123doks.com/thumbv2/123doknet/14871278.639984/8.945.109.445.98.310/proportionality-constants-defined-respectively-determined-constant-infusion-experiment.webp)
![[PDF] Cours Envoi d'e-mail avec ASP.Net | Cours informatique](data:image/gif;base64,R0lGODlhAQABAIAAAP///wAAACH5BAEAAAAALAAAAAABAAEAAAICRAEAOw==)