Vascular Dynamics of Cerebral Gliomas
Investigated with Selective Catheter
Angiography, Perfusion CT and MRI
Roland Wiest
1, Ralph Schaer
1, Michael H. Reinert
2, Ferdinand H. von Bredow
1,
Marwan M. El Koussy
1, Luca Remonda
1, Gerhard Schroth
1, Christoph Ozdoba
1,
Johannes Slotboom
1 AbstractPurpose: To assess if intratumoral blood circulation parameters from dynamic susceptibility contrast (DSC) MRI and dy-namic CT deliver comparable results and to compare tumor-related changes in regional cerebral blood flow (rCBF) and re-gional cerebral blood volume (rCBV) with arterial, intratumoral, and venous transition detected with digital subtraction angiography (DSA).
Patients and Methods: Ten patients with cerebral gliomas were prospectively studied with DSC-MRI, dynamic CT and DSA. Tumor areas were segmented and perfusion maps for rCBF, rCBV, and mean transit time (MTT) were computed from DSC-MRI and dynamic CT. Arterial circulation time (ACT), intermediate circulation time (ICT), and venous appearance time (VAT) were measured with DSA. Asymmetry indices (AIs) were calculated for MRI- and CT-based perfusion values, for ICT and VAT and compared among each other.
Results: DSC-MRI and dynamic CT yielded comparable AI values for rCBF (MRI: 39.5 ± 20.4, CT: 36.0 ± 17.9, Pearson’s correlation r2 = 0.91) and rCBV (MRI: 44.6 ± 20.9 vs. CT: 40.9 ± 16.3, r2 = 0.84). The MTT AI (MRI: –4.7 ± 11.2 vs. CT: –0.5 ±
10.4, r2 = 0.47) showed only a weak correlation. ICT correlated with rCBV (ICT: 38.4 ± 14.7, r2 = 0.59, and dynamic CT:
r2 = 0.81) and VAT with rCBF (VAT: 31.7 ± 17.6, r2 = 0.73, and dynamic CT: r2 = 0.87), but not with MTT.
Conclusion: CT and MRI methods provide consistent information about tumor vascularity of cerebral gliomas in accor-dance with DSA.
Key Words: Perfusion CT · MRI · Angiography · Glioma · Grading Clin Neuroradiol 2008;18:98–106
DOI 10.1007/s00062-008-8011-y
Durchblutung zerebraler Gliome. Eine Studie mit DSA, Perfusions-CT und MRT Zusammenfassung
Ziel: Vergleichsstudie zur Perfusionsmessung mittels CT- und MR-Perfusion bei Hirntumoren mit der Fragestellung, in-wieweit beide Schnittbildverfahren bezüglich der Parameter regionaler zerebraler Blufluss (rCBF), regionales zerebrales Blutvolumen (rCBV) und mittlere Transitzeit (MTT) vergleichbare Ergebnisse zeigen. Die Ergebnisse werden mit den dyna-mischen Untersuchungsergebnissen der digitalen Subtraktionsangiographie (DSA) verglichen.
Patienten und Methodik: Zehn Patienten mit hirneigenen Tumoren wurden prospektiv mittels MR-Perfusion, CT-Perfu-sion und DSA untersucht. Die Tumoren wurden segmentiert. In den segmentierten Arealen wurden rCBF, rCBV und MTT aus den Daten beider Modalitäten berechnet. Die arterielle Zirkulationszeit (ACT), intermediäre Zirkulationszeit (ICT) und venöse Anflutungszeit (VAT) wurden mittels DSA bestimmt. Regionenbasierte Asymmetrieindizes wurden für die CT- und MR-Perfusion, für ICT und VAT berechnet und verglichen.
Ergebnisse: MR- und CT-Perfusion lieferten vergleichbare Ergebnisse für rCBF (MRT: 39,5 ± 20,4, CT: 36,0 ± 17,9, Pearson-Korrelation r2 = 0,91) und rCBV (MRT: 44,6 ± 20,9 vs. CT: 40,9 ± 16,3, r2 = 0,84). Der Asymmetrieindex für MTT (MRT: –4,7 ±
1Institute of Diagnostic and Interventional Neuroradiology, Inselspital, University of Bern, Switzerland, 2Department of Neurosurgery, Inselspital, University of Bern, Switzerland.
Introduction
In clinical practice, computed tomography (CT) and magnetic resonance imaging (MRI) are the investiga-tions of choice in the evaluation of brain tumors [1–3]. Angiographic techniques for the detection of neovascu-larity or arteriovenous shunting [4] and brain perfusion techniques like dynamic susceptibility contrast-(DSC-) MRI and dynamic CT may assist in distinguishing high-grade from low-high-grade tumors [5, 6]. The detection of early opacification of a tumor-draining vein and the dy-namics of tumor hypervascularity are still useful obser-vations to determine tumor grading without biopsy, es-pecially when the tumor is located in an eloquent region of the brain. Several studies have demonstrated the cor-relation between microvessel density and increased rel-ative cerebral blood volume in high-grade tumors with DSC-MRI [7–10]. To a lesser extent, the dynamic CT approach has been used in animal models and clinical practice [11, 12]. Yet, only few studies have focused on the comparability and reproducibility of different brain perfusion techniques in brain tumor imaging [13]. The routine use of CT in initial neuroradiologic diagnostics as well as its widespread clinical availability make dy-namic CT a useful method to generate parametric maps of regional cerebral blood flow (rCBF) and regional ce-rebral blood volume (rCBV) for tumor grading.
The calculation of rCBF and rCBV according to the indicator-dilution theory [14], which is the basis of most commercially available software programs today, is lim-ited due to the disruption of the blood-brain barrier and may lead to an overestimation of CBF and CBV. Be-yond complex calculations of fractional plasma volume and vascular transfer constant [15], digital subtraction angiography (DSA) offers the advantage of directly in-vestigating the increased tissue perfusion and its influ-ence on intratumoral blood velocity with a high tempo-ral and spatial resolution method. Comparative studies, however, which investigate the vascularity of cerebral gliomas with different parametric imaging techniques
and DSA, do not exist. The purpose of the study was to test if (1) intratumoral blood circulation parameters are comparable between DSC-MRI and dynamic CT in a single-compartment model, and (2) if tumor-related relative changes of rCBF and rCBV in DSC-MRI and dynamic CT match the arterial, intratumoral and ve-nous transition as determined from DSA.
Patients and Methods Patients
Ten patients, five women and five men, aged between 44 and 78 years (mean age 57.1 years), with suspected gliomas, as detected with conventional MRI (Table 1), were prospectively studied with DSC-MRI, dynamic CT and DSA. Informed consent was obtained from every patient according to the rules of the local ethics committee. All patients had clinical findings suggestive either of increased intracranial pressure or a focal neu-rologic deficit. All patients underwent DSC-MRI and dynamic CT on the same day. DSA was performed on the following day in all patients. Histological grading using stereotaxy or open tumor resection was done in seven patients. Two patients were histologically diag-nosed with oligodendroglioma (WHO grade II and III), one patient with anaplastic astrocytoma (WHO grade III), and four patients with glioblastoma (WHO grade IV). Yet another three patients were diagnosed with glioblastoma (WHO grade IV) based on MRI findings, the detection of an early tumor-draining vein with DSA, and clinical and MRI follow-up. Histologi-cal confirmation was not obtainable in these cases due to unresectable tumors located in eloquent areas of the brain where even stereotactic biopsy was considered to be associated with an intolerable risk of periprocedural complications. These patients were treated with com-bined irradiation and chemotherapy. Although tumor grading is based on pathohistological evaluation, the combination of MRI and DSA has been used to ap-proximate tumor grade of gliomas for many years [16]. 11,2 vs. CT: –0,5 ± 10,4, r2 = 0,47) zeigte lediglich eine schwache Korrelation zwischen den Modalitäten. Die ICT korrelierte
mit dem rCBV (ICT: 38,4 ± 14,7, r2 = 0,59, CT: r2 = 0,81) und die VAT mit dem CBF (VAT: 31,7 ± 17,6, r2 = 0,73, CT: r2 =
0,87), jedoch nicht mit der MTT.
Schlussfolgerung: Die Perfusionsmessung intrazerebraler Tumoren mittels CT und MRT liefert vergleichbare Ergebnisse, auch in Übereinstimmung mit der DSA.
During follow-up of the patient cohort, both patients with suspected grade II did not show any signs of dedif-ferentiation up to now. All patients who presented with suspected grade IV glioma died from their brain tumor within 1 year after the MRI, CT, and DSA studies, thus further supporting the suspected diagnosis post hoc. The classification and grading applied in this study are based on the current WHO classification of nervous system tumors [17].
MR and CT Image Acquisition
MRI was performed on a 1.5-T Siemens Sonata system (Siemens Medical Systems, Erlangen, Germany). A dy-namic series was performed after bolus injection of 10 ml Gadovist® 1.0 (Bayer Schering Pharma, Baar,
Switzer-land) acquiring 40 images in twelve adjacent slices us-ing an adapted 2-D echoplanar imagus-ing sequence (slice thickness 5 mm; TR 1.44 s, TE 47 ms; FA 90°, FOV 230 × 230 mm, matrix 128 × 128 interpolated to 256 × 256 for postprocessing). Total acquisition time was 80 s. The CT studies were performed on a GE Light-speed QX/I 8 slice multislice scanner (General Electric, Mil-waukee, WI, USA). A dynamic contrast-enhanced cine scan (80 kV, 200 mA) was performed after bolus injec-tion of 40 ml of a high-iodine-concentrainjec-tion nonionic contrast agent (Iomeron® 400, Bracco SA, Milan, Italy)
with an iodine concentration of 400 mg/ml, as reported previously [18]. The studies were acquired in two adja-cent 10-mm sections with a temporal resolution of 1 s over a period of 45 s.
Angiography
DSA was performed on a biplane angiographic X-ray system (Toshiba KXO-80C & 80D with a Toshiba DFP 2000/A image processing unit, Tokyo, Japan) by the same investigator. DSA images were acquired in standard (an-teroposterior and lateral view) and oblique projections with a time resolution of 0.4 s. Image matrix was 1,024 × 1,024 with a 12" image intensifier. No complications dur-ing or after (in relation to) DSA were reported.
Intraarterial four-vessel selective DSA was per-formed in local anesthesia over conventional 6-F sheaths (Terumo Corp., Tokyo, Japan) via the right or left femoral artery with dedicated 5.5-F catheters (Cook JB-2, Bjaevrskov, Denmark). Selective DSA (83–86 kV, 125 mA) was performed by selective injections of a non-ionic contrast agent (Iopamiro® 300, Bracco SAy) into
both common carotid and vertebral arteries at a flow rate of 5 ml/s. Table 1. Clinical da ta and r egional asymmetries f or rC B F, rC B V , V A T, and ICT (fr om DSC-MR I, dynamic CT and DS A). CT : c omputed tomogr aph y; DS A: digital subtr ac tion angiogr aph y; DSC: dynamic susceptibility c o n tr ast; F: f emale; ICT : in termedia te cir cula tion time; M: male; MR I: magnetic r esonance imaging; rC B F: r egional cer ebr al blood flow; rC B V : r egional cer ebr al blood v olume; V A T: v enous appear ance time; WHO: W orld Health Or ganiz a tion. P ati en t Se x A g e WH O Tu m or site MTT MRI MTT CT rCBF MRI rCBF CT rCBV MRI rCBV CT V A T DS A ICT DS A # (years) gr ad e 1 F 58 II Left pari etal lobe 3.5 –1.1 7.3 10.7 9.8 7.2 4.8 11.1 2 F 78 III Ri gh t par acen tr al lobe –20.8 –4.3 48.1 38.1 29.6 35.9 20.0 27.3 3 M 44 III Ri gh t fr on tal lobe –13.5 –4.56 12.9 15.8 38.1 35.4 15.8 33.3 4 F 69 IV Ri gh t fr on tal an d –6.03 3.62 18.3 16.7 34.3 23.4 23.1 33.3 pari etal lobe 5 M 44 IV Bipari etal 2.87 –7.2 41.0 23.1 21.9 40.3 11.1 45.0 6 F 70 IV Ri gh t pari etal an d –16.78 8.6 42.9 42.9 59.1 58.5 52.9 45.5 occipital lobe 7 M 64 IV Left fr on tal an d –3.69 –1.5 45.4 46.7 55.5 45.8 50.0 33.3 pari etal lobe 8 M 44 IV Left fr on tal lobe 4.14 13.7 51.9 52.9 59.1 55.5 42.9 42.9 9 M 53 IV Left tempor al lobe 12.69 10.0 56.3 60.0 63.6 57.9 46.7 66.7 10 F 47 IV Ri gh t tempor al –18.2 –22.5 70.8 52.7 75.2 49.2 50.0 40.0
Postprocessing and Analysis of Scans
The parameter maps used for the assessment of cere-bral hemodynamics included rCBF, rCBV, and mean transit time (MTT). These were calculated according to the indicator-dilution model for both imaging modali-ties [19]. The parameter maps were computed for both DSC-MRI and dynamic CT with an in-house developed application written in JAVA-2 that uses a singular value decomposition-(SVD-)based algorithm [20]. The appli-cation was specifically developed to handle perfusion imaging data of both imaging modalities.
Regions of interest (ROIs) in the tumor were then segmented semiautomatically from rCBF, rCBV and MTT maps, including solely regions with increased intensity thresholds. For DSC-MRI and dynamic CT evaluation, two ROIs were placed semiautomatically in a corresponding scan for rCBF, rCBV, and MTT. The first ROI was drawn to mark the
tu-mor outline, excluding the necrotic core in highly malignant gliomas. The second ROI of similar volume as the first was applied contralater-ally into the nonaffected white mat-ter through a mirroring function with manual correction (Figure 1). In cases where the neoplasm involved both hemispheres of the brain and mirroring to the corresponding con-tralateral region was not possible, regions of comparable perfusion values within healthy tissue in the frontal or parietal lobe were used for internal reference. In order to com-pare the individual perfusion maps in different vascular areas for every patient, a relative cerebral transit time, blood flow and volume ratio was calculated from all mean DSC-MRI and dynamic CT-based perfu-sion values. Since we do not have the possibility to absolutely quantify CT and MR perfusion values, we have chosen to use the asymmetry index (AI) to compare both meth-ods. The methodological advantage of using these indices is that they are inherently independent of specific machines, protocols, or contrast ki-netics [21, 22]. Arterial,
parenchy-mal, and venous phases in DSA were estimated from direct inspection of the high-resolution DSA images on a PACS workstation (Figures 2a and 2b). The transit time between the monitored points was calculated with a temporal resolution of 0.4 s (2.5 frames/s) as follows: arterial circulation time (ACT) from the start of arte-rial filling of the cavernous part of the internal carotid artery to the time the terminal arterial branches were opacified, intermediate circulation time (ICT) from the end of the arterial filling to the beginning of the venous phase, and venous appearance time (VAT) from maxi-mum arterial opacification to the appearance of con-trast medium in the cortical veins [23]. Separate calcu-lations were performed for the unaffected hemisphere, the affected hemisphere and the tumor region itself. These parameters were directly compared between the middle cerebral arteries (MCA) of the left and right
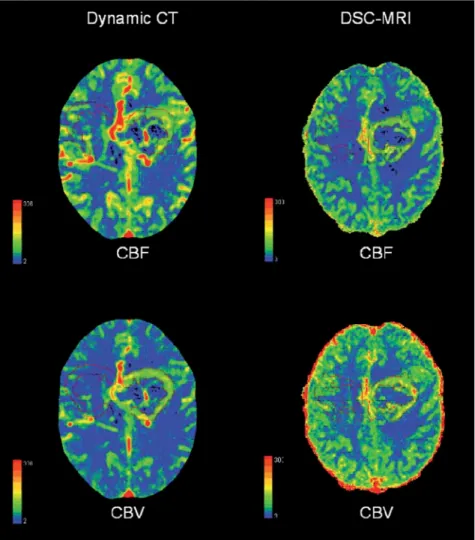
Figure 1. Parametric perfusion maps of patient # 7. Increased rCBF and rCBV are observed in
both DSC-MRI and dynamic CT. According to the higher spatial resolution of the dynamic CT images, the hyperperfused tumor rim is better resolved.
hemisphere if the tumor did not cross the hemisphere, and between the anterior (ACA) and middle cerebral arteries if the tumor crossed the midline. Furthermore, intratumoral arterial, parenchymal, and venous opacifi-cation times as defined above were compared with the respective parameters in the contralateral hemisphere. To compare the time course of the angiogram with the results of the parametric perfusion maps from DSC-MRI and dynamic CT, a relative AI [(affected – unaf-fected region)/(afunaf-fected + unafunaf-fected region)*100] was calculated for every parameter.
Three board-certified neuroradiologists blinded to the histological results reviewed and discussed all DSC-MRI, dynamic CT and DSA studies until consen-sus was obtained. Statistical analysis included Student’s
two-tailed t-test for comparison of the perfusion-based pixel intensity values of DSC-MRI, dynamic CT and the circulation times of DSA. Pearson’s correlation coeffi-cients were calculated to test the correlation between the perfusion parameters obtained from the two imag-ing modalities and ACT, ICT, and VAT.
Results
Dynamics of MR versus CT Perfusion Studies
All ten patients received DSC-MRI and dynamic CT on the same day. There was an excellent correlation between the rCBF AI and rCBV AI values calculated from DSC-MRI and dynamic CT. In all cases, asym-metric perfusion was detected in DSC-MRI as well as in dynamic CT relative to normal white matter (Table 1). Perfusion imaging in one patient with a grade II tumor revealed only mild intratumoral hyperperfusion com-pared to contralateral white matter on DSC-MRI and dynamic CT. Excellent correspondence between DSC-MRI and dynamic CT was obtained from the rCBF maps (MRI: mean AI = 39.5, SD ± 20.4, CT: mean AI 36.0 ± 17.9, Pearson’s correlation r2 = 0.91). rCBV AI
values were: MRI: 44.6 ± 20.9 versus CT: 40.9 ± 16.3, r2 = 0.84. For the MTT AI (MRI: –4.7 ± 11.2 vs. CT: –0.5
± 10.4, r2 = 0.47), there was only a weak intermodality
correlation.
Dynamics of DSA
All ten patients received DSA 1 day after DSC-MRI and dynamic CT. The intratumoral vessels of all patients showed increased tortuosity and increased microvascu-lar density. Patients 4–10, who had grade IV gliomas, showed aberrant and early venous filling during the ar-terial phase of the angiogram. The ACT values did not show any relevant differences between the unaffected hemisphere and the tumor itself (p = not significant). ICT was significantly reduced in the capillary network of the tumor (p < 0.0001), and the extratumoral vessels of the affected hemisphere (p = 0.001). VAT showed an accelerated arteriovenous bolus passage in the affected hemisphere (p = 0.0003) and the tumor (p = 0.002), indi-cating an increased tumor flow rate (Table 2).
Correlations between DSC-MRI, Dynamic CT and DSA
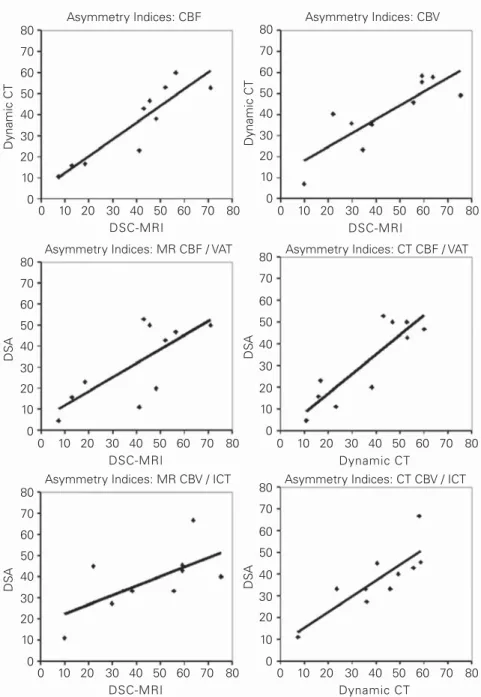
Pearson’s correlation coefficient was calculated for dif-ferences in the relative asymmetry of different perfusion parameters between the tumor region and the contra-lateral, unaffected hemisphere. To compare the values Figures 2a and 2b. The lateral view of the DSA shows the begin of the
parenchymal phase (a, arrows) of the tumor and the early opacifica-tion of the venous drainage (b, arrows), indicating a neovascularized glioblastoma multiforme (patient # 7).
of the parametric DSC-MRI and dynamic CT maps with the temporal dynamics of tumor hypervascularity in DSA, an AI was calculated for ICT and VAT. Best cor-relation was achieved between ICT, an indicator for the vascular volume of the capillary network, and the para-metric rCBV maps: ICT: 38.4 ± 14.7, DSC-MRI: 44.6 ± 20.9, Pearson’s correlation r2 = 0.59, and dynamic CT:
40.9 ± 16.3, Pearson’s correlation r2 = 0.81. The
correla-tion between the duracorrela-tion of the arterial and capillary stain (VAT) and the parametric rCBF maps was: VAT: 31.7 ± 17.6, DSC-MRI: 39.5 ± 20.4, Pearson’s correlation r2 = 0.73, and dynamic CT 36.0 ± 17.9, Pearson’s
correla-tion r2 = 0.87 (Table 3, Figure 3). There was, however,
no correlation between MTT and ICT or VAT: ICT: 38.4 ± 14.7, DSC-MRI: –4.7 ± 11.6,
Pearson’s correlation r2 = 0.12, and
dynamic CT: –0.5 ± 10.4, Pearson’s correlation r2 = 0.07; VAT: 31.7 ±
17.6, DSC-MRI: –4.7 ± 11.6, Pear-son’s correlation r2 = 0.02, and
dy-namic CT –0.5 ± 10.4, Pearson’s correlation r2 = 0.12 (Table 3,
Fig-ure 3).
Discussion
Derangements of the cerebral he-modynamics almost always occur in association with intracranial tu-mors. Such hemodynamic changes can be evaluated either by DSA or by parametric perfusion imaging techniques [24–26]. DSA is not
gen-erally used in the diagnostic work-up of brain tumors, some neurosurgeons, however, prefer to have informa-tion about a tumor’s arterial supply, venous drainage, and compression of adjacent major intracranial ves-sels in high spatial resolution (< 200 µm), which can be achieved by catheter angiography only, to help them in planning an operative or stereotactic procedure. While DSC-MRI techniques have been widely used for clini-cal routine during the last few years, there is still limited use of dynamic CT because of its limitations regarding covered volume, exposition to ionizing radiation, and iodinated contrast agents. Compared to DSC-MRI, however, dynamic CT has shown advantages in the de-tection of tumor angiogenesis, according to the linear Table 2. DSA-related hemodynamic parameters for the unaffected and affected hemisphere versus tumor. ACT: arterial circulation time; ICT:
inter-mediate circulation time; VAT: venous appearance time.
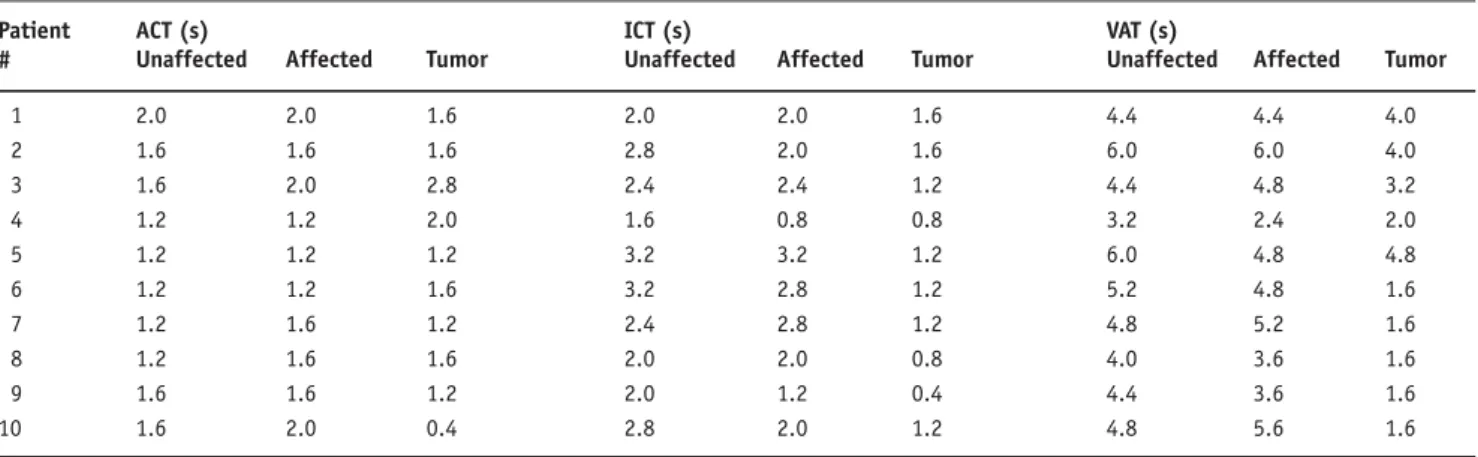
Patient ACT (s) ICT (s) VAT (s)
# Unaffected Affected Tumor Unaffected Affected Tumor Unaffected Affected Tumor
1 2.0 2.0 1.6 2.0 2.0 1.6 4.4 4.4 4.0 2 1.6 1.6 1.6 2.8 2.0 1.6 6.0 6.0 4.0 3 1.6 2.0 2.8 2.4 2.4 1.2 4.4 4.8 3.2 4 1.2 1.2 2.0 1.6 0.8 0.8 3.2 2.4 2.0 5 1.2 1.2 1.2 3.2 3.2 1.2 6.0 4.8 4.8 6 1.2 1.2 1.6 3.2 2.8 1.2 5.2 4.8 1.6 7 1.2 1.6 1.2 2.4 2.8 1.2 4.8 5.2 1.6 8 1.2 1.6 1.6 2.0 2.0 0.8 4.0 3.6 1.6 9 1.6 1.6 1.2 2.0 1.2 0.4 4.4 3.6 1.6 10 1.6 2.0 0.4 2.8 2.0 1.2 4.8 5.6 1.6
ACT: unaffected vs. affected hemisphere p = 0.25; affected vs. tumor p = 0.72; unaffected vs. tumor p = 0.71. ICT: unaffected vs. affected hemisphere p = 0.28; affected vs. tumor p < 0.0001; unaffected vs. tumor p = 0.001. VAT: unaffected vs. affected hemisphere p = 0.65; affected vs. tumor p = 0.0003; unaffected vs. tumor p = 0.002
Table 3. Mean AI ± SD and Pearson’s correlations between DSC-MRI, dynamic CT, DSA ICT and DSA VAT. AI: asymmetry index; CBF: cerebral blood flow; CBV: cerebral blood volume; CT: com-puted tomgraphy; DSA: digital subtraction angiography; DSC: dynamic susceptibility contrast; ICT: intermediate circulation time; MRI: magnetic resonance imaging; MTT: mean transit time; SD: standard deviation; VAT: venous appearance time.
Modality AI Modality AI Pearson’s correlation r2
CBF DSC-MRI 39.5 ± 20.4 CBF dynamic CT 36.0 ± 17.9 0.91 MTT DSC-MRI –4.7 ± 11.2 MTT dynamic CT –0.5 ± 10.4 0.47 CBV DSC-MRI 44.6 ± 20.9 CBV dynamic CT 40.9 ± 16.3 0.84 DSA ICT 38.4 ± 14.7 CBV DSC-MRI 44.6 ± 20.9 0.59 DSA ICT 38.4 ± 14.7 CBV dynamic CT 40.9 ± 16.3 0.81 DSA VAT 31.7 ± 17.6 CBF DSC-MRI 39.5 ± 20.4 0.73 DSA VAT 31.7 ± 17.6 CBF dynamic CT 36.0 ± 17.9 0.87 DSA ICT 38.4 ± 14.7 MTT DSC-MRI –4.7 ± 11.2 0.13 DSA ICT 38.4 ± 14.7 MTT dynamic CT –0.5 ± 10.4 0.07 DSA VAT 31.7 ± 17.6 MTT DSC-MRI –4.7 ± 11.2 0.02 DSA VAT 31.7 ± 17.5 MTT dynamic CT –0.5 ± 10.4 0.12
relationship between contrast agent concentration and the CT attenuation coefficient, as well as to the absence of susceptibility artifacts [25]. Regarding the few studies and case series dealing with dynamic CT in the evalu-ation of brain tumors, the rCBF and rCBV patterns in our series were consistently delineating higher-grade gliomas. Furthermore, the rCBF and rCBV patterns were consistent between DSC-MRI and dynamic CT. In all ten patients, rCBF and rCBV were increased at the
site of the tumor. Although a number of studies have shown increased rCBV values in tumors with increased microvascular density [8, 27–29], no reliable data exist on the reproducibility of repeated rCBV measurements. While most of the studies used manually placed similar rectangular or circular ROIs in the tumor to compare the attenuation values, we have chosen individually ap-plicable polygonal ROIs, fitted to the individual extent of the hyperperfused tumor areas. With this approach, we have excluded necrotic regions and edema neighboring the angio-genetic tumor areas. Furthermore, we were able to apply approximate-ly the same ROIs to the respective slices on dynamic CT and DSC-MRI to enable intermodal comparisons, which revealed strong correlations between both methods.
A comparison between para-metric maps and angiographic find-ings is, by contrast, more difficult to achieve. Given the hypothesis of rCBV being the imaging analog of microvascular density [30], which is used in histopathologic evaluation, changes in the capillary passage time as measured with ICT should either indicate an increased tumor bed (prolonged ICT) or an early wash-out of the capillary stain (shortened ICT) by arteriovenous shunting, indicating tumor dedifferentiation. In our series, we found an acceler-ated ICT in the tumor in all patients. There was a strong correlation be-tween ICT and rCBV in both DSC-MRI and dynamic CT. The cerebral blood flow is more complex to detect on DSA, and different attempts have been made to quantify rCBF with di-rect inspections of serial angiograms and time-density techniques. Some investigators have observed that ar-terial flow correlates well with the perfusion of the cerebral territory fed by that artery [31, 32]. As the an-giographic cerebral circulation time has been shown to correlate with the fast component of CBF in healthy Figure 3. Correlations between DSC-MRI, dynamic CT, VAT and ICT. Best correlation is achieved
for CBF between DSC-MRI and dynamic CT (r2 = 0.91) and between DSA VAT and CBF in
dy-namic CT (r2 = 0.87). Asymmetry Indices: CBF 80 70 60 50 40 30 20 10 0 80 70 60 50 40 30 20 10 0 Asymmetry Indices: CBV Dynamic CT Dynamic CT 0 10 20 30 40 50 60 70 80 DSC-MRI 0 10 20 30 40 50 60 70 80 DSC-MRI 80 70 60 50 40 30 20 10 0 80 70 60 50 40 30 20 10 0 80 70 60 50 40 30 20 10 0 80 70 60 50 40 30 20 10 0 0 10 20 30 40 50 60 70 80 DSC-MRI 0 10 20 30 40 50 60 70 80 Dynamic CT 0 10 20 30 40 50 60 70 80 DSC-MRI 0 10 20 30 40 50 60 70 80 Dynamic CT DS A DS A DS A DS A
Asymmetry Indices: MR CBF / VAT Asymmetry Indices: CT CBF / VAT
Conflict of Interest Statement
We certify that there is no actual or potential conflict of interest in relation to this article.
References
1. Kurki T, Lundbom N, Kalimo H, et al. MR classification of brain gliomas: value of magnetization transfer and conventional imaging. Magn Reson Imaging 1995;13:501–11.
2. Julia-Sape M, Acosta D, Majos C, et al. Comparison between neuroimag-ing classifications and histopathological diagnoses usneuroimag-ing an interna-tional multicenter brain tumor magnetic resonance imaging database. J Neurosurg 2006;105:6–14.
3. Earnest F, Baker HL Jr, Kispert DB, et al. Magnetic resonance imaging vs. computed tomography: advantages and disadvantages. Clin Neuro-surg 1985;32:540–73.
4. Carmody RF, Seeger JF. Intracranial applications of digital subtraction angiography. Crit Rev Diagn Imaging 1984;23:1–40.
5. Choyke PL, Dwyer AJ, Knopp MV. Functional tumor imaging with dy-namic contrast-enhanced magnetic resonance imaging. J Magn Reson Imaging 2003;17:509–20.
6. Wong JC, Provenzale JM, Petrella JR. Perfusion MR imaging of brain neoplasms. AJR Am J Roentgenol 2000;174:1147–57.
7. Law M, Oh S, Johnson G, et al. Perfusion magnetic resonance imaging predicts patient outcome as an adjunct to histopathology: a second reference standard in the surgical and nonsurgical treatment of low-grade gliomas. Neurosurgery 2006;58:1099–107.
8. Mills SJ, Patankar TA, Haroon HA, et al. Do cerebral blood volume and contrast transfer coefficient predict prognosis in human glioma? AJNR Am J Neuroradiol 2006;27:853–8.
9. Brasch RC, Li KC, Husband JE, et al. In vivo monitoring of tumor angio-genesis with MR imaging. Acad Radiol 2000;7:812–23.
10. Leach MO, Brindle KM, Evelhoch JL, et al. The assessment of antiangio-genic and antivascular therapies in early-stage clinical trials using magnetic resonance imaging: issues and recommendations. Br J Cancer 2005;92:1599–610.
11. Cenic A, Nabavi DG, Craen RA, et al. A CT method to measure hemody-namics in brain tumors: validation and application of cerebral blood flow maps. AJNR Am J Neuroradiol 2000;21:462–70.
12. Roberts HC, Roberts TP, Lee TY, et al. Dynamic contrast-enhanced com-puted tomography (CT) for quantitative estimation of microvascular permeability in human brain tumors. Acad Radiol 2002;9:Suppl 2: S364–7.
13. Roberts HC, Roberts TP, Lee TY, et al. Dynamic, contrast-enhanced CT of human brain tumors: quantitative assessment of blood volume, blood flow, and microvascular permeability: report of two cases. AJNR Am J Neuroradiol 2002;23:828–32.
14. Gobbel GT, Cann CE, Fike JR. Measurement of regional cerebral blood flow using ultrafast computed tomography. Theoretical aspects. Stroke 1991;22:768–71.
15. Law M, Young R, Babb J, et al. Comparing perfusion metrics obtained from a single compartment versus pharmacokinetic modeling methods using dynamic susceptibility contrast-enhanced perfusion MR imaging with glioma grade. AJNR Am J Neuroradiol 2006;27:1975–82. 16. Toennis W, Walter W. [Glioblastoma multiforme (report on 2611
cas-es).] Acta Neurochir Suppl (Wien) 1959;6:40–62.
17. Kleihues P, Louis DN, Scheithauer BW, et al. The WHO classification of tumors of the nervous system. J Neuropathol Exp Neurol 2002; 61:215–25.
18. Wiest R, Bredow F von, Schindler K, et al. Detection of regional blood perfusion changes in epileptic seizures with dynamic brain perfusion CT – a pilot study. Epilepsy Res 2006;72:102–10.
19. Meier P, Zierler KL. On the theory of the indicator-dilution method for measurement of blood flow and volume. J Appl Physiol 1954;6:731–44.
volunteers and patients with stroke and subarachnoid hemorrhage [33], we have chosen the relative VAT as a parameter which best matches the filling of the arterial cerebral territory and capillary arteriovenous circula-tion together. In our series, we have found a shortened VAT at the site of the tumor compared to the contralat-eral hemisphere in all ten patients. For both DSA ICT and DSA VAT, the correlation with CT CBV and CT CBF, respectively, proved to be superior to the corre-sponding DSC-MRI values. This is most probably due to the fact that DSA and CT are closely related methods both using X-rays and iodinated contrast agents with linear concentration/contrast relationship.
MTT has been shown to correlate with the resis-tance of the distal vascular territory [34]. In our study, we found only a weak correlation between the paramet-ric MTT maps of DSC-MRI and dynamic CT, and no relevant correlation with the angiographic circulation parameters.
For the MTT we observed AIs that are varying around zero from dynamic CT as well as from DSC-MRI measurements (Table 3). This means that the MTTs of the tumors examined in this study do, on average, not differ from healthy tissue. Since we examined only the nonnecrotic vital tumor parts, we must conclude that for this tissue type, the CBV as well as the CBF are in-creased in glioma while keeping their quotient, which is the MTT, approximately constant. We have found no relevant correlation between the parametric MTT maps of DSC-MRI and dynamic CT with ICT and VAT. Be-yond the statistical drawback of a larger error in the com-puted estimation of the MTT AI, when grouped around zero, one has further to consider the large variance in the angiographic transition time, according to arterio-venous shunting [35] in high-grade gliomas. Therefore, MTT maps may provide equivocal results and are of little value in estimating the tumor grade [36].
Conclusion
This study compares DSC-MRI and dynamic CT per-fusion parameters with angiographic findings in cere-bral gliomas. Compared with digital angiography as a gold standard for the assessment of hemodynamics, the study shows that (1) the less invasive CT and MRI methods provide robust results while avoiding the drawbacks of angiography, and (2) perfusion CT, be-ing cost effective and widely available, represents an attractive alternative to DSC-MRI for hemodynamic imaging of gliomas.
20. Ostergaard L, Sorensen AG, Kwong KK, et al. High resolution measure-ment of cerebral blood flow using intravascular tracer bolus passages. Part II: Experimental comparison and preliminary results. Magn Reson Med 1996;36:726–36.
21. Bozzao A, Fasoli F, Finocchi V, et al. Long term evaluation of brain perfusion with magnetic resonance in high flow extracranial-intracra-nial saphenous graft bypass. Eur Radiol 2007;17:33–8.
22. Caramia F, Santoro A, Pantano P, et al. Cerebral hemodynamics on MR perfusion images before and after bypass surgery in patients with gi-ant intracranial aneurysms. AJNR Am J Neuroradiol 2001;22:1704–10. 23. Greitz T, Cronqvist S. Angiographic evaluation of cerebral circulation
time and regional cerebral blood flow. A comparative study. Scand J Clin Lab Invest Suppl 1968;102:XI.
24. Calli C, Kitis O, Yunten N, et al. Perfusion and diffusion MR imaging in enhancing malignant cerebral tumors. Eur J Radiol 2006;58:394–403. 25. Eastwood JD, Provenzale JM. Cerebral blood flow, blood volume, and
vascular permeability of cerebral glioma assessed with dynamic CT per-fusion imaging. Neuroradiology 2003;45:373–6.
26. Lee SJ, Kim JH, Kim YM, et al. Perfusion MR imaging in gliomas: com-parison with histologic tumor grade. Korean J Radiol 2001;2:1–7. 27. Aronen HJ, Glass J, Pardo FS, et al. Echo-planar MR cerebral blood
vol-ume mapping of gliomas. Clinical utility. Acta Radiol 1995;36:520–8. 28. Aronen HJ, Pardo FS, Kennedy DN, et al. High microvascular blood
volume is associated with high glucose uptake and tumor angiogenesis in human gliomas. Clin Cancer Res 2000;6:2189–200.
29. Knopp EA, Cha S, Johnson G, et al. Glial neoplasms: dynamic contrast-enhanced T2*-weighted MR imaging. Radiology 1999;211:791–8. 30. Lin TN, Sun SW, Cheung WM, et al. Dynamic changes in cerebral blood
flow and angiogenesis after transient focal cerebral ischemia in rats. Evaluation with serial magnetic resonance imaging. Stroke 2002; 33:2985–91.
31. Cronqvist S, Greitz T. Cerebral circulation time and cerebral blood flow. Acta Radiol Diagn 1969;8:296–304.
32. Kiselev VG. On the theoretical basis of perfusion measurements by dy-namic susceptibility contrast MRI. Magn Reson Med 2001;46:1113–22. 33. Greitz T. Normal cerebral circulation time as determined by carotid
angiography with sodium and methylglucamine diatrizoate (Urogra-fin). Acta Radiol Diagn 1968;7:331–6.
34. Mihara F. Reliability of mean transit time obtained using perfusion-weighted MR imaging; comparison with positron emission tomogra-phy. Magn Reson Imaging 2003;21:33–9.
35. Mariani L, Schroth G, Wielepp JP, et al. Intratumoral arteriovenous shunting in malignant gliomas. Neurosurgery 2001;48:353–7. 36. Ellika SK, Jain R, Patel SC, et al. Role of perfusion CT in glioma grading
and comparison with conventional MR imaging features. AJNR Am J Neuroradiol 2007;28:1981–7.
Address for Correspondence PD Dr. Christoph Ozdoba
Institute of Diagnostic and Interventional Neuroradiology Inselspital University of Bern 3010 Bern Switzerland Phone (+41/31) 632-2655, Fax -4872 e-mail: [email protected]