Total arterial compliance estimated by a novel method
and all-cause mortality in the elderly: the PROTEGER study
Theodore G. Papaioannou&Athanase D. Protogerou&Nikolaos Stergiopulos&Orestis Vardoulis&Christodoulos Stefanadis&Michel Safar&Jacques Blacher
Received: 1 September 2013 / Accepted: 22 April 2014 / Published online: 7 May 2014 # American Aging Association 2014
Abstract Aortic stiffness, assessed by carotid-to-femoral pulse wave velocity (PWV), often fails to pre-dict cardiovascular (CV) risk and mortality in the very elderly. This may be due to the non-linear association between PWV and compliance or to blood pressure decrease in the frailest subjects. Total arterial compli-ance (CT) is the most relevant arterial property regarding CV function, compared to local or regional arterial stiffness. A new method for CTestimation, based on PWV, was recently proposed. We aimed to investigate the value of CT to predict all-cause mortality at the elderly. PWV was estimated in 279 elderly subjects
(85.5±7.0 years) who were followed up for a mean period of 12.8±6.3 months. CTwas estimated by the formula CT=k×PWV−2; coefficientk is body-size de-pendent based on previous in silico simulations. Herein, k was adjusted for body mass index (BMI) with a 10 % change in BMI corresponding to almost 11 % change in k. For a reference BMI=26.2 kg/m2
,k=37. Survivors (n=185) and non-survivors (n=94) had similar PWV (14.2±3.6 versus 14.9±3.8 m/s, respectively;p=0.139). In contrast, non-survivors had significantly lower CT than survivors (0.198 ±0.128 versus 0.221±0.1 mL/ mmHg; p=0.018). CTwas a significant predictor of mortality (p=0.022, odds ratio=0.326), while PWV was not (p=0.202), even after adjustment for gender, mean pressure and heart rate. Age was an independent determinant of CT (p=0.016), but not of PWV. CT, estimated by a novel method, can predict all-cause mor-tality in the elderly. CTmay be more sensitive arterial biomarker than PWV regarding CV risk assessment.
Keywords Arterial stiffness . Pulse wave velocity . Distensibility . Elasticity . Aorta . Cardiovascular risk
Introduction
In our days, population ageing is an unprecedented phenomenon. In almost every country, especially the industrialized ones, the proportion of people over 60 years is growing faster than any other age group, as a result of both longer life expectancy and declining birth rates. Several parameters have been identified as
DOI 10.1007/s11357-014-9661-0
T. G. Papaioannou (*)
:
C. StefanadisBiomedical Engineering Unit, First Department of
Cardiology, Hippokration Hospital, Medical School, National and Kapodistrian University of Athens,
114 Vas Sophias ave., Athens 115 28, Greece e-mail: [email protected]
T. G. Papaioannou
:
N. Stergiopulos:
O. Vardoulis Laboratory of Hemodynamics and Cardiovascular Technology, Ecole Polytechnique Fédérale de Lausanne, Lausanne, SwitzerlandA. D. Protogerou
Hypertension Center and Cardiovascular Research Laboratory, First Department of Propaedeutic and Internal Medicine, Laikon Hospital, Medical School, National and Kapodistrian University of Athens,
Athens, Greece M. Safar
:
J. BlacherAP-HP, Diagnosis and Therapeutic Center, Hôtel-Dieu, Paris Descartes University,
risk factors for mortality in frail elderly populations. Many great discoveries regarding arterial macro- and microcirculation from the antiquity (Karamanou and Androutsos 2010; Androutsos et al.2012) as well as recent knowledge gained from prospective clinical stud-ies have led to the appreciation that arterial ageing and impairment of physiological mechanical properties of arterial walls (i.e. stiffening) are indisputably predispos-ing factors for increased cardiovascular (CV) risk and mortality rates. However, in elderly and other popula-tions, there is a controversy regarding the prognostic value of arterial stiffness as assessed by existing meth-odologies (Megnien et al.1998; Meaume et al.2001; Protogerou et al.2007; Verwoert et al.2012).
Compliance is a main biomechanical property of the arterial walls with established hemodynamic and path-ophysiological relevance. Arterial compliance is the ability of the arterial wall to distend and increase volume with increasing transmural pressure. Arterial compli-ance as a property is the inverse of arterial stiffness. The classic definition of arterial compliance (C) is the change in arterial blood volume (ΔV) due to a given change in arterial blood pressure (ΔP); thus, C=ΔV/ ΔP (Spencer and Dennison1963). When the left ven-tricle (LV) ejects into a compliant system, a slower rise in systolic pressure for a given stroke volume causes a lower wall stress and a lower oxygen consumption (McVeigh et al. 2007); namely, LV performance is maintained at lower energetic cost (Kolh et al. 2000). Furthermore, the stored blood volume during cardiac systole, by the distensible arterial walls, contributes to the maintenance of blood flow during cardiac diastole. On the other hand, a decrease in total arterial compliance (CT) can cause an enhancement in pressure and flow wave amplitude and increase LV load (Kelly et al.1992; Papaioannou et al.2003; Mottram et al.2005). Coronary perfusion may be also affected due the decline in dia-stolic pressure. In parallel, CTreduction results to an increase in pressure wave speed, and consequently, the return of reflected waves at central aorta occurs during early systole, leading to an augmentation of peak sys-tolic pressure and pulse pressure.
Several methods and techniques have been proposed for the non-invasive estimation of compliance of (1) a specific arterial location which is mainly assessed by ultrasound-based techniques (Stefanadis et al.1990; Li and Khir2011), (2) a whole arterial segment or region which is most commonly assessed by carotid-to-femoral pulse wave velocity (Van Bortel et al.2012) and (3) the
entire arterial tree (Stergiopulos et al.1995). In a theoret-ical and physiologtheoret-ical basis, the most relevant arterial property, in respect to cardiac function and ventriculo-arterial coupling, isCTrather than the stiffness of a single arterial location or segment, sinceCTis a main parameter that influences aortic input impedance (Westerhof et al.
2010). Most methods ofCTestimation require both
pres-sure and flow wave recording at the aorta (Stergiopulos et al.1995,1999; Segers et al.1999). Consequently, these techniques are complex in their use with limited applica-bility in clinical research.
Thus, up to now, measurement of carotid-to-femoral pulse wave velocity (PWV) has prevailed in clinical prac-tice as the most broadly applied method for the assessment of arterial stiffness. A great body of evidence and data indicates that aortic stiffness is an independent predictor of CV risk and mortality in several populations (Laurent et al.
2001; Blacher et al. 2002; Mattace-Raso et al. 2006;
Mitchell et al.2010). Nevertheless, other studies failed to prove the prognostic value of PWV in elderly populations or subjects with increased arterial stiffness (Megnien et al.
1998; Protogerou et al.2007; Verwoert et al.2012). The
rationale behind the limited prognostic value of PWV in the aforementioned studies may be due to (1) the non-linear association between PWV and compliance as previ-ously suggested (Vardoulis et al.2012), (2) the non-linear association between PWV and age (Taviani et al.2011) or (3) decrease of blood pressure (BP) in the frailest subjects and BP dependence of PWV.
Recently, a new method for CTassessment was de-scribed (Vardoulis et al.2012), based on the Bramwell-Hill theory (Bramwell and Bramwell-Hill 1922). This method allows the estimation ofCTonly from aortic PWV with a correction based primarily on body size. The aim of the present study was to investigate the ability of CT (estimated by this new method) to predict all-cause mortality in elderly people. Our hypothesis was that although, as previously published (Protogerou et al. 2007), aortic PWV fails to predict mortality in the elderly,CTmay have a predictive ability to detect indi-viduals at increased risk.
Methods
Study cohort
A total of 331 consecutive patients examined at the geriatric departments of Charles Foix and Emile Roux
Hospitals, Ile de France from May 2000 to November 2001 were initially enrolled in the “PRonostic cardiovasculaire Optimisation Therapeutique En GERiatric Study” (PROTEGER study) (Protogerou et al.2007; Zhang et al.2010a,b). The inclusion criteria were as follows: age above 70 years old; history of CV disease including coronary heart disease, hypertension, cerebrovascular disease or any other CV events of the upper or lower limbs, abdominal or thoracic aorta or renal arteries; Mini Mental Status Examination greater than 15 of 30; absence of fatal disease with life expec-tancy up to 1 month; and willingness to give a written informed consent to participate in this study. Patients with cachexia (body mass index <17 kg/m2) and/or evolutive cancer and/or advanced renal failure (plasma creatinine >250μmol/L) were excluded from the study. The study protocol was approved by the Committee for the Protection of Human Subjects in Biomedical Research of Saint Germain Hospital (Ile de France). Written informed consent was obtained from all partic-ipants. Further details regarding the study population and protocol have been described previously (Protogerou et al.2007; Zhang et al.2010a,b,2012), and only parameters relevant to the present analysis are presented here.
Assessment of aortic stiffness and wave reflections
All measurements were performed in the morning with each subject being at the supine position after 15 min of rest. Brachial BP was measured by the semi-automatic oscillometric device Dynamap (Kontron). Aortic hemo-dynamics was also estimated by the use of generalized transfer function and applanation tonometry of the radial artery (SphygmoCor, AtCor, Sydney, Australia). Wave reflections were assessed by using augmentation index (AIx) which was calculated by pulse wave analysis as previously described (Vlachopoulos and O'Rourke 2000).
Aortic PWV was estimated using the Complior ap-paratus (Alam Medical, Paris, France). The distance covered by the pulse wave was measured directly from the carotid to the femoral artery, and the transit time was estimated by a previously described foot-to-foot method (Asmar et al.1995). The superficial distance covered by the pulse wave was measured directly from the carotid to the femoral artery. It should be note that this method for distance assessment may overestimate PWV by ap-proximately 2 m/s (Van Bortel2006).
Estimation of total arterial compliance
The following mathematical equation relatingCTwith aortic PWV was recently proposed, by using a theoret-ical approach based on the Bramwell-Hill theory (Bramwell and Hill1922):
CT¼ k⋅ 1 PWV2
wherek is a coefficient that accounts for the contribution of local geometry and wave speed of each arterial seg-ment and it was determined in silico (k=36.7 with 95 % confidence interval 36.2–37.2) (Vardoulis et al. 2012). Coefficient k was found to be primarily body-size-dependent. A good agreement regarding the proportion-ality ofk values to the volume of the arterial tree was reported (Vardoulis et al.2012); namely, an increase of arterial volume by 10 % (from a reference value of arterial volume) resulted in an 11.8 % increase in k value, while a 10 % volume reduction resulted in a 10.8 % decrease ofk. Specifically, k values were 32.8, 36.9 and 41.2 for 10 % decrease, baseline and +10 % increase in arterial volume, respectively. For a reference arterial model that has been previously validated against human data (Reymond et al.2009,2011), baseline body mass index (BMI) was 26.23 kg/m2. For each subject, an individualizedk value was calculated based on the above-mentioned correspondence between percent changes in size andk coefficient.
Coefficient k is principally dependent on geometry and, specifically, on the weighted sum of all arterial segment volumes (Vardoulis et al. 2012). We have shown in silico that there is a good agreement regarding the proportionality of thek values to the volume of the arterial tree (Vardoulis et al. 2012). Hence, we can assume that coefficientk is principally dependent upon body size as estimated by BMI, but of course, this needs to be verified by further studies either in silico or with in vivo measurements.
Statistics
Distribution of continuous variables was assessed for normality by using the Kolmogorov-Smirnov test. Variables that were not normally distributed were trans-formed when needed (i.e. logarithmic transformation). The bivariate association between continuous variables was examined by the Pearson correlation coefficient. Multiple stepwise regression analysis was performed
to assess the independent determinants of AIx, PWVand CT. Differences in arterial biomarkers between survivors and non-survivors were evaluated by Student’s t test for independent samples. Cox regression analysis was per-formed to examine whether AIx, PWV andCTpredict all-cause mortality. Stepwise models were also con-structed to assess confounding effects of other parame-ters. Receiver-operator (ROC) curves analysis was used to determine the predictive value of AIx, PWV andCT. Paired comparisons of the areas under the ROC curves were also performed to examine whetherCTis superior than PWV and AIx in mortality prediction. Statistical significance was accepted forp values lower than 0.05. All comparison tests were two-sided. Statistical analysis was performed by SPSS (SPSS Inc., IL, USA) and Stata (StataCorp LP, TX, USA).
Results
Data from a total of 279 elderly subjects were finally analyzed (subjects with missing data of either PWV, BMI or mortality were excluded). All subjects were followed up for an average period of 12.8±6.3 months. A 33.7 % all-cause mortality was observed (94 subjects died during the 28 months of follow-up). Descriptive and hemodynamic characteristics of the study popula-tion are reported in Table1.
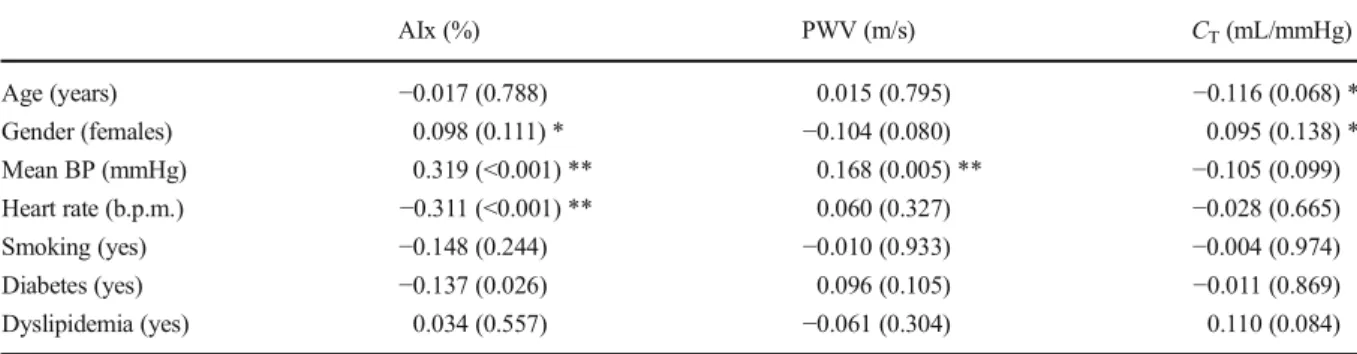
Three widely used surrogates of arterial biomechan-ical properties were assessed: wave reflections (AIx), aortic stiffness (carotid-to-femoral PWV) and the newly proposed index of total arterial compliance (CT). Parameters which are typically associated with the aforementioned biomarkers—such as age, gender, mean BP, heart rate and CV risk factors—were analyzed by linear regression analysis. AIx was significantly related to mean BP and heart rate, but not with age; PWV was correlated with mean BP and not with age; and finally, CTwas significantly related to age and gender but not with mean BP (Table2).
In multivariate regression analysis, AIx was indepen-dently related to gender (AIx was higher in females than in males,p=0.002), mean BP (p<0.001) and heart rate (p<0.001). The stronger independent determinant of PWV was mean BP (p=0.007). Finally, CTwas inde-pendently related to age (p=0.016) and gender (females had higher total arterial compliance than males, p= 0.034).
AIx and PWV did not differ significantly between survivors and non-survivors (Table3). On the contrary, non-survivors had significantly lower values ofCT com-pared to survivors (p=0.018, Table3). BMI of survivors and non-survivors was 24.2±5.0 versus 23.3±4.7 kg/ m2, respectively (p=0.167).
The ability of AIx, PWV andCTto predict all-cause mortality was first assessed by univariate Cox regres-sion analysis. Among these three parameters, only CT had a significant predictive value (odds ratio 0.326,p= 0.022; Table4).
Total arterial compliance predicted significantly all-cause mortality, in this elderly population, even after adjustment for the effect of gender, mean BP and heart rate (Table5). The statistical significance was margin-ally lost (p=0.078) after adjustment for age. When all confounders (gender, mean BP, heart rate and age) were included in a single multivariate Cox regression model, the independent predictive value ofCTwas observed at a significance level 0.097 (Table5).
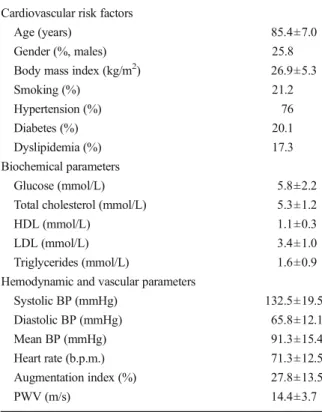
Table 1 Descriptive characteristics of the examined elderly population
Cardiovascular risk factors
Age (years) 85.4±7.0 Gender (%, males) 25.8 Body mass index (kg/m2) 26.9±5.3
Smoking (%) 21.2 Hypertension (%) 76 Diabetes (%) 20.1 Dyslipidemia (%) 17.3 Biochemical parameters Glucose (mmol/L) 5.8±2.2 Total cholesterol (mmol/L) 5.3±1.2 HDL (mmol/L) 1.1±0.3 LDL (mmol/L) 3.4±1.0 Triglycerides (mmol/L) 1.6±0.9 Hemodynamic and vascular parameters
Systolic BP (mmHg) 132.5±19.5 Diastolic BP (mmHg) 65.8±12.1 Mean BP (mmHg) 91.3±15.4 Heart rate (b.p.m.) 71.3±12.5 Augmentation index (%) 27.8±13.5 PWV (m/s) 14.4±3.7
Data are mean ± standard deviation or percentages
BP blood pressure, HDL high-density lipoprotein, LDL low-den-sity lipoprotein,PWV carotid-to-femoral pulse wave velocity
Receiver operator curve analysis (Fig.1) showed that the area under the curve forCTwas 0.61, for PWV 0.569 and for AIx 0.483. The area under the curve ofCTwas significantly higher than both PWV and AIx areas (p= 0.011 andp=0.032, respectively).
Discussion
This is the first study demonstrating the significant value of total arterial compliance to predict all-cause mortality in an elderly population, when at the same time the typical measurement of carotid-to-femoral PWV and pressure wave reflections did not. A recently proposed method ofCTestimation (Vardoulis et al.2012), using a modified approach of Bramwell-Hill theory, was ap-plied on a previously investigated cohort of elderly people (Protogerou et al.2007; Zhang et al.2010a,b). It was revealed thatCT, assessed by this technique, is a significant predictor of all-cause mortality, independent-ly from gender, mean blood pressure and heart rate.
Currently, the“gold standard” method for the assess-ment of arterial stiffness is measureassess-ment of the trans-mission velocity of a pressure wave between two arterial sites which is performed non-invasively, easily and re-producibly by the existing technologies. In contrast, traditional methods forCTestimation are too complex since they require both blood pressure and velocity/flow recordings at the aorta. Most commonly, PWV is mea-sured between carotid and femoral artery, providing a surrogate of aortic stiffness. Emerging evidence exists supporting that aortic PWV is an independent predictor of CV risk and mortality (Laurent et al.2001; Blacher et al.2002; Cruickshank et al.2002). The inclusion of PWV in clinical practice, though, is still a conflicting issue. PWV measurement is proposed by the guidelines for the management of arterial hypertension of the European Society of Hypertension/European Society of Cardiology as a tool for assessment of subclinical target organ damage (Mancia et al.2007). On the con-trary, the guidelines for assessment of CV in asymptom-atic adults, which were published in 2010 by the American College of Cardiology Foundation and the American Heart Association, raised several concerns
Table 2 Linear regression analysis: dependent variables were aortic pulse wave velocity (PWV), aortic augmentation index (AIx) and total arterial compliance (CT) and independent variables
were demographic and hemodynamic parameters as well as risk factors which are known to affect arterial biomechanical properties
AIx (%) PWV (m/s) CT(mL/mmHg) Age (years) −0.017 (0.788) 0.015 (0.795) −0.116 (0.068) * Gender (females) 0.098 (0.111) * −0.104 (0.080) 0.095 (0.138) * Mean BP (mmHg) 0.319 (<0.001) ** 0.168 (0.005) ** −0.105 (0.099) Heart rate (b.p.m.) −0.311 (<0.001) ** 0.060 (0.327) −0.028 (0.665) Smoking (yes) −0.148 (0.244) −0.010 (0.933) −0.004 (0.974) Diabetes (yes) −0.137 (0.026) 0.096 (0.105) −0.011 (0.869) Dyslipidemia (yes) 0.034 (0.557) −0.061 (0.304) 0.110 (0.084) Values correspond to beta coefficients (p values)
*p<0.05; **p<0.01 (indicate the independent determinants of the dependent variable in a stepwise multiple regression model)
Table 3 Comparison of aortic pulse wave velocity (PWV), aortic augmentation index (AIx) and total arterial compliance (CT)
be-tween survivors and non-survivors
Survivors Non-survivors p value AIx (%) 142.9±24.3 143.2±20.4 0.912 PWV (m/s) 14.2±3.6 14.9±3.8 0.139 CT(mL/mmHg) 0.221±0.1 0.198±0.128 0.018
Values are presented as mean ± standard deviation (number of valid cases)
Table 4 Univariate Cox regression analysis of aortic pulse wave velocity (PWV), aortic augmentation index (AIx) and total arterial compliance (CT), for the prediction of mortality at the elderly
Odds ratio 95 % confidence intervals p value AIx (%) 0.998 0.990–1.007 0.686 PWV (m/s) 3.566 0.506–25.14 0.202 CT(mL/mmHg) 0.326 0.125–0.853 0.022
which restrict, at the moment, the recommendation of arterial stiffness measurement for clinical research (Greenland et al.2010).
Although PWV can predict CV risk and mortality in various populations, it has limited predictive value in situations where arterial stiffness is increased, as previ-ously discussed (Vardoulis et al. 2012). In an analysis which was performed within the framework of the Rotterdam Study, it was investigated whether aortic stiff-ness (assessed by PWV) improves the prediction of cor-onary heart disease; 2,849 elderly subjects with mean age of 71.5 years and mean PWVof 13.3 m/s were examined, and it was shown that there is a low additional value of aortic stiffness in the clinical management of coronary heart disease (Verwoert et al.2012). In another clinical study by Megnien et al. (1998), aortic PWV and
distensibility did not predict coronary and extracoronary atherosclerosis in asymptomatic men at risk for CV dis-ease. In the same direction, Matsusima et al. found that brachial-ankle PWV was not an independent predictor of coronary artery disease severity in a population of 205 patients (mean age 65 years) with increased PWV levels (16.4±3.6 m/s) who underwent coronary angiography (Matsushima et al.2004). Another study on the prediction of mortality by PWV at the elderly showed that aortic PWV was an independent predictor of cardiovascular and not all-cause mortality in a population of 141 patients older than 70 years (Meaume et al.2001). However, only PWV values higher than 17.7 m/s could predict CV mortality in that study (Meaume et al.2001).
The aforementioned studies have revealed a limita-tion of PWV to predict CV risk and mortality in the
Table 5 Multivariate Cox regression analysis of aortic pulse wave velocity (PWV), aortic augmentation index (AIx) and total arterial compliance (CT), for the prediction of mortality at the elderly
Model Covariates Dependent variable
AIx PWV CT
Model-1 Gender 0.99 (p=0.814) 3.25 (p=0.241) 0.33 (p=0.023) Model-2 Mean BP 0.99 (p=0.767) 3.75 (p=0.19) 0.32 (p=0.019) Model-3 Heart rate 0.99 (p=0.736) 3.55 (p=0.212) 0.32 (p=0.022) Model-4 Age 0.99 (p=0.517) 2.86 (p=0.29) 0.41 (p=0.078) Model-5 Gender, mean BP 1.00 (p=0.952) 2.13 (p=0.472) 0.43 (p=0.097)
Heart rate and age Odds ratio (p value)
0.00 0.25 0.50 0.75 1.00 Sensitivity 0.00 0.25 0.50 0.75 1.00 1−Specificity
inv_C ROC area: 0.61 AIx ROC area: 0.48 PWV ROC area: 0.57 Reference
Fig. 1 Receiver-operator-curve analysis of aortic pulse wave velocity (PWV) and total arterial compliance (CT) for the
prediction of all-cause mortality. In order to compare directly the areas under the two curves,CT
was inversed so that high values of 1/CT, AIx and PWV have
predictive value at the same direction
elderly or in subjects with increased arterial stiffness. A possible explanation for this may be due to the non-linear relationship betweenCTand PWV. Another po-tential explanation is the fact that BP is decreased in the frailest subjects while at the same time PWV is BP dependent and thus PWV’s predictive value may be confounded by BP levels.
In this study,CTwas found to predict all-cause mor-tality while PWV did not. The two aforementioned mechanisms can explain this finding. First, our approach forCTestimation takes into consideration the non-linear relationship between compliance and PWV. Thus, small differences in PWV among subjects correspond to great-er diffgreat-erences inCTvalues (Fig.2), rendering the latter parameter a more sensitive index. Secondly, although we verified the BP dependence of PWV in this population too, we also found thatCTwas not related significantly with mean BP. Therefore, mean BP likely confounds the predictive value of PWV, but it does not affect that much the respective predictive value ofCT, in the examined elderly population. The latter finding was further sup-ported by Cox regression analysis with both CTand mean BP as independent covariates in a multivariate model for the prediction of all-cause mortality.
Another observation that might likely explain the superior prognostic value of CTcompared to PWV was that CT better reflects the age-related effects on arterial properties; specifically, it was found thatCTis significantly related to age, while PWV is not.
From a pathophysiological point of view, there is no doubt that CTis more relevant than regional or local arterial compliance (or their surrogate PWV), in terms of modulation of cardiac load, LV function,
arterio-ventricular coupling and CV risk. The previously pro-posed method forCTestimation (Vardoulis et al.2012) can be widely and even retrospectively used, providing a more close approximation of global systemic arterial compliance. Of course, this method has strengths and weaknesses that should be acknowledged. Its advan-tages rely on the use of a broad, easy and simple method that is clinically available for the assessment of aortic stiffness (namely carotid-to-femoral PWV) combined with a simple adjustment for body size (i.e. BMI). The accuracy and precision of this method were found to be quite high in a previous validation study (Vardoulis et al. 2012). The fact that BMI does not always represent the arterial size, which is directly involved in the estimation of k coefficient, is considered as a weakness of this technique. Another limitation of the study is the small sample size which bounded the significance level of the predictive value of CT (p value=0.097) when more covariates were entered in the multiple Cox regression model. It is estimated that a larger population (~350 subjects) would be enough to provide ap value lower than 0.05 for the independent prediction of all-cause mortality byCT.
Finally, it should be mentioned that a previous rele-vant study of elderly women showed that systemic arterial compliance was not a significant predictor of cardiovascular events (Dart et al.2006). The findings of the present study are not in line with those of that study which is mostly a result of major methodological differ-ences between the two cohorts. In the study of Dart et al., only females were examined, while in this study, both genders were included. Furthermore,CTwas esti-mated by a much more complex technique (which was based on both aortic flow and pressure waves recording) than the simple one used in this study. Finally, Dart et al. examined the ability of CT to predict “cardiovascular disease-free survival” and not total mortality per se. Since PWV was not measured in that study (Dart et al. 2006), direct comparison of the results of that cohort with the present one is not possible.
Conclusions
Population ageing challenges health care systems to maximize the effectiveness of diagnostic and prognostic strategies in these subjects, aiming to the better under-standing and management of their risk for CV compli-cations and death. In this direction, a small step towards
Fig. 2 Nonlinear relation between total arterial compliance (CT)
a more accurate and timely assessment of CV risk and prediction of all-cause mortality in elderly populations may be achieved by the evaluation of total arterial compliance. This can be achieved by using a simple and non-invasive technique principally based on PWV and a modified Bramwell-Hill approach. The opinion of Sir William Osler (Canadian Physician, 1849–1919), one of the four founding professors of Johns Hopkins Hospital, best reflects the critical role of arterial proper-ties on longevity: “Longevity is a vascular question, which has been well expressed in the axiom that man is only as old as his arteries”. The age of the arterial tree is definitely reflected by its global compliance which remains a challenging property from methodological and clinical perspective.
References
Androutsos G, Karamanou M, Stefanadis C (2012) William Harvey (1578-1657): discoverer of blood circulation. Hell J Cardiol 53:6–9
Asmar R, Benetos A, Topouchian J et al (1995) Assessment of arterial distensibility by automatic pulse wave velocity mea-surement: validation and clinical application studies. Hypertension 26:485–490
Blacher J, Safar ME, Pannier B et al (2002) Prognostic signifi-cance of arterial stiffness measurements in end-stage renal disease patients. Curr Opin Nephrol Hypertens 11:629–634 Bramwell JC, Hill AV (1922) The velocity of the pulse wave in
man. Proc R Soc Lond B 93:298–306
Cruickshank K, Riste L, Anderson SG et al (2002) Aortic pulse-wave velocity and its relationship to mortality in diabetes and glucose intolerance: an integrated index of vascular function? Circulation 106:2085–2090
Dart AM, Gatzka CD, Kingwell BA et al (2006) Brachial blood pressure but not carotid arterial waveforms predict cardiovas-cular events in elderly female hypertensives. Hypertension 47:785–790
Greenland P, Alpert JS, Beller GA et al (2010) 2010 ACCF/AHA guideline for assessment of cardiovascular risk in asymptom-atic adults: a report of the American College of Cardiology Foundation/American Heart Association Task Force on Practice Guidelines. Circulation 122:e584–e636
Karamanou M, Androutsos G (2010) Completing the puzzle of blood circulation: the discovery of capillaries. Ital J Anat Embryol 115:175–179
Kelly RP, Tunin R, Kass DA (1992) Effect of reduced aortic compliance on cardiac efficiency and contractile function of in situ canine left ventricle. Circ Res 71:490–502
Kolh P, D'Orio V, Lambermont B et al (2000) Increased aortic compliance maintains left ventricular performance at lower energetic cost. Eur J Cardiothorac Surg 17:272–278 Laurent S, Boutouyrie P, Asmar R et al (2001) Aortic stiffness is an
independent predictor of all-cause and cardiovascular mor-tality in hypertensive patients. Hypertension 37:1236–1241
Li Y, Khir AW (2011) Experimental validation of non-invasive and fluid density independent methods for the determination of local wave speed and arrival time of reflected wave. J Biomech 44:1393–1399
Mancia G, De Backer G, Dominiczak A et al (2007) 2007 Guidelines for the management of arterial hypertension: the Task Force for the Management of Arterial Hypertension of the European Society of Hypertension (ESH) and of the European Society of Cardiology (ESC). J Hypertens 25: 1105–1187
Matsushima Y, Kawano H, Koide Y et al (2004) Relationship of carotid intima-media thickness, pulse wave velocity, and ankle brachial index to the severity of coronary artery ath-erosclerosis. Clin Cardiol 27:629–634
Mattace-Raso FU, van der Cammen TJ, Hofman A et al (2006) Arterial stiffness and risk of coronary heart disease and stroke: the Rotterdam Study. Circulation 113:657–663 McVeigh GE, Bank AJ, Cohn JN (2007) Arterial compliance. In:
Willerson JT, Cohn JN, Wellens HJJ, Holmes DR (eds) Cardiovascular medicine. Springer-Verlag, London, pp 1811–1831
Meaume S, Benetos A, Henry OF et al (2001) Aortic pulse wave velocity predicts cardiovascular mortality in subjects >70 years of age. Arterioscler Thromb Vasc Biol 21:2046–2050 Megnien JL, Simon A, Denarie N et al (1998) Aortic stiffening
does not predict coronary and extracoronary atherosclerosis in asymptomatic men at risk for cardiovascular disease. Am J Hypertens 11:293–301
Mitchell GF, Hwang SJ, Vasan RS et al (2010) Arterial stiffness and cardiovascular events: the Framingham Heart Study. Circulation 121:505–511
Mottram PM, Haluska BA, Leano R et al (2005) Relation of arterial stiffness to diastolic dysfunction in hypertensive heart disease. Heart 91:1551–1556
Papaioannou TG, Mathioulakis DS, Tsangaris SG (2003) Simulation of systolic and diastolic left ventricular dysfunc-tion in a mock circuladysfunc-tion: the effect of arterial compliance. J Med Eng Technol 27:85–89
Protogerou AD, Safar ME, Iaria P et al (2007) Diastolic blood pressure and mortality in the elderly with cardiovascular disease. Hypertension 50:172–180
Reymond P, Bohraus Y, Perren F et al (2011) Validation of a patient-specific one-dimensional model of the systemic arte-rial tree. Am J Physiol Heart Circ Physiol 301:H1173–H1182 Reymond P, Merenda F, Perren F et al (2009) Validation of a one-dimensional model of the systemic arterial tree. Am J Physiol Heart Circ Physiol 297:H208–H222
Segers P, Verdonck P, Deryck Y et al (1999) Pulse pressure method and the area method for the estimation of total arterial com-pliance in dogs: sensitivity to wave reflection intensity. Ann Biomed Eng 27:480–485
Spencer MP, Dennison AB (1963) Pulsatile blood flow in the vascular system. In: Hamilton WF (ed) Handbook of physiology, vol 2. American Physiology Society, Washington, DC, p 842 Stefanadis C, Stratos C, Boudoulas H et al (1990) Distensibility of
the ascending aorta: comparison of invasive and non-invasive techniques in healthy men and in men with coronary artery disease. Eur Heart J 11:990–996
Stergiopulos N, Meister JJ, Westerhof N (1995) Evaluation of methods for estimation of total arterial compliance. Am J Physiol 268:H1540–H1548
Stergiopulos N, Segers P, Westerhof N (1999) Use of pulse pres-sure method for estimating total arterial compliance in vivo. Am J Physiol 276:H424–H428
Taviani V, Hickson SS, Hardy CJ et al (2011) Age-related changes of regional pulse wave velocity in the descending aorta using Fourier velocity encoded M-Mode. Magn Reson Med 65: 261–268
Van Bortel LM (2006) Is arterial stiffness ready for daily clinical practice? J Hypertens 24:281–283
Van Bortel LM, Laurent S, Boutouyrie P et al (2012) Expert consensus document on the measurement of aortic stiffness in daily practice using carotid-femoral pulse wave velocity. J Hypertens 30:445–448
Vardoulis O, Papaioannou TG, Stergiopulos N (2012) On the estimation of total arterial compliance from aortic pulse wave velocity. Ann Biomed Eng 40:2619–2626
Verwoert GC, Elias-Smale SE, Rizopoulos D et al (2012) Does aortic stiffness improve the prediction of coronary heart
disease in elderly? The Rotterdam Study. J Hum Hypertens 26:28–34
Vlachopoulos C, O'Rourke M (2000) Genesis of the normal and abnormal arterial pulse. Curr Probl Cardiol 25:303–367 Westerhof N, Stergiopulos N, Noble MIM (2010) Snapshots of
hemodynamics: an aid for clinical research and graduate education. Springer, New York
Zhang Y, Agnoletti D, Iaria P et al (2012) Gender difference in cardiovascular risk factors in the elderly with cardiovascular disease in the last stage of lifespan: the PROTEGER study. Int J Cardiol 155:144–148
Zhang Y, Safar ME, Iaria P et al (2010a) Prevalence and prognosis of left ventricular diastolic dysfunction in the elderly: the PROTEGER Study. Am Heart J 160: 471–478
Zhang Y, Safar ME, Iaria P et al (2010b) Cardiac and arterial calcifications and all-cause mortality in the elderly: the PROTEGER Study. Atherosclerosis 213:622–626