Supplementary Information
HUWE1 E3 ligase promotes PINK1/PARKIN-independent
mitophagy by regulating AMBRA1 activation via IKKα
Di Rita et al.
Supplementary Figure 1
a
COXIV/ACTIN ratio
PcDNA3
Myc-AMBRA1ActA + SiRNA-Ctr
Myc-AMBRA1ActA+ SiRNA-HUWE1
c b
Dapi AMBRA1ActA GFP Merge
GFP-ShCtr + Myc-AMBRA1 ActA GFP-ShHUWE1 + Myc-AMBRA1 ActA GFP-ShCtr +Myc-AMBRA1ActA m ito ag gr es om es -p os iti ve tr an sf ec te d ce lls (% ) * GFP-ShHUWE1 +Myc-AMBRA1ActA d ** * PcDNA3 Myc-AMBRA1 ActA - - + MG132 (10μM, 8h) 18 h post transfection Myc-AMBRA1ActA MFN2 ACTIN Mr (K) 90 130 42 PcDNA3
Myc-AMBRA1WT + SiRNA-Ctr + O/A
Myc-AMBRA1WT+ SiRNA-HUWE1 + O/A
PcDNA3 Myc-AMBRA1ActA
Myc-AMBRA1ActA+ MG132 e
Mt-mKeima
Neutral Mt-mKeimaAcidic Mt-mKeimaMerge
GFP 4XMagnification AMBRA1 ActA AMBRA1 ActA GFP- ShHUWE1 + PcDNA3 GFP-ShCtr +PcDNA3 GFP-ShCtr +AMBRA1ActA GFP-ShHUWE1+AMBRA1ActA GFP-ShCtr + GFP-ShCtr + **** **** C OXIV /A C TI N ra tio 0 1 2 3 4 5 Ac id ic /n eu tra l m t-m Ke im a si gn al in te ns ity ra tio 0 50 100 0.0 0.5 1.0 M FN 2/ AC TI N ra tio 0.0 0.5 1.0 1.5 * 0.0 0.5 1.0 1.5 *
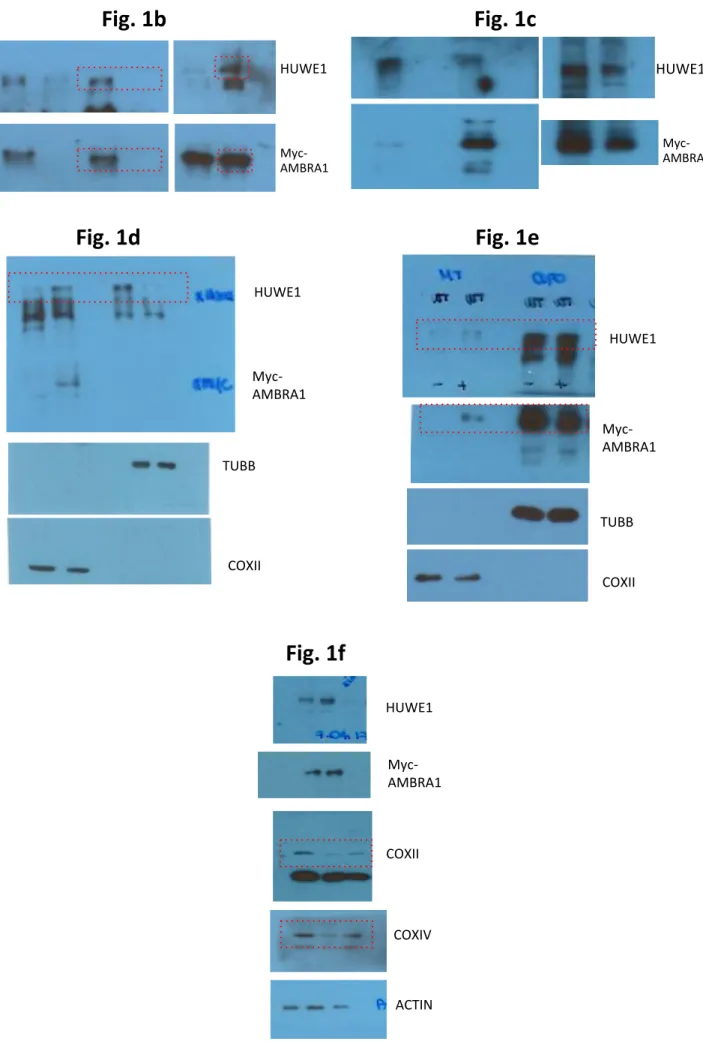
Supplementary Figure 1: The inhibition of HUWE1 E3 ligase impairs AMBRA1-mediated mitophagy
a. The graph shows the COXIV/ACTIN ratio in AMBRA1ActA-transfected
cells, depleted of HUWE1 (SiRNA-HUWE1). n = 3. b. HeLa cells co-transfected with vectors encoding for Myc-AMBRA1ActA+GFP-ShCtr or Myc-AMBRA1ActA+GFP-ShHUWE1 were immunostained for Myc (red) and GFP (green) antibodies by confocal microscopy. n = 3. SiRNA-Ctr = 9 individual fields; SiRNA-HUWE1 = 9 individual fields. Scale bar 10 µm. c. mt-mKeima PINK1-KO cells were transfected with the empty vector PcDNA3 or a vector coding Myc-AMBRA1ActA in combination with
GFP-ShCtr or GFP-ShHUWE1. Live cells were then analysed using time-lapse imaging. The GFP was pseudo-coloured in cyan in order to detect the acidic-mt-mKeima (as red signal) and neutral-mt-mKeima (as green signal). The graph shows the acidic/neutral mt-mkeima signal intensity evaluated in GFP-ShCtr+PcDNA3 (white spheres), or GFP-ShCtr+Myc-AMBRA1ActA (cyan spheres), or GFP-ShHUWE1+Myc-AMBRA1ActA (green
squares). Each point represents the mean of GFP-positive cells mt-mKeima signal in a single field. n = 3. Scale bar 10 µm. d. The graph shows the COXIV/ACTIN ratio in AMBRA1WT-transfected cells, expressing a SiRNA-HUWE1. n = 3. e. HeLa cells transfected with Myc-AMBRA1ActA in combination or not with HUWE1 vector (18 hrs) and
treated with MG132 (10 µM, 8 hrs) were subjected to western blot analysis, looking to MFN2 levels. n = 3. The quantification results as the mean of experimental triplicate (± S.D). *P<0.05; **P<0.01; ****P<0.0001. Statistical analysis was performed using One-Way ANOVA (a, c, d, e) or Student’s t-test (b). Mr(K) = relative molecular mass expressed in Kilo
Supplementary Figure 2 a b PcDNA3 Myc-AMBRA1 ActA COXII COXIV ACTIN - - + NH4Cl 130 55 Mr (K) 42 Myc-AMBRA1 ActA PcDNA3 Myc-AMBRA1ActA HSP60 ACTIN Myc-AMBRA1ActA 130 25 Mr (K) 42 17 c COXII ACTIN 25 Mr (K) 42 - + O/A
Supplementary Figure 2: AMBRA1 induces mitophagy in Penta-KO cells
a. Penta-KO cells were treated with O/A (10 μM/4 μM, supplemented with
20 μM QVD). b. Penta-KO cells were transfected with Myc-AMBRA1ActA for 24 hrs. Protein levels of the matrix mitochondrial factor HSP60 were analy-sed by western blot. n = 2. c. Myc-AMBRA1ActA Penta-KO transfected cells were treated or not with NH4Cl after six hours of transfection. COXII and COXIV protein levels were analysed by western blot. n = 1. Mr(K) = relative
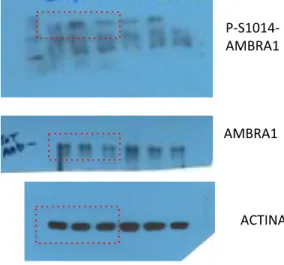
Supplementary Figure 3 b c - + - + O/A (2.5μM/0.8μM, 1hr) P-S1014-AMBRA1 AMBRA1 ACTIN Myc-AMBRA1 WT Myc-AMBRA1 S1014A Myc-AMBRA1 S1014D - + - + - + O/A (2.5μM/0.8μM, 1hr) P-S1014-AMBRA1 Myc-AMBRA1 ACTIN 130 130 Mr (K) 42 130 130 Mr (K) 42 SiRNA-Ctr SiRNA-AMBRA1 a Mt-mKeima
Neutral Mt-mKeimaAcidic Mt-mKeimaMerge
GFP AMBRA1 WT + O/A AMBRA1 S1014A + O/A AMBRA1 S1014D + O/A GFP + GFP + GFP + Magnification 4X PcDNA3 + O/A GFP + 0 2 4 6 8 Ac id ic /n eu tra l m t-m Ke im a si gn al in te ns ity ra tio **** **** ******** GFP+PcDNA3+OA GFP-Myc-AMBRA1WT+OA
GFP-Myc-AMBRA1S1014A+OA
Supplementary Figure 3: The AMBRA1 phosphorylation at S1014 during mitophagy
a. mt-mKeima HeLa cells were transfected with a vector coding for GFP
in combination with PcDNA3, or Myc-AMBRA1WT, or Myc-AMBRA1S1014A, or Myc-AMBRA1S1014D. Following O/A treatment, live cells were then analysed using time-lapse imaging. The GFP was pseudo-coloured in cyan in order to detect the acidic-mt-mkeima (as red signal) and neutral-mkeima (as green signal). The graph shows the acidic/neutral mt-mkeima signal intensity evaluated in GFP+PcDNA3 (white spheres), or GFP+Myc-AMBRA1WT (cyan spheres), or GFP+Myc-AMBRA1S1014A (green squares), or GFP+Myc-AMBRA1S1014D (red squares). Each point represents the mean of GFP-positive cells mt-mkeima signal in a single field. n = 3. Scale bar 10 µm. The quantification results as the mean of experimental triplicate (± S.D). ****P<0.0001. Statistical analysis was performed using One-Way ANOVA. b. HeLa cells were transfected with SiRNA-Ctr or SiRNA-AMBRA1. After 24 hrs, cells were treated with FCCP (10 µM, 1 hr). By western blot analysis, we tested AMBRA1 phosphorylation in these samples. n = 1. c. HeLa cells were transfected with vectors encoding for Myc-AMBRA1WT, Myc-AMBRA1S1014A or
Myc-AMBRA1S1014D. After 24 h, cells were treated with FCCP (10 µM, 1 hr)
and we analysed AMBRA1 phosphorylation on S1014 by western blotting. n = 1. Mr(K) = relative molecular mass expressed in Kilo Dalton.
Supplementary Figure 4
b
a c
d e
Supplementary Figure 4: AMBRA1-S1014 phosphorylation enhances the AMBRA1-mATG8s binding
a. ITC titrations of non-modified AMBRA1-LIR peptide (P0) into LC3- and
GABARAP-subfamily proteins (top and bottom panels). b. ITC titrations of S1014-phosphorylated AMBRA1-LIR peptide (P1) into LC3- and GABARAP-subfamily proteins (top and bottom panels). c. Interaction of LC3B and GABARAP (upper and lower plots) proteins with P0 and with S1014D AMBRA1-LIR (PM) peptides. All measurements were performed at 25°C. The top diagrams display the raw measurements and the bottom diagrams show the integrated heat per titration step. Best fit is shown as a solid line and the KD values are indicated. d. Representative sections of
HSQC spectra for 15N-labeled GABARAP upon titration with P0 and P1 AMBRA-LIR peptides. Both plots show fingerprint regions of the GABARAP spectra (around HN resonance of GABARAP K48-K51 in LC3B; neighbouring GABARAP residue Y49 is shown in a box). Molar ratios of protein:peptide are rainbow colour coded (1:0, 1:0.125, 1:0.25, 1:0.5, 1:1, 1:2 and 1:4; from red to magenta) for each titration step. CSP for K51 and V58 HN backbone resonances are stressed with the arrows.
e. KD values calculated for the GABARAP residue I32 upon titration with
P0 and P1 (left and right plots) AMBRA-LIR peptides. Original CSP values are shown as black squares, resulting fit is given as a red line in each plot. The original HSQC areas around I32 HN resonance are shown as a box under fitted curves. f. CSP values (Δδ) at the last titration stages for GABARAP protein with P0 peptide are plotted against residues numbers. The orange dashed lines indicate the standard deviations (σ) over all residues within each dataset, the red dashed lines indicate double
σ values, and grey bars represent residues with non-assigned HN
resonances. The CSP values mapped on the GABARAP protein structure (ribbon diagrams, PDB ID 1GNU) are shown in the upper right corner.
Residues with small (Δδ<σ), intermediate (σ<Δδ<2σ) or strong (2σ<Δδ) CSPs were marked in grey, yellow and red, respectively. g., h. Mapping of Δδ values for LC3B (g) and GABARAP (h) titrations with P1 AMBRA1-LIR on protein sequences and structures.
Supplementary Figure 5
PcDNA3
Myc-AMBRA1ActA + Vehicle
Myc-AMBRA1ActA+ BAY-117082
b c
PcDNA3
Myc-AMBRA1ActA + PcDNA3
Myc-AMBRA1ActA+ HA-IKKαK44M
d PcDNA3
Myc-AMBRA1WT + O/A + PcDNA3
+ HA-IKKαK44M Myc-AMBRA1WT +O/A e f Nucleus Cytosol O/ATNF-α O/A TNF-α p65-NFkB LAMIN A/C TUBB PcDNA3 Flag-IKK αWT Myc-TBK1 P-S1014-AMBRA1 AMBRA1 Flag Myc ACTIN a 130 100 Mr (K) 130 100 42 55 55 Mr (K) 70 0 1 2 C O XI V/ AC TI N ra tio * 0.0 0.5 1.0 1.5 C O XI V/ AC TI N ra tio * 0.0 0.4 0.8 C O XII /A C TI N ra tio * n.s. PcDNA3
Myc-AMBRA1ActA + Vehicle
Myc-AMBRA1ActA+ BAY-117082
Myc-AMBRA1ActA + Vehicle + O/A
Myc-AMBRA1ActA+ BAY-117082 + O/A
0.0 0.5 1.0 1.5 C O XI V/ AC TI N ra tio *
Supplementary Figure 5: IKKα role in AMBRA1-mediated mitophagy a. HeLa cells transfected with vectors encoding for Flag-IKKα or
Myc-TBK1 were treated with O/A for 1 hr and blotted for the indicated antibodies. n = 1. b., c., d., e. n = 3. f. Nuclear-Cytosol translocation of p65 in O/A or TNF-α-treated cells, analysed by western blot. n = 2. f. All graphs represent the mean of three independent experiments (± S.D.). *P<0.05. Statistical analysis was performed using One-Way ANOVA (b, c,
d, e). Mr(K) = relative molecular mass expressed in Kilo Dalton.
Fig. 1b
HUWE1 Myc- AMBRA1Fig. 1c
HUWE1 Myc-AMBRA1Fig. 1e
HUWE1 Myc- AMBRA1 TUBB COXIIFig. 1f
HUWE1 Myc- AMBRA1 COXII COXIV ACTINFig. 1d
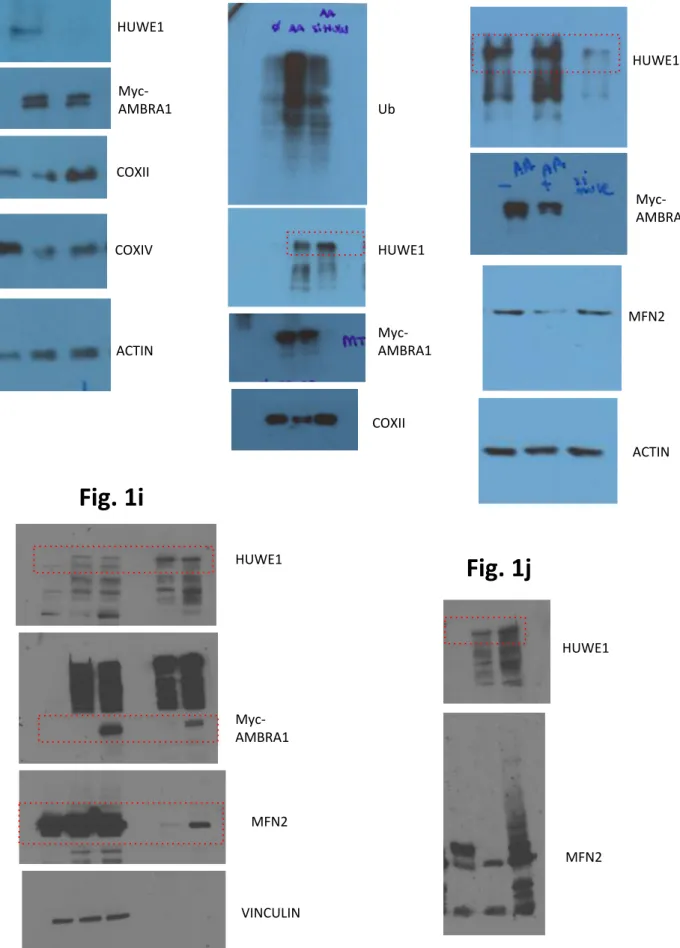
HUWE1 Myc- AMBRA1 TUBB COXIIFig. 1g
HUWE1 Myc- AMBRA1 COXII COXIV ACTINFig. 1h
Fig. 1i
Fig. 1j
Fig. 1k
HUWE1 Myc- AMBRA1 MFN2 ACTIN HUWE1 HUWE1 Myc- AMBRA1 MFN2 VINCULIN COXII HUWE1 Myc- AMBRA1 Ub MFN2Fig. 2a
Myc- AMBRA1 COXII COXIV ACTINFig. 2c
Myc- AMBRA1 COXII COXIV ACTINFig. 3c
COXII COXIV ACTIN Myc-AMBRA1Fig. 3b
Myc-AMBRA1 LC3Fig. 3e
Fig. 5b
HA AMBRA1Fig. 5c
P-S1014-AMBRA1 AMBRA1 ACTINAFig. 5e
Flag AMBRA1 P-S1014-AMBRA1 HAFig. 5f
Fig. 5d
P-S1014-AMBRA1 AMBRA1 Flag HA P-S1014-AMBRA1 AMBRA1 Flag HA ACTINFig.5g
COXII COXIV ACTIN Myc-AMBRA1Fig.5h
COXII COXIV Myc-AMBRA1 ACTINFig.5j
Fig.5i
COXII COXIV ACTIN Myc-AMBRA1 HA Myc-AMBRA1 HA COXII COXIV ACTINFig.6a
HUWE1 P-S1014-AMBRA1 AMBRA1 HSP90Fig.6b
AMBRA1 LC3B HUWE1 AMBRA1 LC3BFig.7c
Fig.7d
Myc- AMBRA1 COXII ACTINFig.7a
Fig.7b
Myc- AMBRA1 COXII ACTIN AMBRA1 HSP90 P-S1014 AMBRA1 COXII AMBRA1 ACTIN HUWE1 HASupplementary
Fig.1e
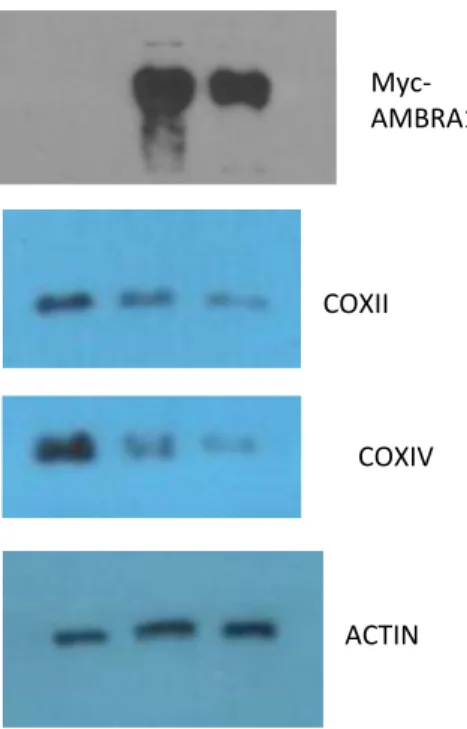
Myc- AMBRA1 ACTIN MFN2Supplementary
Fig.2a
Supplementary
Fig.2b
COXII ACTIN Myc- AMBRA1 HSP60 ACTINSupplementary
Fig.2c
Myc- AMBRA1 COXIV COXII ACTINSupplementary
Fig.3c
P-S1014- AMBRA1 Myc- AMBRA1 ACTINSupplementary
Fig.3b
P-S1014-AMBRA1 AMBRA1 ACTINSupplementary
Fig.5a
Supplementary
Fig.5f
P-S1014-AMBRA1 Flag Myc AMBRA1 ACTIN p65-NFkB LAMIN A/C TUBB
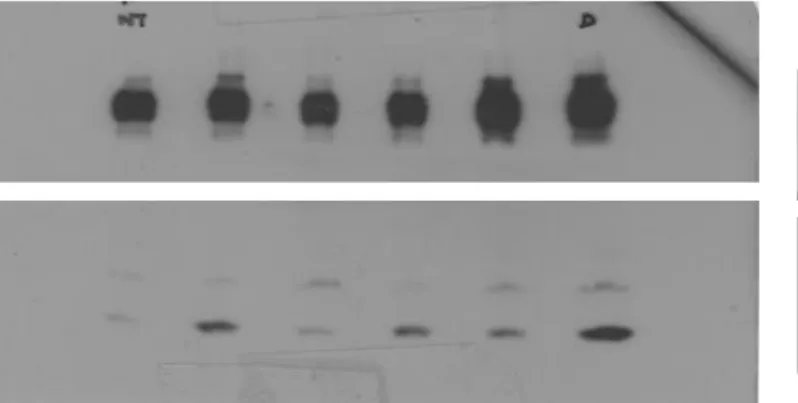
Supplementary Figure 6. Uncropped scans of the Western blots shown in
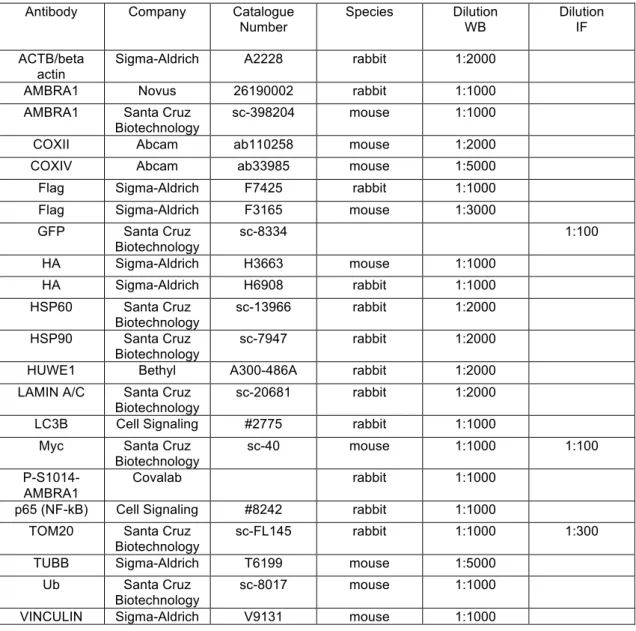
Table 1. List of antibodies used for western blot (WB) and immunofluorescence (IF) analysis
Antibody Company Catalogue
Number Species Dilution WB Dilution IF ACTB/beta
actin Sigma-Aldrich A2228 rabbit 1:2000 AMBRA1 Novus 26190002 rabbit 1:1000 AMBRA1 Santa Cruz
Biotechnology sc-398204 mouse 1:1000 COXII Abcam ab110258 mouse 1:2000 COXIV Abcam ab33985 mouse 1:5000 Flag Sigma-Aldrich F7425 rabbit 1:1000 Flag Sigma-Aldrich F3165 mouse 1:3000 GFP Santa Cruz Biotechnology sc-8334 1:100 HA Sigma-Aldrich H3663 mouse 1:1000 HA Sigma-Aldrich H6908 rabbit 1:1000 HSP60 Santa Cruz Biotechnology sc-13966 rabbit 1:2000 HSP90 Santa Cruz Biotechnology sc-7947 rabbit 1:2000 HUWE1 Bethyl A300-486A rabbit 1:2000 LAMIN A/C Santa Cruz
Biotechnology sc-20681 rabbit 1:2000 LC3B Cell Signaling #2775 rabbit 1:1000
Myc Santa Cruz Biotechnology
sc-40 mouse 1:1000 1:100
P-S1014-AMBRA1
Covalab rabbit 1:1000
p65 (NF-kB) Cell Signaling #8242 rabbit 1:1000 TOM20 Santa Cruz
Biotechnology sc-FL145 rabbit 1:1000 1:300 TUBB Sigma-Aldrich T6199 mouse 1:5000
Ub Santa Cruz Biotechnology
sc-8017 mouse 1:1000 VINCULIN Sigma-Aldrich V9131 mouse 1:1000
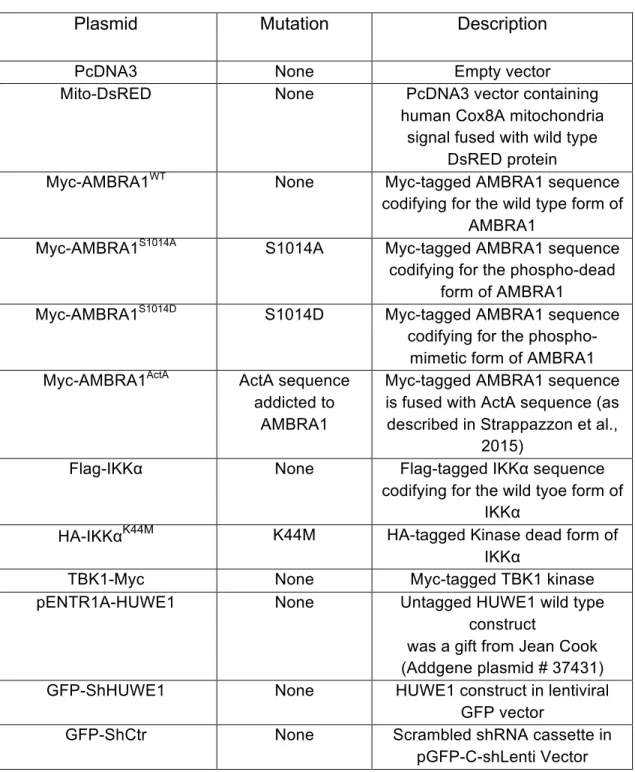
Table 2. List of plasmids and mutagenesis products
Plasmid Mutation Description
PcDNA3 None Empty vector
Mito-DsRED None PcDNA3 vector containing
human Cox8A mitochondria signal fused with wild type
DsRED protein
Myc-AMBRA1WT None Myc-tagged AMBRA1 sequence
codifying for the wild type form of AMBRA1
Myc-AMBRA1S1014A S1014A Myc-tagged AMBRA1 sequence codifying for the phospho-dead
form of AMBRA1
Myc-AMBRA1S1014D S1014D Myc-tagged AMBRA1 sequence codifying for the
phospho-mimetic form of AMBRA1 Myc-AMBRA1ActA ActA sequence
addicted to AMBRA1
Myc-tagged AMBRA1 sequence is fused with ActA sequence (as described in Strappazzon et al.,
2015)
Flag-IKKα None Flag-tagged IKKα sequence
codifying for the wild tyoe form of IKKα
HA-IKKαK44M K44M HA-tagged Kinase dead form of
IKKα
TBK1-Myc None Myc-tagged TBK1 kinase
pENTR1A-HUWE1 None Untagged HUWE1 wild type
construct
was a gift from Jean Cook (Addgene plasmid # 37431)
GFP-ShHUWE1 None HUWE1 construct in lentiviral
GFP vector
GFP-ShCtr None Scrambled shRNA cassette in
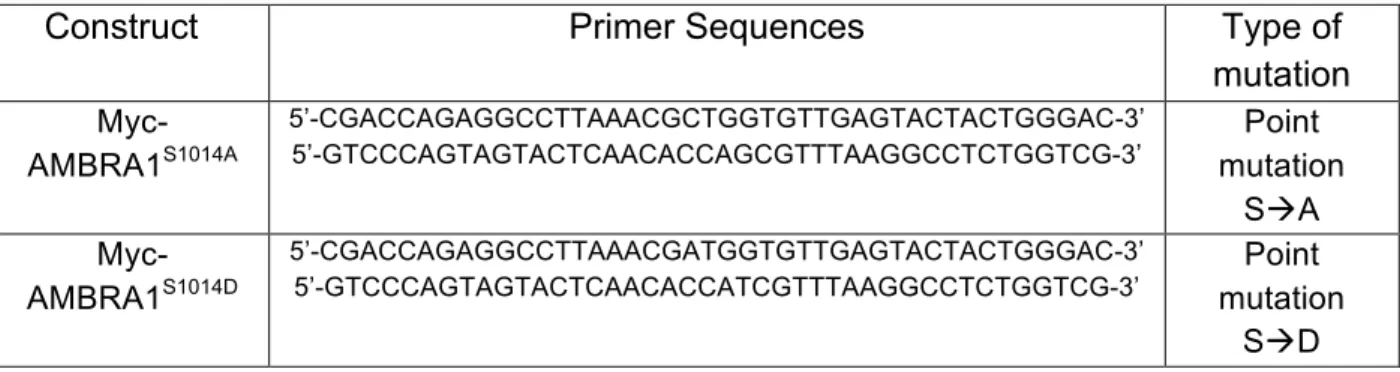
Table 3. List of primers sequences for point mutations
Construct Primer Sequences Type of
mutation
Myc-AMBRA1S1014A
5’-CGACCAGAGGCCTTAAACGCTGGTGTTGAGTACTACTGGGAC-3’
5’-GTCCCAGTAGTACTCAACACCAGCGTTTAAGGCCTCTGGTCG-3’ mutation Point
SàA
Myc-AMBRA1S1014D
5’-CGACCAGAGGCCTTAAACGATGGTGTTGAGTACTACTGGGAC-3’
5’-GTCCCAGTAGTACTCAACACCATCGTTTAAGGCCTCTGGTCG-3’ mutation Point
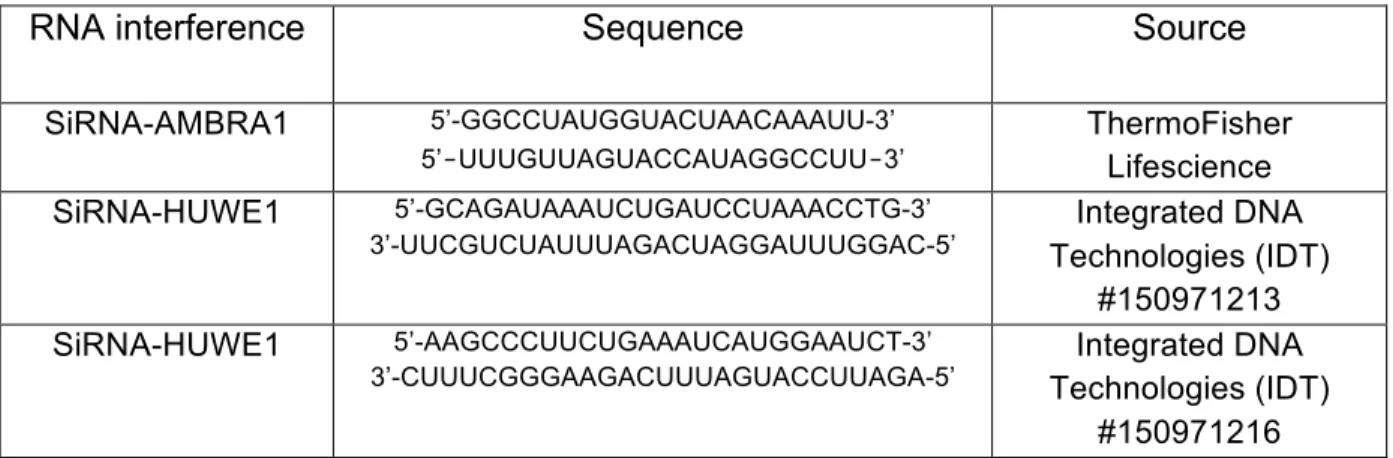
Table 4. List of oligos RNA interference
RNA interference Sequence Source
SiRNA-AMBRA1 5’-GGCCUAUGGUACUAACAAAUU-3’
5’‑UUUGUUAGUACCAUAGGCCUU‑3’ ThermoFisher Lifescience
SiRNA-HUWE1 5’-GCAGAUAAAUCUGAUCCUAAACCTG-3’ 3’-UUCGUCUAUUUAGACUAGGAUUUGGAC-5’ Integrated DNA Technologies (IDT) #150971213 SiRNA-HUWE1 5’-AAGCCCUUCUGAAAUCAUGGAAUCT-3’
3’-CUUUCGGGAAGACUUUAGUACCUUAGA-5’ Technologies (IDT) Integrated DNA
Supplementary Note 1
ITC experiments show that the non-modified AMBRA1-LIR (P0) binds to all 6 mATG8 proteins with low affinity (Supplementary Fig, 4a, upper plots), exhibiting some preference to GABARAP-subfamily proteins. Strongest interaction appears to the GABARAP protein, with KD of ~40
mM, while for the LC3- proteins and for GABARAPL2 KD values can be only estimated. The binding enthalpy for all mATG8 proteins is small, defining the entropy as a main driving force of the interactions. However, both phosphorylation of S1014 (P1, Supplementary Fig. 4b) either introduction of phospho-mimicking aspartate to this position (PM, Supplementary Fig. 4c) increase affinity of AMBRA1-LIR interaction with mATG8 analogues (KD values decreases ~2-5 times). For the GABARAP
protein KD shifts down to 21 mM as determined by ITC. Also ITC titration
of P1 AMBRA1-LIR peptide to LC3B, which is characterized by very low enthalpy and is almost invisible at 25°C (Supplementary Fig. 4a and 4b, LC3B plots), shows unambiguously increase of LC3B affinity to AMBRA1-LIR upon S1014 phosphorylation when performed at 35° (Fig. 4a, KD
decrease from >100 to 53 mM).
In order to characterize the AMBRA1-LIR interaction with LC3- and GABARAP-family proteins in more details, we performed NMR titration experiments, in which the AMBRA1-LIR peptides of different phosphorylation states (P0 and P1) were stepwise added to 15N-labelled LC3B and GABARAP proteins (Fig. 4b-4d and Supplementary Fig. 4d-h).
We observed fast exchange behaviour of backbone HN resonances for almost all residues in LC3B and GABARAP proteins upon titrations (in agreement with the high entropy contribution from our ITC data); however, the P1 induces perturbations of the key LC3B/GABARAP resonances with fast-to-intermediate exchange regime in contrast to P0
(fast exchange regime, Fig. 4b-4c and Supplementary Fig. 4d-4e). KD
values, calculated from chemical shift perturbations (CSP), for LC3B and GABARAP interactions with P0 and P1 peptides, mirror that from ITC experiments (providing more trustable KD of ~150 mM for LC3B:P0
interaction). We also mapped the CSP observed upon P0 and P1 titrations on the sequence and structure of the LC3B and GABARAP proteins (Fig. 4d and Supplementary Fig. 4f-4h). Comparison of the CSP induced by P0 and P1 titrations (for both LC3B and GABARAP proteins) indicates no significant differences in residues affected or directions of perturbations. It means that the increased affinity of AMBRA1-LIR peptide to the mATG8 proteins upon phosphorylation of S1014 residue is mediated not by specific conformational changes of mATG8 proteins backbone, rather by electrostatic interactions and salt bridges between phosphoryl group and side-chains of corresponding proteins (similar to OPTN-LIR phosphorylation,23). This conclusion is further supported in our MD simulation experiments (Fig. 4f).