Supplementary information
Antimicrobial Proteins in Human Milk Cells
Alecia-Jane Twigger1†*, Gwendoline K. Küffer2†, Donna T. Geddes3, Luis Filgueria2Figure S1: Gating around single cells using forward scatter area (FSC-A) and forward scatter height (FSC-H). Population 1 (P1), population 2 (P2) and population 3 (P3) were then gated using only single cells.
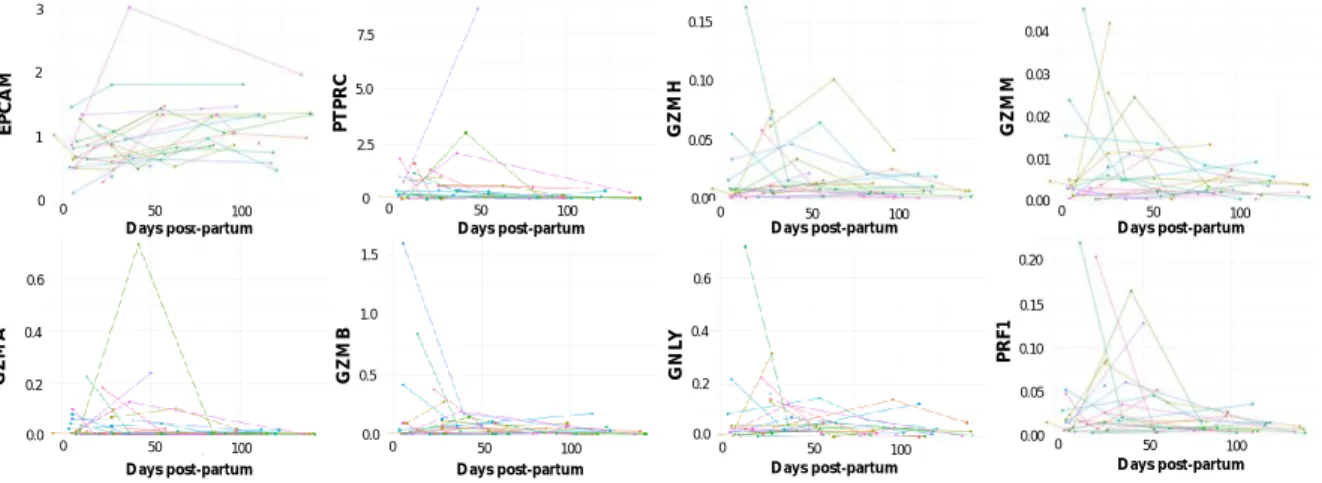
Figure S2:Relative quantitation (RQ) of the expression of the epithelial marker EPCAM, the immune cell marker
PTPRC and the genes coding for granzyme A (GZMA), granzyme B (GZMB), granzyme H (GZMH), granzyme M (GZMM), granulysin (GNLY) and perforin (PRF1) distributed according to the time period post-partum. Individual participants are represented with different coloured line plots
FSC-A S S C -A FSC-A FS C -H P1 P2 P3 Single cells 0 50 100 Days post-partum 0 50 100 Days post-partum 0 50 100 Days post-partum 0 50 100 Days post-partum P T P R C E P C A M G Z M A 0 2.5 5.0 7.5 0.0 0.5 1.0 1.5 G Z M B 0 50 100 Days post-partum 0 50 100 0 50 100 Days post-partum G Z M H G Z M M 0.00 0.01 0.04 0.02 0.03 0.00 0.05 0.10 0.20 0.15 0 1 2 3 0.0 0.2 0.6 0.4 G N LY 0.0 0.2 0.6 0.00 0.05 0.10 0.15 0.4 0 50 100 Days post-partum P R F1 Days post-partum
Table S1: Taqman probes from Life Technologies
Gene Catalogue number
HuGAPDH HS03929097_g1 PRF1 Hs00169473_m1 PTPRC Hs04189704_m1 GZMA Hs00989184_m1 GZMB Hs00188051_m1 GZMH Hs00277212_m1 GZMM Hs00193417_m1 GNLY Hs00246266_m1 EPCAM Hs00158980_m1
Table S2: Antibodies used for FACS analysis
Antibody Dilution Marker style Company Catalogue number
CD45 – PE-Cy5 1:50 Surface marker BD Biosciences
CD45 – FITC 1:5 Surface marker BD Biosciences 555482
EPCAM - FITC 1:10 Surface marker MACS Miltenyi Biotec 347197
Prf1 – AF647 1:50 Intracellular marker BD Biosciences 563576
GzmA - PE 1:50 Intracellular marker MACS Miltenyi Biotec 130-099-296
GzmB – PE 1:10 Intracellular marker BD Biosciences 561142
GNLY – PE 1:20 Intracellular marker BioLegend 348004
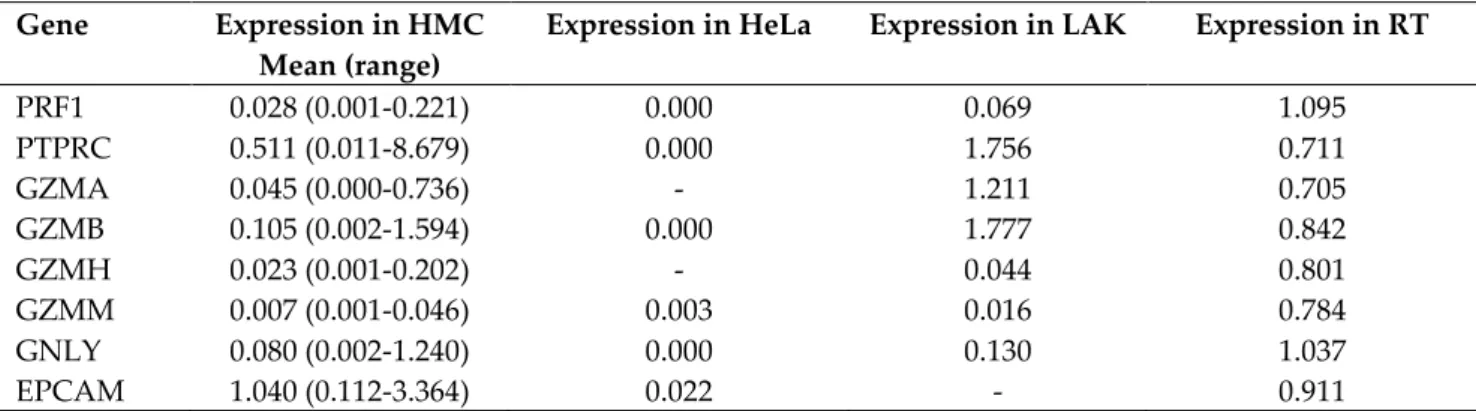
Table S3: Expression of selected genes in human milk cells (HMC) measured via RT-PCR, normalised to either lymphokine activated killer cells (LAK) or resting tissue (RT). Values within this table represent a relative quantitation (RQ) compared to these reference samples indicating the fold difference in the expression between the sample and the positive control. If the gene expression of the HMC is the same as that of the control, the expression will be equal to 1. Values have been rounded to 3 decimal places and where no expression was found, this is indicated by ‘-‘.
Gene Expression in HMC
Mean (range)
Expression in HeLa Expression in LAK Expression in RT
PRF1 0.028 (0.001-0.221) 0.000 0.069 1.095 PTPRC 0.511 (0.011-8.679) 0.000 1.756 0.711 GZMA 0.045 (0.000-0.736) - 1.211 0.705 GZMB 0.105 (0.002-1.594) 0.000 1.777 0.842 GZMH 0.023 (0.001-0.202) - 0.044 0.801 GZMM 0.007 (0.001-0.046) 0.003 0.016 0.784 GNLY 0.080 (0.002-1.240) 0.000 0.130 1.037 EPCAM 1.040 (0.112-3.364) 0.022 - 0.911
Table S4: Univariate linear mixed modelling of days post-partum and antimicrobial peptide genes, with participant as an influencing factor on gene expression
Response Variable Intercept Slope (days post-partum) SE (slope) P-value (slope)
GZMA 0.0611 -0.000376 0.000296 0.212 GZMB 0.169 -0.00132 0.000643 0.047 GZMH 0.0249 -0.00012 0.0000763 0.122 GZMM 0.00813 -0.0000383 0.0000261 0.150 GNLY 0.0857 -0.000496 0.000297 0.102 PRF1 0.0408 -0.000241 0.000129 0.068 PTPRC 0.739 -0.00398 0.00335 0.242
Table S5: Flow cytometric analysis of immune and epithelial cell proteins in HM cells (%) taken from healthy, mastitis and non-related surgical patient participants. Double stainings between perforin and other immune proteins.
Healthy (n=12) Mastitis sample (n=1) Post surgery sample
Median (Range) Mastitis breast Adjacent breast (n=1)
Granzyme A – Perforin All single cells
Population 1 Population 2 Population 3 0.0 (0.0 – 0.7) 0.1 (0.0 – 25.5) 0.0 (0.0 – 1.1) 0.1 (0.0 – 0.2) 0.1 3.6 1.8 0.0 0.0 1.6 0.1 0.0 Granzyme B – Perforin
All single cells Population 1 Population 2 Population 3 0.4 (0.0 – 2.8) 5.7 (3.4 – 23.0) 0.8 (0.4 – 10.6) 0.3 (0.2 – 0.4) 0.2 34.4 2.8 0.1 0.1 8.6 1.5 0.1 2.5 26.7 13.3 0.8 Granulysin – Perforin
All single cells Population 1 Population 2 Population 3 0.8 (0.0 – 1.5) 4.6 (1.7 – 17.6) 1.6 (0.2 – 2.1) 0.5 (0.4 – 0.6) 0.3 3.2 4.8 0.1 2.6 15.5 19.7 0.9