HAL Id: hal-03065736
https://hal.archives-ouvertes.fr/hal-03065736
Submitted on 17 Dec 2020
HAL is a multi-disciplinary open access
archive for the deposit and dissemination of
sci-entific research documents, whether they are
pub-lished or not. The documents may come from
teaching and research institutions in France or
abroad, or from public or private research centers.
L’archive ouverte pluridisciplinaire HAL, est
destinée au dépôt et à la diffusion de documents
scientifiques de niveau recherche, publiés ou non,
émanant des établissements d’enseignement et de
recherche français ou étrangers, des laboratoires
publics ou privés.
of an Extreme Katabatic Flow in Antarctica
Étienne Vignon, Ghislain Picard, Claudio Durán-Alarcón, Simon Alexander,
Hubert Gallée, Alexis Berne
To cite this version:
Étienne Vignon, Ghislain Picard, Claudio Durán-Alarcón, Simon Alexander, Hubert Gallée, et al..
Gravity Wave Excitation during the Coastal Transition of an Extreme Katabatic Flow in Antarctica.
Journal of the Atmospheric Sciences, American Meteorological Society, 2020, 77 (4), pp.1295-1312.
�10.1175/JAS-D-19-0264.1�. �hal-03065736�
Gravity Wave Excitation during the Coastal Transition of an Extreme Katabatic Flow
in Antarctica
ÉTIENNEVIGNON
Environmental Remote Sensing Laboratory (LTE),École Polytechnique Fédérale de Lausanne, Lausanne, Switzerland
GHISLAINPICARD ANDCLAUDIODURÁN-ALARCÓN
UGA, CNRS, Institut des Géosciences de l’Environnement, UMR 5001, Grenoble, France
SIMONP. ALEXANDER
Australian Antarctic Division, Hobart, Tasmania, Australia
HUBERTGALLÉE
UGA, CNRS, Institut des Géosciences de l’Environnement, UMR 5001, Grenoble, France
ALEXISBERNE
Environmental Remote Sensing Laboratory (LTE),École Polytechnique Fédérale de Lausanne, Lausanne, Switzerland (Manuscript received 25 September 2019, in final form 3 December 2019)
ABSTRACT
The offshore extent of Antarctic katabatic winds exerts a strong control on the production of sea ice and the formation of polynyas. In this study, we make use of a combination of ground-based remotely sensed and meteorological measurements at Dumont d’Urville (DDU) station, satellite images, and simulations with the Weather Research and Forecasting Model to analyze a major katabatic wind event in Adélie Land. Once well developed over the slope of the ice sheet, the katabatic flow experiences an abrupt transition near the coastal edge consisting of a sharp increase in the boundary layer depth, a sudden decrease in wind speed, and a decrease in Froude number from 3.5 to 0.3. This so-called katabatic jump manifests as a turbulent ‘‘wall’’ of blowing snow in which updrafts exceed 5 m s21. The wall reaches heights of 1000 m and its horizontal extent along the coast is more than 400 km. By destabilizing the boundary layer downstream, the jump favors the trapping of a gravity wave train—with a horizontal wavelength of 10.5 km—that develops in a few hours. The trapped gravity waves exert a drag that considerably slows down the low-level outflow. Moreover, atmo-spheric rotors form below the first wave crests. The wind speed record measured at DDU in 2017 (58.5 m s21) is due to the vertical advection of momentum by a rotor. A statistical analysis of observations at DDU reveals that katabatic jumps and low-level trapped gravity waves occur frequently over coastal Adélie Land. It emphasizes the important role of such phenomena in the coastal Antarctic dynamics.
1. Introduction
Coastal Adélie Land, East Antarctica, lies to the west of an intense climatological katabatic jet that is centered near Cape Denison in Commonwealth Bay (Parish and Wendler 1991) and immortalized in Douglas Mawson’s 1915 book The Home of the Blizzard. The topographic channeling of the gravity-driven near-surface flow gives
this region the most intense sustained surface winds on Earth (Wendler et al. 1993;Parish and Walker 2006).
Katabatic winds can become particularly extreme when the synoptic conditions favor a plateau-to-ocean pressure gradient force (e.g., Parish and Bromwich 1998). Such strong katabatic wind events are of partic-ular importance for the Antarctic meteorology (Turner et al. 2009) since they play a major role in the general circulation at high southern latitudes and since their offshore extent strongly influence the sea ice production
Corresponding author:Étienne Vignon, etienne.vignon@epfl.ch DOI: 10.1175/JAS-D-19-0264.1
Ó 2020 American Meteorological Society. For information regarding reuse of this content and general copyright information, consult theAMS Copyright Policy(www.ametsoc.org/PUBSReuseLicenses).
as well as the creation and resilience of polynyas (e.g.,
Adolphs and Wendler 1995).
When reaching the abrupt topographic gradients at the ice sheet edge, the katabatic layer in Adélie Land can experience an abrupt deepening and a sharp speed reduction limiting the offshore extent of strong near-surface flow (Ball 1957;Pettré and André 1991;Gallée et al. 1996;Gallée and Pettré 1998;Vignon et al. 2019b). This process was interpreted similarly to hydraulic jumps observed in channels, with a transition from a supercritical—high Froude number—to a subcritical—low Froude number—flow (Ball 1956). Hence, such phe-nomenon is referred to as a ‘‘katabatic jump’’ or Loewe’s phenomenon. Yu and Cai (2006) further underline that only an elaborated hydraulic jump model including mixing processes at the top of the katabatic layer can satisfactorily represent the physics of the katabatic flow jumps. Besides Adélie Land, such katabatic jumps were shown to occur in other Antarctic sectors such as in Coats Land (Yu et al. 2005,2007;Renfrew and Anderson 2006) and along Mawson coast (Orr et al. 2014). Tomikawa et al. (2015) also revealed that katabatic jumps are the cause of strong vertical wind disturbances observed with a weather radar near Syowa station in Dronning Maud Land. The authors also suggested that oro-graphic gravity waves might explain other high vertical velocity events in this region. Internal gravity waves are naturally generated in katabatic flows (McNider 1982;
Chemel et al. 2009) and high-resolution nonhydrostatic model simulations further suggested that a gravity wave with a horizontal wavelength on the order of a few kilometers can be excited downstream of a jump (Yu and Cai 2006;Orr et al. 2014). However, no ob-servational evidences have supported this numerical result hitherto.
From a climate perspective, gravity waves are an im-portant component of the Antarctic atmospheric circu-lation (Moffat-Griffin 2019). When propagating upward toward the stratosphere, gravity waves affect the for-mation of cirrus clouds (Alexander et al. 2017), polar stratospheric clouds (Carslaw et al. 1998) and they are paramount to explain the stratospheric and mesospheric thermal structure (e.g.,Ren et al. 2011) and circulation (Andrews et al. 1987). Missing gravity wave drag at high southern latitudes has been pointed out to explain the so-called cold-pole bias and a delay in the stratospheric polar vortex breakup (Garcia et al. 2017) in the simu-lation of the Antarctic middle atmosphere by climate models. Along the coast of East Antarctica, low-level gravity waves were also shown to impact tropospheric cloud formation (Alexander et al. 2017). Although the main region known for orographic gravity wave
generation in Antarctica is the peninsula (Hertzog et al. 2008;Plougonven et al. 2013;Alexander et al. 2016;Holt et al. 2017), the winds blowing down on the East Antarctic ice sheet are known to generate gravity waves when interacting with the relief such as over an ice ridgeline northeast of the Vestfold hills near Davis station (Alexander and Murphy 2015; Alexander et al. 2017), over the trans-Antarctic mountains (Baumgaertner and McDonald 2007;Zhao et al. 2017) or over nunataks in Dronning Maud Land (Valkonen et al. 2010). Using global climate simulations, Watanabe et al. (2006) show that fierce katabatic winds are also responsible for the excitation of large scale—with horizontal wavelengths of several hundred kilometers—orographic gravity waves when they reach the abrupt coastal slopes of the ice sheet. Inspecting the vertical structure of the ver-tical wind velocity in regional climate simulations,
Bromwich et al. (2011)also reveal a stationary oro-graphic wavelike structure over coastal Adélie Land, but the authors did not give a physical explanation for the generation of such a wave.
In some specific meteorological conditions (Lott 2016;
Hills et al. 2016), orographic gravity waves can remain partly or totally trapped close to the surface. These so-called trapped lee waves are often observed downstream of mountain ranges along with the presence of lenticular clouds that form at wave crests or turbulent rotors that can develop below the crests (Doyle and Durran 2002;
Jiang et al. 2007;Strauss et al. 2015;Vosper et al. 2018). From Douglas Mawson’s stories,Ball (1957)expect ro-tor waves to occur in Adélie Land in conjunction with strong katabatic jumps. Trapped gravity waves are also known to exert a drag on the low-level flow downstream of a relief (Lott 1998;Teixeira 2014). Therefore, trapped gravity waves that may be generated by katabatic flows at the foot of ice sheet slopes could potentially be an important process to explain their coastal transition. Investigating the source and the propagation of gravity waves is thus vital to better understand both the stratospheric and the low-level circulation in the Antarctic and account for sea ice distribution.
The present study makes use of a combination of in situ and remotely sensed measurements, satellite images, and high-resolution numerical simulations to evidence and decipher the generation of gravity waves that is associated to a major katabatic jump event that occurred during 9 and 10 August 2017 over Adélie Land. The observations and the model simulations are first described insection 2.Section 3then presents the results of the observational and modeling analysis. Section 4
further discusses the underlying physical mechanisms and the representativity of the study case. Section 5
closes the paper with a summary.
2. Data and methods
a. Ground-based measurements
In Adélie Land, a transect of automatic weather sta-tions (AWS) has been set up between Dome C on the high plateau and Dumont d’Urville (DDU) station lo-cated on Petrels Island 5 km off the coast. In this paper, we analyze 30-min-averaged surface pressure, tem-perature and wind data collected from three stations: D85 (70.428S, 134.158E, 2651 m MSL), D47 (67.388S, 138.738E, 1560 m MSL), and D17 (66.728S, 139.718E, 450 m MSL). The topography of Adélie Land and the location of the stations are depicted inFig. 1. At D17, acoustic FlowCapt devices give access to an estimation of the wind driven snow flux in the first 2 m above the surface. Note that FlowCapts tend to underestimate the magnitude of the flux with respect to reference optical sensors but they are very efficient in detecting the occurrences of blowing snow (Amory et al. 2017). In the present study, flux measurements with FlowCapts should thus be interpreted as lower bounds and they will only be used to identify blowing snow occurrences and periods of increase or decrease in snow transport. Local snow accumulation and ablation can be assessed with a Campbell SR50A acoustic depth gauge. Details on the AWS can be found online (http://amrc.ssec.wisc.edu).
We complement this dataset by 1-min-averaged 2-m temperature, 10-m wind, and surface pressure measure-ments at DDU station.
A Micro Rain Radar (MRR-n1) was installed at DDU in November 2015 in the framework of the Antarctic Precipitation Remote Sensing from Surface and Space campaign (APRES3;Grazioli et al. 2017;Genthon et al. 2018). It provides since then vertical profiles of K-band (24 GHz) reflectivity and Doppler velocity over the first 3000 m AGL with a resolution of 100 m. The 3-dB beamwidth is 28 and the Nyquist velocity range is 66 m s21. A second MRR (MRR-n2) was deployed in
February 2017 to took similar measurements focusing on the first 450 m AGL with a resolution of 15 m. Data were processed following the processing chain for snow hydrometeors developed byMaahn and Kollias (2012). Note that measurements are valid only above the third range gate of the MRRs (Grazioli et al. 2017).
From the radar Doppler spectrum width, it is possible to retrieve an estimation of the turbulent kinetic energy (TKE) dissipation in atmospheric layers containing hy-drometeors (see details inappendix A).
A 532-nm elastic lidar with polarization-sensitive system was deployed at DDU during the austral sum-mer campaign of 2016/17 at about 70 m MSL in a shelter located at the top of the Petrels Island (
Durán-Alarcón 2019). The lidar measures the backscattered signal over two polarizations of the emitted laser beam, giving access to vertical profiles of aerosol and cloud properties. After integration to reduce the noise level, the temporal (vertical) resolution of lidar backscat-tering coefficient and depolarization ratio (Weitkamp 2005) estimates was 10 min (23 m). Unfortunately, the lidar ceased collecting data at 0000 UTC 10 August, that is, in the middle of the studied event.
b. Satellite images
Brightness temperature images at 11.4mm (thermal infrared band) from the Visible Infrared Imaging Radiometer Suite (VIIRS; band I5 in the Sensor Data Record product; Cao et al. 2013) have been used to visualize the spatial structure of the katabatic jump and gravity waves. With a spatial resolution of 375 m, they reveal many details. However, approximately seven images per day, recorded around local noon and midnight, provide a limited temporal sampling with respect to the high dynamics of the event. To com-plement this dataset, we have also used the 1-km-resolution images of radiance at 11mm recorded by the Moderate Resolution Imaging Spectroradiometer (MODIS) instrument aboard the NASA Aqua and Terra satellites (band 31 in the MOD021KM and MYD021KM collection 6.1 products). This provides
FIG. 1. Map of the Adélie Land and synoptic conditions at 0000 UTC 10 Aug 2017 from ERA5. ‘‘Height’’ refers to the terrain altitude. Solid red (dashed orange) contours show the 500-hPa geopotential height in meters (the sea level pressure in hPa). The magenta square indicates the location of DDU, and the black circle, diamond, and star the D17, D47, and D85 stations, respectively. The light (dark) gray rectangle delimits the 4-km-resolution (1-km-resolution) WRF simulation domain.
nine images per day with complementary times of acquisition. Additionally, we have extracted VIIRS near-infrared images (865 nm, band I2, 365-m resolu-tion) taken near local noon on 10 August (0437 UTC) to assess the height of the blowing snow wall from drop shadow (appendix B). Unfortunately, neither Landsat-8 nor Sentinel-2 data are available during the event. All the images have been projected onto the common ste-reographic polar grid (ESPG: 3031) for analysis and they have been displayed with optimal contrast in the QGIS software.
The brightness temperature from thermal infrared bands measured by satellite can be complex to interpret as it integrates contributions from the atmosphere (air and vapor) and from water condensates in the atmo-sphere and at the ground surface. However, in our par-ticular case (i) the absorption at’11 mm in the ice is very strong so that ice crystals behave as a blackbody and their brightness temperature is almost equal to their physical temperature; (ii) because of the strong ab-sorption, a thin layer of ice crystals is sufficient to cut all the radiation coming from below; and (iii) as the cold and dry Antarctic atmosphere is very transparent at ’11 mm, the clear atmosphere does not contribute to the satellite signal. It results from these three points that the brightness temperature recorded at’11 mm by VIIRS and MODIS is very close to the physical temperature of the topmost ice crystals, that is, the snowpack if the sky is clear or the top layer of clouds or blowing snow otherwise.
c. WRF simulations
Numerical simulations were carried out with ver-sion 4.0 of the nonhydrostatic Weather Research and Forecasting (WRF) Model. Simulations start at 0000 UTC 9 August. The model is laterally forced and initialized with ERA5 (https://cds.climate.copernicus.eu/ cdsapp#!/home). Sea surface temperature and sea ice coverage are also provided by ERA5 and the Antarctic topography is from the 1-km-resolution Bedmap2 dataset (Fretwell et al. 2013). WRF has been run with a down-scaling method where a 12-km-resolution domain forces a 4-km-resolution domain (delimited by a light-gray rect-angle in Fig. 1) that itself forces a 500 km 3 500 km 1-km-resolution domain (delimited by a dark-gray rectangle inFig. 1). 69h vertical levels are used along the vertical up to 50 hPa (’19 km of altitude above DDU). A 5-km-deep damping layer has been prescribed at the top of the domains to preclude artificial reflection of waves. The wind field in the 12-km-resolution domain is nudged above the boundary layer toward ERA5 with a time scale of 6 h to ensure a realistic timing of the large-scale circulation. The physical package is similar to the
one used inVignon et al. (2019a). It particularly includes the Thompson microphysical scheme and the Mellor– Yamada–Nakanishi–Niino planetary boundary layer and its associated surface layer scheme. Note that the current version of WRF does not handle blowing snow. The humidity within the katabatic layer and within the jump is thus probably underestimated in the simulation but this should not substantially affect the overall dynamics of the flow. Although blowing snow also affects the buoyancy of the katabatic layer (Gallée et al. 2001), Lenaerts et al. (2012) conclude that the overall effect on the near-surface wind and temperature fields over Antarctica is, at the first order, relatively weak.
The vertical fluxes of momentum due to the simulated gravity waves have been calculated following the ap-proach ofPlougonven et al. (2013)andAlexander et al. (2017). The large-scale component of the zonal and meridional wind field has been identified using a moving filter with a Hamming window of width 250 km. Gravity wave fluctuations are then estimated by subtracting this large-scale component from the total field. It has been checked that the flux estimation is only slightly sensitive to the width of the Hamming window in the [150; 300 km] interval. In what follows, the presented WRF meteorological fields are those from the 1-km-resolution simulation. It should be noted that such a high resolution is necessary to explicitly represent the ’10-km-wavelength gravity waves that are evidenced hereafter (such small-scale waves are misrepresented or even absent in the 4-km- and 12-km-resolution do-mains). It is also worth mentioning that running the model in a nonhydrostatic configuration is essential to capture the high vertical wind velocities in katabatic jumps and small-scale trapped waves (not shown).
3. Results of the observational and modeling analysis
In this section, we analyze the temporality of the 9–10 August 2017 katabatic jump event from ground-based measurements and the WRF simulation, fo-cusing on three consecutive phases.
a. Phase 1: Development of the strong katabatic flow, 0600–2300 UTC 9 August 2017
On 9 August 2017, an extratropical cyclone tran-sits from the west to the east of DDU. In the mean-time, an anticyclone progressively sets at the west of the station, driving a southerly large-scale tropo-spheric flow that persists until the end of 10 August (Fig. 1). Note that the anticyclone arrives first on the top (southernmost part) of the transect, making
the plateau-to-coast pressure gradient force increas-ing at the stations from’0900 UTC 9 August.Figure 2
shows the time series of the wind speed and direc-tion, temperature and surface pressure at the four stations along the transect. In Adélie Land, the near-surface wind is generally southeasterly due to the combination of the katabatic forcing induced by the topography, the Coriolis force and the surface friction (Parish and Wendler 1991). However, during 9 August, the wind direction at D85, D47, and D17 is south-westerly and becomes increasingly southerly owing to the transit of the synoptic weather system east off DDU. At D47 and D85 the wind speed slightly increases from 0900 UTC concomitantly with the setting of the high pressure system at D85. At D17 the wind speed is relatively high (close to 20 m s21) but it also increases from 1800 UTC. Note that the blow-ing snow flux at the station dramatically increases from 1600 UTC and blowing snow signal is detected from the lidar at DDU around 1900 UTC (Fig. 3b). Although the southerly flow advects cold air from the high plateau, the temperature increases from
0900 UTC at D85 and from 1800 UTC at D47 and D17. Such an increase in near-surface temperature can be explained by an enhanced surface sensible heat flux and mixing within the katabatic layer in re-sponse to the wind acceleration. Moreover, the near-surface flow over the ice sheet experiences an adiabatic warming when going downhill (Kodama and Wendler 1986), the intensity of which increases with an increase in downslope wind speed. This effect also explains the plateau-to-coast gradient of the near-surface temper-ature in Figs. 2b, 2d, 2f, and 2h and in the surface brightness temperature field in Fig. 4a. In the latter figure, one can also notice the ‘‘warm patches’’ offshore on the sea ice. They correspond to the surges of the relatively warm katabatic flow upon the sea ice, which generally has a colder surface due to its high thermal emissivity and to the overlying stable boundary layer (Heinemann et al. 2019).
At DDU station, the wind is southwesterly until 1200 UTC and then becomes progressively southerly between 1200 and 1800 UTC. This is also well visible in the delineations—proxy of streamlines—of the
FIG. 2. The 9–10 Aug 2017 time series of the (left) wind speed and direction and of the (right) temperature and surface pressure at (a),(b) DDU, (c),(d) D17, (e),(f) D47, and (g),(h) D85. Also plotted in (c) is the blowing-snow flux (dotted black line). Note that DDU data are 1-min averages while data at D17, D47, and D85 are 30-min averages. Note also the differences in y axes among the right panels.
brightness temperature in Fig. 4a. Turbulent billow features that may explain the delineations parallel to the wind direction in katabatic flows can also be re-sponsible for atmospheric dunes of blowing snow as suggested inScarchilli et al. (2010). The magnitude of the wind at DDU then decreases between 1800 and 0000 UTC and becomes much lower than that mea-sured at D17 and D47. The WRF simulation shows that the air from inland is piling up over the stable boundary layer overlying the sea ice. This forms a cold air pool (Fig. 5a) that is responsible for a south-ward pressure gradient force (Gallée et al. 1996) that favors the initiation of the katabatic jump. The jump manifests as a decrease in wind speed and as a ‘‘backfolding’’ of the near-surface isentropes above the coastal margin of the ice sheet. A katabatic jump therefore starts to develop in the 15 km separating D17 and DDU, as schematized in Fig. 6. From 1800 UTC, the blowing snow layer seen by the lidar at DDU rises. The MRR-n2, and to a lesser extent the MRR-n1, also start to detect signals (Figs. 3c,d) and the vertical Doppler velocity can exceed 4 m s21 (positive
values are away from the radar, evidencing updrafts). Note that during the 2-day event, the SR50 at D17 mea-sures a snow-surface erosion of 15 cm.
b. Phase 2: Katabatic jump, 2300 UTC 9 August–0800 UTC 10 August 2017
At 2300 UTC, the near-surface wind at DDU briefly experiences a northerly excursion and the well-developed katabatic jump manifests as an impressive wall of blowing snow above the station (Fig. 3a). At that time of the event, the Froude number—calculated following
Gallée and Pettré (1998)—in the WRF simulation equals 3.5 (0.3) upstream (downstream) of the jump concurring with the ‘‘hydraulic jump’’ interpretation of the phenomenon initially proposed in the pioneering work of Ball (1957). The radiosounding launched at 2300 UTC reveals that the jump layer—corresponding to a well-mixed potential temperature layer with rela-tively low wind speed—is 700–800 m deep (Fig. 7). Note that as the sonde was rising and moving north-ward downstream of the jump, it also crossed—at a horizontal distance of about 5.5 km from DDU—a
FIG. 3. (a) Photograph of the snow wall taken around 2300 UTC 9 Aug at DDU station by F. Mariotti. (b)–(d) Time–height cross sections on 9–10 Aug 2017 of the lidar attenuated volume backscattering coefficientb of the parallel channel, MRR-n1 Doppler velocity, and MRR-n2 Doppler velocity, respectively. In (c) and (d), the region corresponding to the first three radar gates (with no reliable measurements) is shaded gray. Note the difference in the vertical axis in (d) vs those in (b) and (c). Note also that the lidar ceased functioning at 0000 UTC 10 Aug.
second layer of strong potential temperature gradient between 2000 and 2500 m of altitude. This layer cor-responds to the upper limit of the cold air pool. The snow wall and associated updrafts is also visible in the Doppler velocity measurements (Figs. 3c,d) and at midnight, the lidar reveals snow wall height of ap-proximately 1000 m. This value is probably slightly underestimated because of the attenuation of the lidar signal by blowing snow. Note that the MODIS thermal image at 0025 UTC (not shown) reveals a 2-km-width cold band almost parallel to the coast over DDU sta-tion that corresponds to the katabatic jump (see phys-ical explanation hereafter).
Between 0100 and 0430 UTC, the jump has moved northward and the strong katabatic flow upstream of the jump reaches DDU (see schematic inFig. 6). The measured wind speed at the station reaches values up to 57 m s21. Both the jump and the katabatic layer imme-diately upstream are very turbulent as manifested by the strong values of measured vertical Doppler velocity with
MRR-n2 as well as the strong vertical motions simulated by WRF (Fig. 8). Note that as WRF simulates the jump slightly more upstream than in reality, we show here the grid point 20 km upstream of DDU. The fact that the MRR only provides Doppler velocities inside the turbulent blowing-snow layer—so inside eddies—may explain the relative higher frequency of low vertical velocities in the model. A part of the difference be-tween simulated and observed vertical velocities may also be due to the fact that blowing snow is not a pure tracer of the air motions and the measured radar Doppler velocity encompasses a contribution due to the particles sedimentation (a few tenths of meters per second at the maximum;Nemoto and Nishimura 2004).Figure 9shows the time–height plot of the TKE dissipation« as estimated from MRR-n2 data (Fig. 9a) and as simulated by WRF (Fig. 9b). When comparable—that is, when there are suspended particles detected by the MRR-n2—the evolution of the simulated « is in rea-sonable agreement with the estimation from the MRR,
FIG. 4. Maps of brightness temperature from VIIRS images. The purple dot indicates DDU and the black contour indicates the coastline. North is toward the bottom-right corner of the images. (a) The thin yellow ellipse indicates a surge of the katabatic wind onto the sea ice and the dashed red line follows a delineation of the brightness temperature over the ice sheet and highlights the near-surface streamline arriving over DDU.
suggesting that the TKE field from the model is fairly realistic.
At 0430 UTC, the wind speed at DDU sharply de-creases and its direction becomes northerly for about 2 h. Meanwhile, the temperature drops by almost 58C. This corresponds to a southward motion of the jump that is back right above DDU (Fig. 6). Such southward motion is also visible by comparing the 0425 and 0605 UTC MODIS images (not shown). Note that a southward migration of a katabatic jump has already been noticed inGallée and Pettré (1998)and it is attributed to the progressive accumulation of cold air over the sea ice that exerts a pressure gradient force toward the conti-nent. The examination of the shadows in near-infrared VIIRS image at 0437 UTC reveals that the height of the associated snow wall at that time equals 1040 m (see
appendix B).
The observed change in wind direction and in tem-perature can be more precisely attributed to a rotor
induced by the boundary layer separation subsequent to the jump formation (Jiang et al. 2007). This rotor is more precisely located under the first crest of an un-dulation that is developing along the inversion at the top of the boundary layer downstream of the jump (Fig. 6). The lower branch of this rotor actually advects cold air from the sea ice toward the station. Such rotor is simulated by WRF but slightly more inland than actually observed (Fig. 10). The simulated TKE field exhibits maximum values in the upper part of the jump evidencing the strong mixing between the katabatic flow and the air aloft, in agreement with the findings of
Yu and Cai (2006).
From 0600 to 0830 UTC, the jump suddenly moves northward again. Subsequently, DDU station is back in the thin katabatic flow layer upstream of the jump (Fig. 6). This is visible inFig. 9ain which a sharp drop of the turbulent layer depth is noticeable just after 0600 UTC. The wind speed at DDU subsequently
FIG. 5. Cross sections along the 140.008E meridian of the wind speed (shading; m s21) and potential temperature (contours; K) from the WRF simulation. The x axis is the distance from the coast.
increases, its direction becomes southerly and the pres-sure drops (Figs. 2a,b) owing to the flow acceleration (Pettré and André 1991). The location of the jump at 0613 UTC is clearly visible in the VIIRS thermal image inFig. 4b. A well-defined cold band roughly following the Antarctic coast over more than 400 km can be observed. The analysis of the WRF simulation reveals that this cold band corresponds to the cooling of the ice surface at the updraft location due to a decrease in the surface sensible heat flux. Thermal emission from blowing snow at the top of the updraft (low temperature) also contributes to the ‘‘cold’’ signal. At the longitude of DDU, one can point out that the jump is located slightly to the north of the station, above the sea ice. Figure 4b also shows that undulations are forming at the surface downstream of the jump, in agreement with what WRF simulates at the same time (seeFig. 5b), even though the jump takes place a few kilometers farther inland than in reality. Such undulations evidence the development of a trap-ped gravity wave.
c. Phase 3: Gravity wave trapping, 0800 UTC 10 August–1600 UTC 11 August 2017
From 0800 UTC, the jump and the forming wave downstream move again southward toward the conti-nent (Fig. 6). The jump, which now corresponds well to the first crest of the wave, passes over DDU at around 0830 UTC and it manifests with a reversal of the near-surface wind direction and by a sudden drop of its magnitude. Once the first wave crest has overpassed DDU, the station is located in the first valley of the now trapped wave. The near-surface wind abruptly acceler-ates and reaches its absolute record value in 2017: 58.5 m s21(Fig. 2a). The 2-m temperature also reaches its maximum value during the event and during the 2017 August month: 210.48C (Fig. 2d). The strong
near-surface wind around 0830 UTC corresponds to neg-ative values of the Doppler velocity of the blowing snow cloud below 150 m. The measured magnitude is much higher than 0.5 m s21so higher than the typical sedimen-tation velocity of small blowing snow crystals (Nishimura and Nemoto 2005). This period of strong near-surface wind is therefore associated with a downdraft over DDU,
FIG. 6. Schematic of the different phases of the event.
FIG. 7. Potential temperatureu (black line) and wind speed U (red line) profiles from the radiosonde launched at 2300 UTC 9 Aug 2017. Radiosonde data were processed as in Vignon et al. (2019b).
which suggests that the acceleration of the flow is partly due to the vertical transport of momentum from above the boundary layer. The downdraft and associated quasi-adiabatic warming of the transported air parcels may also explain the high 2-m temperature values. Note that the wind is also probably accelerated owing to the increase in the local horizontal pressure gradient between the downdraft (high pressure anomaly) and the updraft downstream (low-pressure anomaly). WRF simulates an increase in 10-m wind speed and near-surface temperature just downstream of the downdraft associated downstream of the first wave crest. However, the magnitude of the simulated near-surface wind is underestimated by’20 m s21. The source of this strong bias has not been clearly identified but an overly weak subgrid vertical transport by the boundary layer scheme leading to an underestimated momentum flux from the midtroposphere to the surface can be suspected. Note that the rotor and subrotor dynamics (Doyle and Durran 2007) is only partly resolved in the model and it does not conform to standard local turbulence scaling laws (Vosper et al. 2018). Subsequently, the parameterization of the subgrid turbulence may be inaccurate in that case. While moving southward, the gravity wave develops and the first wave crest arrives over D17 around
1000 UTC as evidenced by the sharp decrease in the wind speed and blowing-snow flux associated with the increase in surface pressure (Figs. 2c,d). At 1200 UTC, the second wave crest arrives above DDU and the wind at the station turns northerly and its speed drops. The passage of the updraft just upstream of the second wave crest manifests as a clear peak of positive (reddish) vertical velocity values inFig. 3d. The well-developed trapped gravity wave is visible in the VIIRS image in
Fig. 4c. The horizontal extension of the wave over the sea ice is now well visible with aligned warm bands that correspond to regions of enhanced downward sensible heat flux at the surface in the wave valleys. The oscil-lation of the brightness temperature over the sea ice and the ice sheet indeed shows that the effect of the wave extends down to the surface by modifying its sur-face temperature. On the other hand, the sursur-face of the ocean (red areas inFig. 4c) is not affected owing to its higher temperature and higher thermal inertia. Convective instability or breezes can also potentially develop at the sea ice ocean margin, destabilizing the boundary layer and locally impeding the wave propagation. The potential temperature and wind speed fields in the WRF simulation
FIG. 9. Time–height plot of the TKE dissipation« during 10 Aug 2017. (a) Estimation from MRR-n2 measurements. (b) WRF vari-able 20 km south of DDU. In (a), the region corresponding to the first three radar gates with no reliable measurements has been shaded gray. In (b), a horizontal gray line indicates the top height of this region.
FIG. 8. Normalized distribution of the magnitude of the observed Doppler velocity with the MRR-n2 (gray histogram) and of the simulated vertical velocity at the jump location at 0000 UTC (20 km south of DDU) in WRF (red and blue histograms) between 45 and 450 m AGL and between 0000 and 0600 UTC 10 Aug 2017. The red histogram shows the resolved vertical velocity in the model. The blue histogram shows the sum of the resolved and turbulent components. The turbulent component at each grid point and time step has been estimated using a Monte Carlo sampling (10 000 times) within a normal distribution whose width equal the square root of the subgrid turbulent vertical velocity variance.
(Fig. 5c) show a trapped gravity wave pattern super-imposed on the boundary layer separation induced by the jump. Strong turbulence and vertical motions as well as near-surface flow reversal underneath the first wave crests are also simulated. This suggests that the flow is in the so-called jump1 wave regime according to the re-gime classification ofJiang et al. (2007).
While idealized nondecaying trapped gravity waves transport momentum only horizontally, trapped gravity waves that decay—owing to leakage of energy into the stratosphere or to boundary layer dissipation (Hills et al. 2016)—produce a net stress whose magnitude decreases with height (Broad 2002;Jiang et al. 2006). Hence those waves can exert a drag at low levels (Durran 1995;
Teixeira 2014) that in our case may substantially slow down the katabatic outflow from the ice sheet.Figure 11
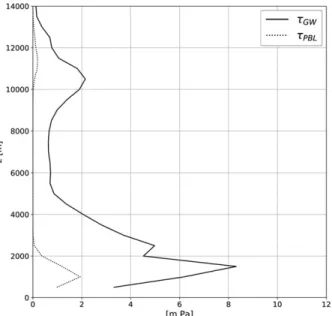
shows the vertical profile of the magnitude of the simu-lated gravity wave momentum flux (solid line) averaged in a 40 km 3 40 km region—including roughly four wavelengths—just off DDU and averaged between 1000 and 1600 UTC 10 August, that is, during the most intense trapped gravity wave activity in the model. One can notice that at the boundary of the ice sheet, the trapped gravity waves create some momentum flux up to 1500 m AGL and then the stress roughly decreases with increasing height up to 5000 m. The actual divergence of the stress between 1500 and 5000 m corresponds to wind speed tendency of’6 m s21h21(average over 40 km3 40 km region, over the 1500–5000-m layer and between 1000 and 1600 UTC). It is worth noting that the magnitude
of the momentum flux associated with the waves is much higher than the subgrid turbulent flux (dotted line). One can also notice a second maximum of the gravity wave momentum flux at an altitude of 11 000 m, corresponding to the second region where gravity waves get trapped.
Figure 12ashows a latitude–height cross section of the vertical velocity field at 1250 UTC in the WRF simulation. One can observe the superposition of a large-scale hy-drostatic wave signal with a higher spatial frequency signal corresponding to trapped lee waves. The major trapped wave is confined below 9000 m. Another trapped wave pattern is also visible more to the north between 9000 and 12 000 m where the meridional wind speed reverses sign. This second trapped wave train is located in a low-stratospheric destabilized layer but still stratified (the Brunt–Väisälä frequency N in the layer is close to 0.01 s21).
Focusing now on the lowest and major trapped wave train, one can notice its decay while it propagates northward.
Figure 12bshows the meridional cross section of the ver-tical wind speed at a 2000-m height (purple line). This graph shows that the dominant horizontal wavelength is around 11.5 km. This is close to the 10.5-km wavelength measured from the VIIRS brightness temperature (black line inFig. 12b).Figure 12cshows a time–height plot of the simulated vertical velocity above DDU. Interestingly, the high near-surface vertical velocity fluctuations that
FIG. 11. Vertical profiles of the magnitude of the gravity wave stresstGW(solid line) and the subgrid turbulent momentum flux tPBL(dotted line) average in the 40 km3 40 km region off DDU and between 1000 and 1600 UTC 10 Aug 2017. Gravity wave– associated fluxes have been calculated every 500 m in the vertical, and the subgrid turbulent flux has been plotted with the same resolution.
FIG. 10. Cross section along the 140.008E meridian of the TKE (shading; m2s22) from the WRF simulation at 0430 UTC 10 Aug 2017. Black arrows show the meridional–vertical wind vectors. The yellow circle indicates the near-surface rotor. The x axis is the distance from the coast and the north direction (positive north-ward). The inset in the top-right corner zooms in on the rotor.
correspond to the trapped gravity waves (from 0200 UTC 10 August in the simulation) are preceded by a clear and typical mountain wave pattern with vertical wavelength of 7600 m and an upward group velocity of about 0.52 m s21. A similar hydrostatic wave pattern was simulated in
Watanabe et al. (2006)in regions where strong katabatic flows reach steep coastal slopes. The trapped gravity wave continues to develop and to extend farther north at 1428 UTC (Figs. 4d and5d). From 1600 UTC, MODIS images show that the wave starts to dissipate and to move inland. The WRF simulation also exhibits a sharp decay of the gravity wave stress off DDU during the late afternoon (not shown). The wave completely dissipates during the second half of 11 August 2017 (not shown).
4. Discussion
a. From a katabatic jump to trapped gravity waves: Physical mechanism
The analysis of satellite images and of the ground-based measurements has revealed the gradual develop-ment of a katabatic jump that is followed by the excitation of a trapped gravity wave. The 1-km simulation with the WRF Model reproduces this event reasonably well except that the jump is located 20 km more inland than
in reality. How to explain this transition between a sharp katabatic jump to the formation of trapped gravity waves?
Classical gravity wave theory predicts wave trap-ping in atmospheric layers when the Scorer parameter S5 (N2/U2)2 (1/U)(d2U/dz2) decreases with
increas-ing altitude. In this case, some gravity wave harmonics that can propagate vertically at low levels become eva-nescent above a so-called turning point, compelling a portion of the wave energy to propagate horizontally. Such conditions can occur at a density discontinuity for instance. After multiple reflections between the turning points and the surface, only a small and discrete number of harmonics of the reflected spectrum survives, thereby defining the dominant (resonant) wavelength of the trapped wave field (Lott 2016). In our katabatic jump case, the inspection of the vertical structure of S shows that during 10 August 2017, the troposphere is prone to trapped waves (not shown).
Lott (2016)andSoufflet et al. (2019)further show that the onset of trapped lee waves is also dependent on the stability of the near-surface background flow because the surface—where the wind is null—acts as a critical level that absorbs—rather than reflects—waves depending on its dynamical stability. According toSmith et al. (2006),
FIG. 12. (a) Cross section on the 140.008E meridian of the vertical velocity (shading) and the meridional wind speed (gray contours) at 1250 UTC 10 Aug 2017 from the WRF simulation. (b) Plot of the brightness temperature from VIIRS measurements (black line) and of the simulated vertical velocity at z5 2000 m (purple line) at 1250 UTC 10 Aug 2017. In (a) and (b), the x axis is the distance from the coast. (c) Shading shows the time–height plot of the simulated vertical velocity above DDU station during 10 Aug 2017 [color scale as in (a)], and the line is the time series of the bulk Richardson number J calculated between z5 1500 m and the surface above DDU. The vertical axis is restricted to the 0–10 range for clarity. The dotted black line is J5 1. The terms cgandlzrefer to the group velocity and vertical wavelength, respectively.
dynamically unstable near-surface flows favor the onset of trapped gravity waves because of a weak surface absorption. Lott (2016)further theoretically demon-strates that waves remain partly trapped downstream of a mountain ridge when the near-surface flow is moderately dynamically stable (Richardson number J roughly com-posed between 0.25 and 1) and they become pure trapped waves (resonance) when the flow is dynamically unstable (0, J , 0.25). At high J, the disturbance stays confined along the downstream flank of the mountain and the energy mostly propagates vertically.
In the present katabatic jump case study, as the jump develops, the subsequent boundary layer separation makes the isentropes downstream of the coast and be-low 1500 m MSL move apart (seeFig. 5). The jump thus destabilizes the boundary layer above the coastal margin and the sea ice as can be seen in the times series of the bulk Richardson number above DDU inFig. 12c. The low troposphere above the ice sheet margin thus becomes more and more (less and less) prone to trap (absorb) wave harmonics as the jump develops. The trapped wave then extends in almost the whole troposphere.
b. Spatial and temporal representativity of the case study
Two questions that can also be raised from the above results are how often do such events occur over Adélie Land and do they occur over other regions of the Antarctic coast?
At DDU station, meteorologists report every day the occurrence of snow walls above the station itself—on Petrels Island—as well as the occurrence of snow walls forming on the ice sheet proper. Note however that their observations are restricted to ‘‘daytime’’ and to condi-tions where there is enough visibility.Table 1shows the 2012–17 monthly statistics of their observations, com-plemented by the 2017 monthly statistics of snow walls as pinpointed by visual inspection of the lidar data. Snow walls and the associated katabatic jumps mostly occur in winter, probably owing to the stronger katabatic winds during this season. Snow walls are more frequently ob-served on the continent than at DDU station suggesting that the jump often occurs before the flow reaches the coast. Although snow walls are very likely associated with katabatic jumps, the latter might occur without forming a clear snow wall if there is not enough mobile snow on the ice sheet surface. Moreover, the occurrence of a katabatic jump does not necessarily imply the presence of trapped lee waves. All the MODIS images (5264) available over Adélie Land between 1 October 2017 and 1 October 2018 have been inspected to derive statistics of katabatic jumps and subsequent waves
(bottom row inTable 1). It turns out that a majority of T
ABLE 1. Numb er of day s per mont h durin g w hich a snow wall occurs. The top row show s the Feb ruary–D ecemb er 2017 stat istics from visual in spectio n o f lidar dat a a t D D U station. The mid dle two rows sho w the 2012 –17 statistic s (mean [minimu m, maxi mum]) from on -site observ ations by meteo rologists at DDU. Observe rs provi de inf orma tion on the occurren ce of snow walls at DDU on Petre ls Island (second row) but also on the ice sheet pro per (t hird row) . The bot tom row shows the katabati c ju m p occurren ce stat ist ics der ived from vis ual inspe ction of the MOD IS satel lite data ove r coasta l A dé lie Land (same region as in fig4 ) d u ring the 1 Oct 2017 –1 Oct 2018 perio d (numb er of day s with a jump with or with out waves /days with a jump w ith waves on ly). Janu ary Febru ary March A pril May June Jul y Aug ust Septemb er Octob er Nove mbe r Decemb er Ye ar Lida r D D U — 0 2 1 5 0 1 3 Obs D D U 0 [0, 0] 0 [0 , 0] 0.7 [0, 3] 1 [0, 2] 2.3 [0, 5] 1.7 [0, 6] 1.2 [0, 3] 3.8 [2, 10] 4.3 [1, 11] 1 [0, 3] 0 [0 , 0] 0 [0, 0] 16 [1, 41] Obs con tinent 0 [0, 0] 1 [0 , 3] 5.2 [0, 11] 9.5 [6, 16] 5.7 [1, 12] 4.8 [1, 11] 5.7 [3, 11] 12.7 [7, 19] 10.7 [3, 24] 5.8 [1, 12] 0.8 [0, 2] 0.37 [0 , 4 ] 62.5 [29, 114] MODIS 5/4 4/2 2/1 4/2 7/3 4/2 13/ 9 2/0 5/3 3/3 4/3 3/3 56/ 38
jumps was associated with waves, but some (about one-third) were not. The absence of waves in the im-ages can partly be explained by the sampling of pre-liminary or developmental phases of waves. However, for some events such as 3 October 2017, we can notice that no waves are detected from the formation of the jump until its dissipation. It should be underlined that the report of the occurrence of jump/waves from MODIS images is strongly affected by, and dependent on, cloudiness. The provided numbers of occurrence should thus be interpreted as a lower bound.
Even though our study focuses on Adélie Land, one may expect katabatic jumps and trapped gravity waves to occur in other sectors along the ice sheet periphery. Using idealized nonhydrostatic numerical simulations,Yu et al. (2007) emphasize that katabatic jumps preferentially form in regions where the following criteria are met: 1) A cold-air pool is located near the foot of the slope,
creating a pressure gradient force that opposes the katabatic flow. Ice shelves and the presence of sea ice can promote the development of such cold air pool. Such condition is met over a large part of the Antarctic coast in winter. Summer sea breezes can also produce a similar pressure gradient force ori-ented toward the ice sheet (Pettré et al. 1993). 2) The synoptic conditions promote the development of
supercritical downslope winds, like the transit of a synoptic weather system off the coast and/or the setting of a high pressure system over the plateau. 3) There is an abrupt change in the topography (strong
concavity of the terrain height), implying a sudden change in the pressure-gradient force near the foot of the slope. This condition is met over a large part of the East Antarctic coast.
By investigating the momentum budget of the low-level Antarctic flow,Van den Broeke and Van Lipzig (2003) identify regions of strong ‘‘thermal wind’’ pres-sure gradient, that is the prespres-sure gradient due to hori-zontal changes in the potential temperature anomaly in the lowest atmospheric layers with respect to an undis-turbed background linear potential temperature profile (see their Fig. 11). When the corresponding force op-poses the katabatic flow, it can favor the occurrence of katabatic jumps. The authors show that the magnitude of this force is low over the plateau (see alsoGallée et al. 2015) but it is particularly high over the coast of Antarctica, opposing the main flow along most of the East Antarctic coast and along the coast of Marie Byrd’s Land in West Antarctica. In regions where this force is strong and where the near-surface wind speed can be very high (Parish and Bromwich 2007; Vignon et al. 2019b) such as Adélie Land, MacRobertson Land,
Kemp Land, and Dronning Maud Land, major kata-batic jumps and subsequent trapped lee waves can therefore be expected. An example of trapped gravity waves in Dronning Maud Land is shown inappendix C. Interestingly no katabatic jump has been reported over the Ross ice shelf, particularly at the foot of the Byrd glacier, which is an area characterized by both fierce katabatic flows from the high plateau (Bromwich 1989;
Parish and Bromwich 2007) and an abrupt change in terrain slope. Quite the contrary, this region is known for the horizontal propagation of strong winds over long distances above the ice shelf (Bromwich 1989;
Heinemann et al. 2019). One hypothesis to explain this feature was proposed by Gallée (1995). The author showed that the katabatic air from narrow glaciers that open on the Ross Sea piles up over a localized cold air ‘‘pocket’’ (seeFigs. 7and12). Unlike the cold-air band off Adélie Land coast, such an isolated ‘‘pocket’’ does not maintain a pressure gradient force opposed to the katabatic flow but spreads out, thereby forming a boundary layer front and extending horizontally the katabatic outflow.
5. Summary
Ground-based meteorological and remotely sensed measurements, satellites images, and high-resolution WRF simulations are combined to examine the coastal transition of a strong katabatic flow in Adélie Land during 9 and 10 August 2017. Downslope katabatic winds are first strengthened by the transit of a synoptic weather system over the austral ocean and the setting of an anticyclone to the southwest of the station. Once well developed over the slope of the ice sheet, the katabatic flow experiences an abrupt transition with a sharp decrease in wind speed and deepening of the boundary layer. This katabatic jump manifests at DDU as a very turbulent wall of blowing snow. Lidar mea-surements and satellite images reveal that this snow wall is several hundred meters high and its maximum altitude exceeds 1000 m. Thermal MODIS and VIIRS images also reveal that the jump extends over more than 400 km along the coast of Adélie Land. The Doppler radar samples updrafts and downdrafts whose speed exceeds 5 m s21. The processing of the Doppler spectral width makes it possible to estimate the TKE dissipation within the wall and to evaluate the simulated one, which appears to be in reasonable agreement with the observation-derived estimates. The katabatic jump initiates the trapping of gravity waves with a dominant horizontal wavelength of 10.5 km. Such trapping is fa-vored by the predestabilization of the downstream boundary layer by the jump. In addition, atmospheric
rotors form below the first wave crests. The 2017 wind speed record at DDU and the maximum monthly 2-m temperature correspond to the downward transport of momentum and heat by a rotor. Trapped gravity waves are also shown to exert a strong drag on the low-level outflow from the ice sheet. Statistical analysis from meteorological reports and lidar measurements at DDU as well as from the inspection of MODIS images shows that katabatic jumps and associated trapped gravity waves occur commonly in Adélie Land. This emphasizes the role of such mechanisms in the coastal Antarctic atmospheric dynamics, particularly during strong wind events on the continent. Katabatic jumps and signatures of gravity waves were detected at other Antarctic sta-tions (Renfrew and Anderson 2006; Orr et al. 2014;
Tomikawa et al. 2015). Given their topographic and meteorological configuration, other sectors along the East Antarctic coast are also potentially subject to jumps and waves. Future observational studies should be conducted to further characterize the development of jumps and the excitation of trapped gravity waves as well as to assess their potentially important effect on the large-scale atmospheric circulation and on water masses around Antarctica.
Acknowledgments. This work was funded by the EPFL-LOSUMEA project. The contribution of S.A. was sup-ported by Projects 4292 and 4387 of the Australian Antarctic program. The contribution of C.D. was sup-ported by the French National Research Agency (ANR; Grant ANR-15-CE01- 0003) through the APRES3 proj-ect. J. C. King, C. Genthon, O. Traullé, M. Lehning, V. Sharma, F. Gerber, and R. Plougonven are acknowl-edged for fruitful discussions as well as F. Mariotti for providing the photograph of the snow wall. The authors gratefully thank the University of Wisconsin–Madison Automatic Weather Station Program for operating and maintaining the D85 and D47 stations in collaboration with France and for freely distributing the datasets (NSF Grant ANT-1543305). The authors also thank Météo France and Pascal Herrera for the acquisition and distri-bution of meteorological observations and radiosonde data as well as APRES3 program and the French Polar Institute (IPEV) for the deployment and maintenance of the lidar and radars. D17 data are acquired in the framework of the CALVA program (http://www.lmd. jussieu.fr/;cgenthon/SiteCALVA/). We acknowledge The Comprehensive Large Array-data Stewardship System (CLASS) from the National Oceanic and Atmosphere Administration (NOAA) for distributing VIIRS data. We also thank three anonymous referees for their careful evaluation of the manuscript and thoughtful comments.
APPENDIX A
TKE Dissipation Estimation from MRR-n2 Measurements
For a vertically pointing radar like MRR, the Doppler spectrum widths2can be decomposed as follows (Doviak and Zrnic´ 1993;Maahn and Kollias 2012):
s25 s2
d1 s2s1 s2t. (A1)
Here,s2
dis the microphysics contribution due to the
different sizes of snow particles within a given radar volume,s2
sis the beam broadening contribution due to
contribution of cross-beam wind and wind shear within the radar volume, ands2
t is the variance part explained
by turbulent motions.
The order of magnitude of s2
d can be estimated
using a typical particle size distribution for blowing snow (e.g.,Nishimura and Nemoto 2005) and a typical fall speed–diameter relationship (Doviak and Zrnic´ 1993). It can be shown that the obtained estimations are lower by more than one order of magnitude than the observeds2. Therefore,s2
dcan be reasonably
ne-glected in Eq.(A1).Nastrom (1997)derives theoret-ical formulas fors2
s. Within a given radar volume,s2s
can read as a function of the radar parameters, of the mean wind speed and of the vertical wind shear. We do not have access to the mean speed and to the wind shear above DDU during the katabatic jump event, impeding us to properly estimates2
s. However, we can
calculate a first-order approximation of this contri-bution using the 1-min-resolution 10-m wind speed data (as mean speed value). For the wind shear, we set a fixed value equal to 0.12 s21that corresponds to the 0.95 quartile of the wind shear—at the MRR-n2 resolution—simulated by WRF in the jump region and within the first 450 m AGL (radial extent of the MRR-n2). The term associated to the wind shear contribution is weak (lower than 0.035s2for 95% of the data). The term due to
the mean wind contribution is more substantial but it re-mains relatively small for most of cases (lower than 0.27s2
for 80% of the data).
Assuming an isotropic and homogeneous turbulence in a neutral environment—which is a reasonable as-sumption for a well-mixed katabatic layer—the appli-cation of the Kolmogorov’s law then leads to
s2 t5
ðk2 k2
a«2/3k25/3dk , (A2)
where k is the wavenumber, « is the TKE dissipation, and a is a constant equal to 1.6 (Doviak and Zrnic´ 1993). Here, k25 2p/lr withlrthe vertical wavelength of the
radar; k15 2p/
ffiffiffiffiffiffi VS
3
p
, where VS is the radar scattering
volume (Maahn and Kollias 2012). Under the above-mentioned assumptions and ss estimation, « can be
calculated combining Eqs.(A1)and(A2).
APPENDIX B
Snow Wall Height Estimation from Near-Infrared Satellite Images
Knowing the solar elevation angle at a given time, it is possible to estimate the height of the blowing snow wall from a near-infrared satellite image making use of the drop shadow.Figure B1shows the near-infrared VIIRS image over Adélie Land at 0437 UTC. The well-defined black band is the shadow of the snow wall. The latter can be identified as a clear thin white band caused by the high reflectivity of ice crystals. Measuring the width of the drop shadow band and by performing a simple geometric calculation (solar elevation angle5 5.48), we can estimate that the snow wall height equals 1040 m at that time.
APPENDIX C
Example of a Katabatic Jump and Trapped Gravity Waves near Syowa Station
Tomikawa et al. (2015)revealed high vertical wind disturbances from measurements with a very high-frequency clear-air Doppler radar at Syowa station (69.08S, 39.68E), Dronning Maud Land. Numerical simulations showed that during the strong katabatic event of 16 and 17 June 2012, the measured vertical wind anomalies above Syowa were associated to a
katabatic jump that developed about 100 km south of Syowa station. The authors also suggested that vertical wind disturbances detected the day after, that is, 18 June 2012, might be due to trapped waves. Unfortunately, the VIIRS and MODIS images of 16–18 June 2012 are covered by clouds. However, a signal of trapped waves about 150 km upstream of Syowa can be noticed in the map of the infrared brightness temperature during 19 June 2012 (Fig. C1), suggesting that katabatic jumps followed by trapped gravity waves can also occur in this region of Antarctica.
REFERENCES
Adolphs, U., and G. Wendler, 1995: A pilot study on the interac-tions between katabatic winds and polynyas at the Adélie Coast, eastern Antarctica. Antarct. Sci., 7, 307–314,https:// doi.org/10.1017/S0954102095000423.
Alexander, S., and D. Murphy, 2015: The seasonal cycle of lower-tropospheric gravity wave activity at Davis, Antarctica (698S, 788E). J. Atmos. Sci., 72, 1010–1021,https://doi.org/10.1175/ JAS-D-14-0171.1.
——, K. Sato, S. Watanabe, Y. Kawatani, and D. J. Murphy, 2016: Southern Hemisphere extratropical gravity wave sources and intermittency revealed by a middle-atmosphere general cir-culation model. J. Atmos. Sci., 73, 1335–1349,https://doi.org/ 10.1175/JAS-D-15-0149.1.
——, A. Orr, S. Webster, and D. J. Murphy, 2017: Observations and fine-scale model simulations of gravity waves over Davis, East Antarctica (698S, 788E). J. Geophys. Res. Atmos., 122, 7355–7370,https://doi.org/10.1002/2017JD026615.
Amory, C., and Coauthors, 2017: Seasonal variations in drag co-efficient over a sastrugi-covered snowfield in coastal East Antarctica. Bound.-Layer Meteor., 164, 107–133,https://doi.org/ 10.1007/s10546-017-0242-5.
Andrews, D. G., J. R. Holton, and C. B. Leovy, 1987: Middle Atmosphere Dynamics. International Geophysics Series, Vol. 40, Academic Press, 489 pp.
FIG. B1. Near-infrared VIIRS image of the Adélie Land region at 0437 UTC 10 Aug 2017. The purple dot is DDU and the red contour indicates the coastline. North is toward the bottom-right corner of the image.
FIG. C1. Map of infrared brightness temperature from a VIIRS image over Dronning Maud Land. The purple dot is Syowa and the black contour identifies the coastline. The black arrow indicates the signature of a gravity wave. North is toward the top-right corner of the image.
Ball, F. K., 1956: The theory of strong katabatic winds. Aust. J. Phys., 9, 373–386,https://doi.org/10.1071/PH560373. ——, 1957: The katabatic winds of Adélie Land and King
George V Land. Tellus, 9, 201–208,https://doi.org/10.3402/ tellusa.v9i2.9087.
Baumgaertner, A. J. G., and A. J. McDonald, 2007: A gravity wave climatology for Antarctica compiled from Challenging Minisatellite Payload/Global Positioning System (CHAMP/GPS) radio occultations. J. Geophys. Res., 112, D05103,https://doi.org/ 10.1029/2006JD007504.
Broad, A. S., 2002: Momentum flux due to trapped lee waves forced by mountains. Quart. J. Roy. Meteor. Soc., 128, 2167–2173,
https://doi.org/10.1256/003590002320603593.
Bromwich, D. H., 1989: Satellite analyses of Antarctic katabatic wind behavior. Bull. Amer. Meteor. Soc., 70, 738–749,https://doi.org/ 10.1175/1520-0477(1989)070,0738:SAOAKW.2.0.CO;2. ——, D. F. Steinhoff, I. Simmonds, K. Keay, and R. L. Fogt, 2011:
Climatological aspects of cyclogenesis near Adélie Land Antarctica. Tellus, 63A, 921–938, https://doi.org/10.1111/ j.1600-0870.2011.00537.x.
Cao, C., J. Xiong, S. Blonski, Q. Liu, S. Uprety, X. Shao, Y. Bai, and F. Weng, 2013: Suomi NPP VIIRS sensor data record verifi-cation, validation, and long-term performance monitoring. J. Geophys. Res. Atmos., 118, 11 664–11 678,https://doi.org/ 10.1002/2013JD020418.
Carslaw, K. S., and Coauthors, 1998: Particle microphysics and chemistry in remotely observed mountain polar stratospheric clouds. J. Geophys. Res., 103, 5785–5796, https://doi.org/ 10.1029/97JD03626.
Chemel, C., C. Staquet, and Y. Largeron, 2009: Generation of in-ternal gravity waves by a katabatic wind in an idealized alpine valley. Meteor. Atmos. Phys., 103, 187–194,https://doi.org/ 10.1007/s00703-009-0349-4.
Doviak, R. J., and D. S. Zrnic´, 1993: Doppler Radar and Weather Observation. 2nd ed. Dover Publications, 562 pp.
Doyle, J. D., and D. R. Durran, 2002: The dynamics of mountain-wave-induced rotors. J. Atmos. Sci., 59, 186–201,https://doi.org/ 10.1175/1520-0469(2002)059,0186:TDOMWI.2.0.CO;2. ——, and ——, 2007: Rotor and subrotor dynamics in the lee of
three-dimensional terrain. J. Atmos. Sci., 64, 4202–4221,
https://doi.org/10.1175/2007JAS2352.1.
Durán-Alarcón, C., 2019: Ground-based remote sensing of Antarctic and alpine solid precipitation. Ph.D. thesis, Université Grenoble-Alpes, 144 pp.
Durran, D. R., 1995: Do breaking mountain waves decelerate the local mean flow? J. Atmos. Sci., 52, 4010–4032,https://doi.org/ 10.1175/1520-0469(1995)052,4010:DBMWDT.2.0.CO;2. Fretwell, P., and Coauthors, 2013: Bedmap2: Improved ice bed,
surface and thickness datasets for Antarctica. Cryosphere, 7, 375–393,https://doi.org/10.5194/tc-7-375-2013.
Gallée, H., 1995: Simulation of the mesocyclonic activity in the Ross Sea, Antarctica. Mon. Wea. Rev., 123, 2051–2069,https://doi.org/ 10.1175/1520-0493(1995)123,2051:SOTMAI.2.0.CO;2. ——, and P. Pettré, 1998: Dynamical constraints on katabatic
wind cessation in Adélie Land, Antarctica. J. Atmos. Sci., 55, 1755–1770,https://doi.org/10.1175/1520-0469(1998)055,1755: DCOKWC.2.0.CO;2.
——, ——, and G. Schayes, 1996: Sudden cessation of katabatic winds in Adélie Land, Antarctica. J. Appl. Meteor., 35, 1142–1152,https://doi.org/10.1175/1520-0450(1996)035,1142: SCOKWI.2.0.CO;2.
——, G. Guyomarc’h, and E. Brun, 2001: Impact of snow drift on the Antarctic ice sheet surface mass balance: Possible
sensitivity to snow-surface properties. Bound.-Layer Meteor., 99, 1–19,https://doi.org/10.1023/A:1018776422809.
——, H. Barral, E. Vignon, and C. Genthon, 2015: A case study of a low-level jet during OPALE. Atmos. Chem. Phys., 15, 6237–6246,https://doi.org/10.5194/acp-15-6237-2015. Garcia, R. R., A. K. Smith, D. E. Kinnison, A. Cámara, and D. J.
Murphy, 2017: Modification of the gravity wave parameteri-zation in the Whole Atmosphere Community Climate Model: Motivation and results. J. Atmos. Sci., 74, 275–291, https:// doi.org/10.1175/JAS-D-16-0104.1.
Genthon, C., A. Berne, J. Grazioli, C. Durán-Alarcón, C. Praz, and B. Boudevillain, 2018: Precipitation at Dumont d’Urville, Adélie Land, East Antarctica: The APRES3 field campaigns dataset. Earth Syst. Sci. Data, 10, 1605–1612,https://doi.org/ 10.5194/essd-10-1605-2018.
Grazioli, J., C. Genthon, B. Boudevillain, C. Duran-Alarcon, M. Del Guasta, J.-B. Madeleine, and A. Berne, 2017: Measurements of precipitation in Dumont d’Urville, Adélie Land, East Antarctica. Cryosphere, 11, 1797–1811,https://doi.org/10.5194/tc-11-1797-2017. Heinemann, G., L. Glaw, and S. Willmes, 2019: A satellite-based climatology of wind-induced surface temperature anomalies for the Antarctic. Remote Sens., 11, 1539, https://doi.org/ 10.3390/rs11131539.
Hertzog, A., G. Boccara, R. A. Vincent, F. Vial, and P. Cocquerez, 2008: Estimation of gravity wave momentum flux and phase speeds from quasi-Lagrangian stratospheric balloon flights. Part II: Results from the Vorcore campaign in Antarctica. J. Atmos. Sci., 65, 3056–3070,https://doi.org/10.1175/2008JAS2710.1. Hills, M. O. G., D. R. Durran, and P. N. Blossey, 2016: The
dissi-pation of trapped lee waves. Part II: The relative importance of the boundary layer and the stratosphere. J. Atmos. Sci., 73, 943–955,https://doi.org/10.1175/JAS-D-15-0175.1.
Holt, L. A., M. J. Alexander, L. Coy, C. Liu, A. Molod, W. Putman, and S. Pawson, 2017: An evaluation of gravity waves and gravity wave sources in the Southern Hemisphere in a 7 km global climate simulation. Quart. J. Roy. Meteor. Soc., 143, 2481–2495,https://doi.org/10.1002/qj.3101.
Jiang, Q., J. D. Doyle, and R. B. Smith, 2006: Interaction be-tween trapped waves and boundary layers. J. Atmos. Sci., 63, 617–633,https://doi.org/10.1175/JAS3640.1.
——, ——, S. Wang, and R. B. Smith, 2007: On boundary layer separation in the lee of mesoscale topography. J. Atmos. Sci., 64, 401–420,https://doi.org/10.1175/JAS3848.1.
Kodama, Y., and G. Wendler, 1986: Wind and temperature regime along the slope of Adelie Land, Antarctica. J. Geophys. Res., 91, 6735–6741,https://doi.org/10.1029/JD091iD06p06735. Lenaerts, J. T. M., M. R. van den Broeke, S. J. Déry, E. van
Meijgaard, W. J. van de Berg, S. P. Palm, and J. Sanz Rodrigo, 2012: Modeling drifting snow in Antarctica with a regional climate model: 1. Methods and model evaluation. J. Geophys. Res., 117, D05108,https://doi.org/10.1029/2011JD016145. Lott, F., 1998: Linear mountain drag and averaged pseudo-momentum
flux profiles in the presence of trapped lee waves. Tellus, 50A, 12–25,https://doi.org/10.3402/tellusa.v50i1.14509. ——, 2016: A new theory for downslope windstorms and trapped
mountain waves. J. Atmos. Sci., 73, 3585–3597,https://doi.org/ 10.1175/JAS-D-15-0342.1.
Maahn, M., and P. Kollias, 2012: Improved Micro Rain Radar snow measurements using Doppler spectra post-processing. Atmos. Meas. Tech., 5, 2661–2673,https://doi.org/10.5194/amt-5-2661-2012. McNider, R. T., 1982: A note on velocity fluctuations in drainage flows. J. Atmos. Sci., 39, 1658–1660, https://doi.org/10.1175/ 1520-0469(1982)039,1658:ANOVFI.2.0.CO;2.