HAL Id: hal-00453856
https://hal.archives-ouvertes.fr/hal-00453856
Submitted on 5 Feb 2010
HAL is a multi-disciplinary open access
archive for the deposit and dissemination of sci-entific research documents, whether they are pub-lished or not. The documents may come from teaching and research institutions in France or abroad, or from public or private research centers.
L’archive ouverte pluridisciplinaire HAL, est destinée au dépôt et à la diffusion de documents scientifiques de niveau recherche, publiés ou non, émanant des établissements d’enseignement et de recherche français ou étrangers, des laboratoires publics ou privés.
Controlling for natural variability in assessing the
response of fish metrics to human pressures for lakes in
north-east USA
P. Irz, J. de Bortoli, F. Michonneau, Tr. Whittier, T. Oberdorff, C. Argillier
To cite this version:
P. Irz, J. de Bortoli, F. Michonneau, Tr. Whittier, T. Oberdorff, et al.. Controlling for natural variability in assessing the response of fish metrics to human pressures for lakes in north-east USA. Aquatic Conservation: Marine and Freshwater Ecosystems, Wiley, 2008, 18 (5), p. 633 - p. 646. �hal-00453856�
Controlling for natural variability in assessing the response of fish
metrics to anthropogenic pressures for Northeast U.S.A. lakes
Pascal Irz, Julien De Bortoli, François Michonneau, Thomas R. Whittier, Thierry Oberdorff and Christine Argillier
P. Irz, J. De Bortoli, F. Michonneau1 and C. Argillier2. Cemagref / GAMET. Unité de Recherche Hydrobiologie, 361 rue J.F. Breton, BP 5095, 34196 Montpellier Cedex 5, France.
T.R. Whittier. Department of Fisheries and Wildlife, Oregon State University, 200 SW 35th Street Corvallis, OR 97333 USA.
T. Oberdorff. Institut de Recherche pour le Développement (IRD, UR 131). Département Milieux et Peuplements Aquatiques, Muséum national d’histoire naturelle, 43 rue Cuvier, 75231 Paris cedex 05, France.
1
Present address: Department of Zoology, University of Florida, 223 Bartram Hall, PO Box 118525, Gainesville FL, 32611-8525 USA.
2
Corresponding author: e-mail: christine.argillier@cemagref.fr; Fax: (33) 4 67 16 64 40
Running title: Fish metrics for lakes
Keywords: Biological monitoring, lentic systems, impact, variance partitioning, functional guilds, index of biotic integrity, land use, urbanisation.
Abstract
1. While fish-based Indices of Biotic Integrity have been developed for a wide array of lotic systems, equivalent tools have seldom been adapted to the monitoring and assessment of lakes. Major difficulties arise in such work: (i) collecting data that allow statistically robust analyses, (ii) choosing the relevant variables to describe the biotic, environmental and anthropogenic data sets and (iii) assessing the relative importance of the latter two in explaining the former. The aim of the present paper is to produce such an assessment for the fish communities of the lakes of northeast USA.
2. Fish surveys, environmental features and catchment-scale descriptors of anthropogenic stresses (agricultural and urban land uses) were collected for 112 natural lakes.
3. Fish metrics, i.e. species richness and percentages of species belonging to reproductive, trophic, and tolerance guilds were regressed against anthropogenic variables then against anthropogenic variables and the natural environmental.
4. It was shown that failing to control for the natural environmental conditions in the IBI construction led to selecting metrics (% of intolerant species and % of omnivorous species) that did not display response to stresses when the environment was controlled for. Moreover, controlling for natural variability of the metrics allowed identifying the impact of agricultural land use on the % of diadromous species.
5. Fish communities appear valuable for the bioassessment of lakes. Appropriate statistical methods have proved that the natural variability in the bioassessment tools could be accounted for, thereby allowing assessments at multiple basins and ecoregions scales. This opens new perspectives for the development of IBIs for lentic systems in lake-poor regions, such as southern Europe, and therefore represents a significant contribution to the implementation of the European Water Framework Directive.
Introduction
Apart from a limited community of scientists working on the alteration of ecosystems undergoing human impacts, environmental awareness has long been an attribute of politically engaged environmentalists. The debate opposed those giving priority to the conservation of species and ecosystems to those considering that such conservation objectives would be harmful to the socio-economic development. The idea that the alteration of ecosystems’ functioning could strongly affect the human uses of these systems widened the stakes in
environmental conservation (Baron et al., 2002). From that point of view, freshwater ecosystems are of particular concern (Gleick, 2003). Access to water resources to meet human needs both qualitatively and quantitatively is now considered as a prerequisite to human development (Jackson et al., 2001; Baron et al., 2002; Gleick, 2003). This shift in awareness has been accepted by at least some political authorities in many parts of the world, leading to regulations aimed at protecting and / or improving the integrity of hydrosystems (e.g. the European Water Framework Directive – WFD, or the Clean Water Act in the U.S.A.). A guiding spirit of these regulations was that ensuring the ecological integrity of water bodies was the best guarantee of the sustainability of the services and commodities provided by freshwater ecosystems.
The concept of biological integrity of ecosystems was defined by Karr and Dudley (1981) as “the capability of supporting and maintaining a balanced, integrated, adaptive community of organisms having a species composition, diversity and functional organisation comparable to that of natural habitat of the region”. Although this is an ecosystem-level definition, most studies assessing ecological integrity rely upon biological community-, guild- or population-level indicators.
Multimetric fish-based indices, like the Index of Biotic Integrity (IBI) first formulated by Karr (1981), have been developed for a wide array of lotic systems. However, equivalent tools have seldom been adapted to the monitoring and assessment of lakes (but see Dionne and Karr, 1992; Hughes et al., 1992; Minns et al., 1994; Jennings et al., 1995; Jennings et al., 1999; Whittier, 1999; Appelberg et al., 2000; Drake and Pereira, 2002). Most of these studies were only preliminary even if some assessed the response of individual fish metrics to anthropogenic stresses undergone by lakes such as acidification (Appelberg et al., 2000), eutrophication (Jennings et al., 1999) or land use (Drake and Pereira, 2002). However, a major difficulty in identifying which bioassessment metrics perform best (those that clearly respond to anthropogenic pressures) is that these metrics generally also display natural patterns of variation (Karr et al., 1986; Karr, 1999; Smogor and Angermeier, 1999; Oberdorff
et al., 2002). Therefore, it is necessary to adjust the metrics to account for this natural
variability before analysing their relationship with anthropogenic stresses, which has not or only partially (i.e. adjusting metrics to a single environmental gradient) been done in the previous studies dealing with standing waters.
Thus, the aim of the present study is to demonstrate the importance of environmental control in the assessment of response of northeast USA lake fish metrics to catchment scale
anthropogenic pressures. Because good quality data on lentic fish communities are lacking in southern Europe, we believe this study of Northeast USA lakes will support the implementation of the WFD for European lakes
Materials and methods
The data set
The data were collected between 1991 and 1994 from 196 northeast U.S.A. natural lakes and reservoirs by the U.S. Environmental Protection Agency’s Environmental Monitoring and Assessment Program (EMAP, Larsen et al., 1991, Whittier and Paulsen, 1992). The lakes were selected using a probability design to be representative of regional conditions (Larsen et
al., 1994). Each summer, five or six crews were employed to sample 49 to 68 lakes, on a four
year rotation. A random subset of 48 lakes received one, two or three repeat samples, with no more than two visits in any summer. For this study only the first visit data were assessed. Sampling was conducted from early July through mid-September, during the period of lake stratification. The sampling schedule was arranged to remove, as much as logistically possible, spatial bias from the sampling dates. Fish assemblages were sampled with overnight sets of gillnets, trapnets and minnow traps, and by night seining (Baker et al., 1997, Whittier
et al., 1997). A standardized level of effort, as a logarithmic function of lake size, ranged from
one to 10 sets of each passive gear and up to 6 seining sites (Baker et al., 1997). The sampling objective was to collect a representative sample of the fish assemblage at each lake, without regard to any particular species, or concentrated sampling of species-rich habitats. Fish were identified to species, and counted. Voucher specimens were archived at either the Harvard University Museum of Comparative Zoology (Cambridge, MA) or the New York State Museum (Albany, NY).
The field sampling protocols (Baker et al., 1997) are available at the EMAP website http://www.epa.gov/emap/html/pubs/docs/groupdocs/surfwatr/field/97fldman.html. For each lake, the fish community was represented as the sum of the catch data from all gear.
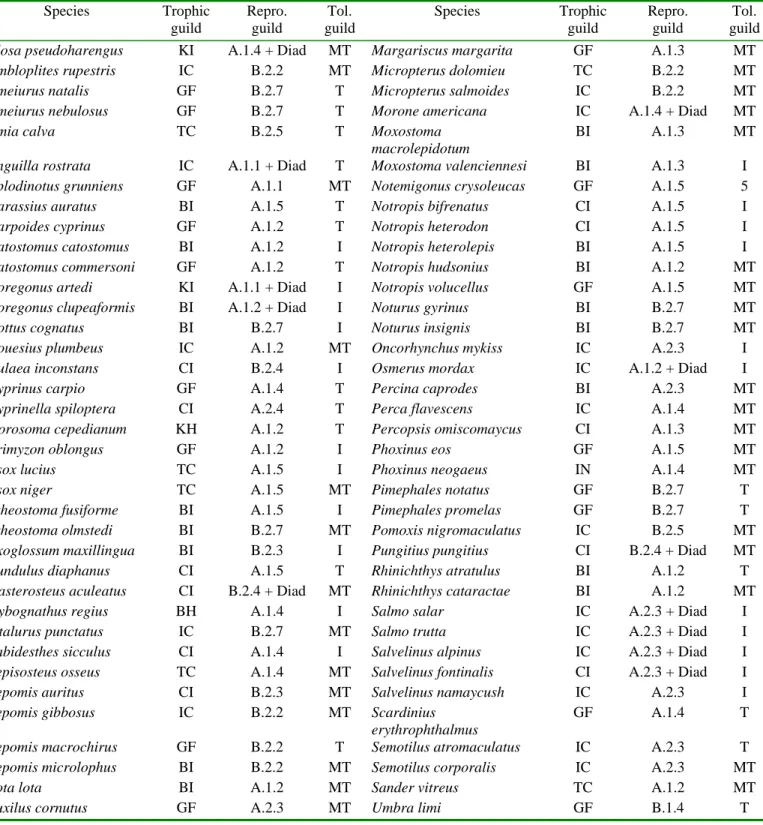
The classification of species into trophic guilds (Table 1) was based on a literature survey (Bruslé and Quignard, 2001; Goldstein and Simon, 1999; Whittier, 1999). The reproductive guild classification mainly follows Simon (1999) with some additions from Balon (1975) and online resources (see in reference list). Noturus insignis was considered benthic invertivorous based on other Noturus species listed in Simon (1999). Tolerance classifications were from
Halliwell et al. (1999). They correspond to a general assessment of the species environmental niche breadth.
Ten traits (Table 2) were derived from the community guilds: four from the trophic guilds (piscivorous, invertivorous, omnivorous and benthivorous), four from the reproductive guilds (litho-psammophilous, phytophilous, guarder and diadromous) and two from the tolerance guilds (tolerant and intolerant). Using species’ migratory and parental care characteristics is not common in IBI metrics but it was hypothesised that these traits, being important features of the species life-history strategies, might display responses to anthropogenic disturbances (Winemiller and Rose, 1992). Other life history traits (growth rate for example) could be valuable in this perspective but they were not available for these data.
Ten guild –based metrics were expressed as proportions of species (i.e., number of species sharing a trait divided by the total number of species in the lake) to which the total species richness metric was added (Table 3). Non-native species were not omitted because they were considered as part of the resident species pool (Halliwell et al., 1999), both native and non native species have been included in the metric calculations. Alternative ways of combining faunal sampling and guild assignment to obtain metrics could have been used, for example to obtain the percentage of individuals per guild, but the use of abundance and/or biomass estimates for fish in deep and heterogeneous environments, such as lakes and reservoirs, always gives rise to sampling issues (Jackson and Harvey, 1997).
Environmental variables, catchment-scale measures of land use and anthropogenic pressures were obtained from digitized maps (Table 4). The environmental variables used can be considered as the main abiotic determinants of richness and structure of fish assemblages in natural lakes (Amarasinghe and Welcomme, 2002; Irz et al. in press). The assemblage and habitat data analysed here are available at the EMAP website (http://www.epa.gov/emap/html/dataI/surfwatr/data/nelakes).
Analytical procedure
The procedure was designed (i) to analyse the relationship between the fish community metrics and the anthropogenic features of the lakes without control of the environment, (ii) to analyse the relationship between the fish community metrics, and the environmental and anthropogenic features of the lakes and (iii) to partial out the variation in fish community metrics into four components: purely environmental, purely anthropogenic, covariation relationships between environmental and anthropogenic, and unexplained.
The large number of predictor variables (Table 4) and the correlation among them required factor analysis to reduce dimensionality and avoid colinearity. This was achieved by means of standardised Principal Components Analysis (PCA). The principal components (PCs) are independent from each other and summarise the variance in the data matrix. A first PCA was carried out on the log-transformed environmental matrix, of which the first three PCs (env1 to env3) were kept for further analysis. The four variables describing anthropogenic pressures related to urbanisation were highly correlated, therefore, they were synthesised into a single variable that was the first PC of a PCA carried out on these four variables. The percentage of agricultural lands in the catchment (AG_TOT) was transformed to arcsine X to approach normality. This transformation is classically recommended for percentage variables (Sokal and Rohlf, 1994).
Each fish metric was transformed to arcsine X and regressed against the environmental and anthropogenic variables in multiple linear regressions (MLR). The significance of the models was assessed using an F-test. Visual examination of residual values was performed at each step of the procedure to identify potential outliers.
Variance partitioning was then carried out for each fish metric following the four steps recommended by Legendre and Legendre (1998) in situations where two complementary sets of variables may contribute to the variation of an ecological variable (Figure 1):
• Step 1: The metric was regressed against the anthropogenic PCs in MLR. The corresponding coefficient of determination R²1 measured [a]+[b].
• Step 2: The metric was regressed against the environmental PCs in MLR. The corresponding coefficient of determination R²2 measured [b]+[c].
• Step 3: The metric was regressed against the environmental and anthropogenic PCs in MLR. The corresponding coefficient of determination R²3 measured [a]+[b]+[c]. • Step 4: Each component was obtained by subtraction: [a]=R²3-R²2; [b]=R²1+R²2-R²3;
[c]=R²3-R²1; [d]=1-R²3.
A negative component [b] indicates that the anthropogenic and environmental sets of variables together explain the metric variation better than the sum of the individual effects of these two sets of variables (Legendre and Legendre, 1998).
All analyses were computed with R software (Ihaka and Gentleman, 1996) and carried out on the subset of 112 natural lakes (including “augmented lakes”, i.e. lakes that existed before
European settlement that have been deepened by >30%). Reservoirs were excluded because a preliminary analysis had shown that both environmental and land use variables differed between these two types of systems (Whittier et al., 2002). Natural lakes with a total species richness of three or less were also omitted because IBI metrics have little chance to be relevant for species poor sites (Fausch et al., 1990). As some of the lakes had been surveyed on more than one occasion, and in order to avoid statistical biases (i.e. pseudoreplication), only the first sampling visit was included in the analyses.
Results
Analysis of the environmental variables
The PCA carried out on the environmental variables (Table 5) showed that the variables related to the lakes’ size were strongly correlated and contributed to the first environmental PC (env1). The second axis (env2) summarised the geographical location of the lakes, with the variables related to the altitude and straight-line distance to the sea. Axis 3 (env3) carried the rainfall regime but its eigenvalue was rather low (corresponding to 13% of the total variance).
Response of fish metrics to anthropogenic influences without control of the
natural environment
Six of the eleven candidate fish metrics displayed a response to anthropogenic pressures (Table 6). The only type of pressure significantly contributing to the models was Urb_PCA, indicating the predominance of catchment urbanisation as an impacting force. Lakes with urbanised catchments displayed a decrease in the percentage of diadromous (%_Diad), omnivorous (%_Omn) and intolerant species (%_Intol) and an increase in the proportion of phytophilous (%_Phyto), guarder (%_Guarder) and piscivorous (%_Pisc) species.
Response of fish metrics to anthropogenic influences after controlling for
natural environmental factors
Four fish metrics displayed a response to Urb_PCA when environment was controlled for (Table 7). Lakes with urbanised catchments displayed a decrease in the percentage of diadromous species (%_Diad) and an increase in the proportion of phytophilous (%_Phyto), guarder (%_Guarder) and piscivorous (%_Pisc) species. A single reproductive based metric displayed a positive response to the proportion of agricultural land use in the catchment. Apart
from %_Guarder, all other models included significant coefficients for at least one environmental PC, which underlines the importance of accounting for the natural patterns of variability when studying the response of bioassessment indicators to anthropogenic pressures. The main natural factor contribution to the models was the lake size (env1). The strongest response to anthropogenic pressure was the increase in %_Guarder, with 30% of the variance attributed to the anthropogenic variables, then %_Phyto with 13%, %_Diad with 11% and %_Pisc with 9%. Three of the four models displaying response to anthropogenic pressures were related to the reproductive requirements, combined with a single trophic structure metric (%_Pisc).
Discussion
Whatever the model developed (i.e. integrating or not natural environmental factors), species richness did not respond to the anthropogenic pressures considered in this study. The absence of clear impact on species richness was not surprising given that various responses of this metric have been reported, from an increase due to eutrophication (Dodson et al., 2000; Mittelbach et al., 2001) or species introductions (Irz et al., 2004), to a decrease due to the extirpation of habitat sensitive taxa (Corbacho and Sanchez, 2001). However, this metric is one of the most frequently included in IBIs developed for lakes (Hickman and McDonough, 1995; Jennings et al., 1999; McDonough and Hickman, 1999; Whittier, 1999; Appelberg et
al., 2000; Drake and Pereira, 2002). Including non-responsive metrics in an index results in
increasing the noise in the data and hence alters its ability to detect or assess the impact of anthropogenic activities on ecological systems. Therefore, the IBIs that have been developed skipping the step of the evaluation of the response of individual metrics to stressors (step 4 in Whittier et al., 2001) are unlikely to be optimised in terms of indicator properties.
The negative relationship between %_Intol and Urb-PCA is significant only when the natural environment is not controlled for. Most of the fish-based IBIs developed for lakes also include tolerance metrics (Hickman and McDonough, 1995; Jennings et al., 1999; McDonough and Hickman, 1999; Whittier, 1999) that frequently exhibit clear relationship with the pressures. However, these studies do not control for the effects of differences in natural habitat conditions across lakes other than lake area (Whittier, 1999). This statement gives rise to substantial doubts relative to the ability of tolerance metrics to respond to anthropogenic stressors when the confounding environmental effects are discarded. It may be a consequence of the difficulty in assigning species to tolerance guilds. For the purpose of the present study, the choice was made to use the fish species tolerance rating according to
Halliwell et al. (1999) rather than according to Whittier (1999) or Whittier and Hughes (1998). Although these latter studies were dedicated to the fish communities of the lakes studied here, we considered it to be more rigorous to assign tolerance guilds on the basis of a totally independent source that did not use the EMAP data set. It is clear that the assessment of the species tolerance is highly dependent upon the regional context. For example a species could be considered as intolerant in some regions where it is restricted to some particular type of environment (e.g. at the edges of its distribution area, see Karr, 1991), and tolerant in another region where it is widespread (e.g. at the centre of its distribution area). However, using the same data set to assess the species tolerance to anthropogenic stresses and to analyse the response of tolerance metrics to the same stresses would have led to a circular reasoning. Experimental tests of sensitivity to specific stresses would ensure the independence between the assessment of the species sensitivity and the data set used to analyse the response of fish communities to human stresses, but would be beyond the scope of this study.
Two of four trophic composition metrics displayed relationships with the anthropogenic pressures without environmental control while a single did with. This was consistent with the frequent inclusion of trophic metrics in river IBIs (Hughes and Oberdorff, 1999; Belpaire et
al., 2000) and has been previously suggested with a different analytical procedure on a
sub-sample of the present data set (Whittier, 1999), and on other lentic systems (Jennings et al., 1999; Drake and Pereira, 2002). The strong positive relationship observed in the two models (i.e. integrating or not natural environmental factors) between piscivorous species and urbanisation could be explained by species manipulations in urbanised area in response to angler’s demand. The negative bivariate correlation between urbanism and %_Omn was opposed to those previously observed both on lakes (Schulz et al., 1999; Drake and Pereira, 2002) and on rivers (Oberdorff et al., 2002). However, this relationship was not significant when the effects of natural environmental factors were controlled for, thereby suggesting that the correlations between natural environmental factors and anthropogenic stressors can lead to artificial metric – stress relationship.
Except for %_LithPsam, regardless of the models developed (i.e. integrating or not natural environmental factors) all of the remaining spawning guild metrics were related to anthropogenic variables. Hence, the reproduction-based metrics were those that most frequently significantly contributed to the models. Furthermore, controlling for the environment allows identifying the effect of agricultural land use on %_Diad. In this case the variability in the metric attributable to the environment is likely to have blurred its response to land use.
Reproductive metrics were not included in the early IBIs developed for lotic systems (Karr et
al., 1986; Karr, 1991; Hughes and Oberdorff, 1999) but have now been proved to be relevant
(Oberdorff et al., 2002; Pont et al., 2006) and their response to anthropogenic stressors has never, to our knowledge, been shown for lacustrine environments. The availability of suitable spawning habitats is certainly one of the major factors driving the fish species (and guilds) species distributions in freshwater systems. These results indicate that the alteration of these habitats is likely to be responsible for major impacts on lentic fish communities.
Conservation and scale issues
It is now commonly accepted that local communities are shaped by an interplay between local and larger-scale processes (O'Neill, 1989; Levin, 1992; Ricklefs and Schluter, 1993). Consequently, the spatial scale is important when considering the assessment of anthropogenic pressures. The functioning of freshwater ecosystems is highly dependent upon the catchment from which they receive most of their inputs (Baron et al., 2002), but also upon their connectivity with the downstream river network from which they receive most of the colonist species, and upon local human uses. In this study, only the catchment was considered. Thus, the metrics displaying no link with the anthropogenic pressures at the catchment scale could respond to other local pressures such as hydroelectricity production, power boating, and flood control, as well as broader-scale pressures.
A multiscale analyse is also critical to the design of conservation strategies (Lewis et al., 1996; Turner, 2005). For example, impacts of invasive species, global change, air pollution or human-induced landscape alterations can hardly be assessed by local and short-term investigations because they imply relatively slow dynamics (as compared to the duration of most ecological studies) and operate according a hierarchical framework in which regional scale alterations potentially lead to local impacts. Therefore, the implementation of efficient management strategies to mitigate these impacts requires understanding the mechanisms implied at various scales as well as the links between scales (Turner, 2005).
The contemporary technological and scientific contexts give the opportunity for broad-scale ecological investigations that should be both scientifically innovative and efficient support for ambitious environmental policies. Nevertheless, so far, general conservation issues and management decisions are still often discussed at a restricted scale compare to the one required by the targeted ecological process. Considering that inland waters (e.g. lakes and rivers) belong to the most intensively human influenced ecosystems on Earth, partly due to
their interface position in the landscape and the fact that human population densities and associated activities are highest along river courses (Dudgeon et al., 2006), developing large-scale conservation strategies becomes crucial for these ecosystems.
Conclusion
The pioneering works on IBIs have been carried out at relatively limited spatial scales in order to mitigate the “uncontrolled” larger-scale processes. However, recent developments of bioassessment tools for lotic systems have proved that appropriate statistical methods could efficiently account for the natural variability of community attributes, thereby allowing working at multiple basins and ecoregions scales (Oberdorff et al., 2002; Pont et al., 2006). The present study shows that similar techniques can also be implemented for lake systems over broad geographic areas. This type of procedure opens new perspectives for the development of assessment tools for lentic systems in lake-poor regions, such as southern Europe, in which working within basins would not allow the collection of a sufficient number of samples to obtain statistically and ecologically sound assessments of the response of fish communities to anthropogenic stresses.
Acknowledgements
Nicolas Poulet provided constructive comments on the initial manuscript. Emmanuel Poncet was of great help for the statistical analysis and programming. This study was funded by Cemagref through its Etat Ecologique Action and by the French Ministère de l’Ecologie et du Développement Durable. Partial funding was provided by U.S. EPA National Health and Environmental Effects Research Laboratory, Western Ecology Division, in Corvallis, Oregon, through Cooperative Agreement CR831682-01 to Oregon State University. Although the data have been funded wholly or in part by the U.S. EPA through its EMAP Surface Waters Program, it has not been subjected to Agency review, and therefore does not necessarily reflect the views of the Agency and no official endorsement of conclusions should be inferred.
References
http://www.fishbase.org/
http://sites.state.pa.us/PA_Exec/Fish_Boat/pafish/fishhtms/chap22.htm http://www.afs-soc.org/fishdb/fish_list.php
http://www.nanfa.org/articles/acswampdarter.shtml
Amarasinghe US, Welcomme RL. 2002. An analysis of fish species richness in natural lakes.
Environmental Biology of Fishes 65:327-339.
Appelberg M, Bergquist BC, Degerman E. 2000. Using fish to assess environmental disturbance of Swedish lakes and streams - a preliminary approach. Verhandlungen
der Internationalen Vereinigung fuer Limnologie 27:311-315.
Baker JR, Peck DV, Sutton DW (eds). 1997. Environmental Monitoring and Assessment
Program Surface Waters: Field Operations Manual for Lakes. U.S. Environmental
Protection Agency: Washington.
Balon EK. 1975. Reproductive guilds of fishes: a proposal and definition. Journal of the
Fisheries Research Board of Canada 32:821-864.
Baron JS, Poff NL, Angermeier PL, Dahm CN, Gleick PH, Hairston NG, Jackson RB, Johnston CA, Richter BD, Steinman AD. 2002. Meeting ecological and societal needs for freshwater. Ecological Applications 12:1247-1260.
Belpaire C, Smolders R, Auweele IV, Ercken D, Breine J, Van Thuyne G, Ollevier F. 2000. An Index of Biotic Integrity characterizing fish populations and the ecological quality of Flandrian water bodies. Hydrobiologia 434:17-33.
Bruslé J, Quignard JP. 2001. Biologie des poissons d'eau douce européens. Lavoisier Tec & Doc: Paris.
Corbacho C, Sanchez JM. 2001. Patterns of species richness and introduced species in native freshwater fish faunas of a mediterranean-type basin: The Guadiana River (southwest Iberian Peninsula). Regulated Rivers: Research & Management 17:699-707.
Dionne M, Karr JR. 1992. Ecological monitoring of fish assemblages in Tennessee River reservoirs. In Ecological indicators - Vol. 1, McKenzie DH, Hyatt DE, McDonald VJ (eds). Elsevier Applied Science: London; 259-281.
Dodson SI, Arnott SE, Cottingham KL. 2000. The relationship in lake communities between primary productivity and species richness. Ecology 81:2662-2679.
Drake MT, Pereira DL. 2002. Development of a fish-based index of biotic integrity for small inland lakes in central Minnesota. North American Journal of Fisheries Management 22:1105-1123.
Dudgeon D, Arthington AH, Gessner MO, Kawabata ZI, Knowler DJ, Leveque C, Naiman RJ, Prieur-Richard AH, Soto D, Stiassny MLJ, Sullivan CA. 2006. Freshwater biodiversity: importance, threats, status and conservation challenges. Biological
Reviews 81:163-182.
Fausch KD, Lyons J, Karr JR, Angermeier PL. 1990. Fish communities as indicators of environmental degradation. American Fisheries Society Symposium 8:123-144.
Gleick PH. 2003. Global freshwater resources: Soft-path solutions for the 21st century.
Science 302:1524-1528.
Goldstein RM, Simon TP. 1999. Toward a unified definition of guild structure for feeding ecology of North American freshwater fishes. In Assessing the sustainability and
biological integrity of water resource quality using fish communities, Simon TP (ed.)
CRC Press: Boca Raton, Florida; 123-202.
Halliwell DB, Langdon RW, Daniels RA, Kurtenbach JP, Jacobson RA. 1999. Classification of freshwater fish species of the northeastern United States for use in the development of indices of biological integrity, with regional applications. In Assessing the
sustainability and biological integrity of water resource quality using fish communities, Simon TP (ed.) CRC Press: Boca Raton, Florida; 301-333.
Hickman GD, McDonough TA. 1995. Assessing the reservoir fish assemblage index: A potential measure of reservoir quality. In Multidimensional approaches to reservoir
fisheries management, Miranda LE, DeVries DR (eds). American Fisheries Society:
Chattanooga, Tenessee; 85-97.
Hughes RM, Oberdorff T. 1999. Applications of IBI concepts and metrics to waters outside the United states and Canada. In Assessing the sustainability and biological integrity
of water resource quality using fish communities, Simon TP (ed.) CRC Press: Boca
Raton, Florida; 79-93.
Hughes RM, Whittier TR, Thiele SA, Pollard JE, Peck DV, Paulsen SG, McMullen D, Lazorchak J, Larsen DP, Kinney WL and others. 1992. Lake and stream indicators for the Unites States Environmental Protection Agency's environmental monitoring and assessment program. In Ecological indicators - Vol. 1, McKenzie DH, Hyatt DE, McDonald VJ (eds). Elsevier Applied Science: London; 305-335.
Ihaka R, Gentleman R. 1996. R: a language for data analysis and graphics. Journal of
Computational and Graphical Statistics 5:299-314.
Irz P, Argillier C, Oberdorff T. 2004. Native and introduced fish species richness in French lakes: local and regional influences. Global Ecology and Biogeography 13:335-344. Irz P, Michonneau F, Oberdorff T, Whittier TR, Lamouroux N, Mouillot D, Argillier C. In
press. Fish community comparisons along environmental gradients in lakes of France and Northeast USA. Global Ecology and Biogeography
Irz P, Michonneau F, Oberdorff T, Whittier TR, Lamouroux N, Mouillot D, Argillier C. In press. Fish community comparisons along environmental gradients in lakes of France and Northeast USA. Global Ecology and Biogeograph.
Jackson DA, Harvey HH. 1997. Qualitative and quantitative sampling of lake fish communities. Canadian Journal of Fisheries and Aquatic Sciences 54:2807-2813. Jackson RB, Carpenter SR, Dahm CN, McKnight DM, Naiman RJ, Postel SL, Running SW.
2001. Water in a changing world. Ecological Applications 11:1027-1045.
Jennings MJ, Fore LS, Karr JR. 1995. Biological monitoring of fish assemblages in Tennessee Valley reservoirs. Regulated Rivers: Research & Management 11:263-274. Jennings MJ, Lyons J, Emmons EE, Hatzenbeler GR, Bozek MA, Simonson TD, Beard TD,
Jr, Fago D. 1999. Toward the development of an index of biotic integrity for inland lakes in Wisconsin. In Assessing the sustainability and biological integrity of water
resource quality using fish communities, Simon TP (ed.) CRC Press: Boca Raton,
Florida; 541-562.
Karr JR. 1981. Assessment of biotic integrity using fish communities. Fisheries 6:21-27. Karr JR. 1991. Biological integrity: A long-neglected aspect of water resource management.
Ecological Applications 1:66-84.
Karr JR. 1999. Defining and measuring river health. Freshwater Biology 41:221-234.
Karr JR, Dudley DR. 1981. Ecological perspective on water quality goals. Environmental
Management 5:55-68.
Karr JR, Fausch KD, Angermeier PL, Yant PR, Schlosser IJ. 1986. Assessing biological integrity in running waters: a method and its rationale. Illinois Natural History Survey
Special Publications 5:28p.
Larsen DP, Stevens DL, Selle AR, Paulsen SG. 1991. Environmental monitoring and assessment program, EMAP-surface waters: a northeast lakes pilot. Lake and
Reservoir Management 7: 1-11.
Larsen DP, Thornton KW, Urquhart NS, Paulsen SG. 1994. The role of sample surveys for monitoring the condition of the nation's lakes. Environmental Monitoring and
Assessment 32:101-134.
Levin SA. 1992. The problem of pattern and scale in ecology. Ecology 73:1943-1967.
Lewis CA, Lester NP, Bradshaw AD, Fitzgibbon JE, Fuller K, Hakanson L, Richards C. 1996. Considerations of scale in habitat conservation and restoration. Canadian
Journal of Fisheries and Aquatic Sciences 53:440-445.
McDonough TA, Hickman GD. 1999. Reservoir Fishery Assessment Index development: a tool for assessing ecological health in Tennessee Valley Authority impoundments. In
Assessing the sustainability and biological integrity of water resource quality using fish communities, Simon TP (ed.) CRC Press: Boca Raton, Florida; 523-540.
Minns CK, Cairns VW, Randall RG, Moore JE. 1994. An Index of Biotic Integrity (Ibi) for fish assemblages in the littoral zone of Great Lakes areas of concern. Canadian
Journal of Fisheries and Aquatic Sciences 51:1804-1822.
Mittelbach GG, Steiner CF, Scheiner SM, Gross KL, Reynolds HL, Waide RB, Willig MR, Dodson SI, Gough L. 2001. What is the observed relationship between species richness and productivity? Ecology 82:2381-2396.
Oberdorff T, Pont D, Hugueny B, Porcher J-P. 2002. Development and validation of a fish-based index for the assessment of 'river health' in France. Freshwater Biology 47:1720-1734.
O'Neill RV. 1989. Perspectives in hierarchy and scale. In Perspectives in ecological theory, Roughgarden J, May RM, Levin SA (eds). Princeton University press: Princeton; 140-156.
Pont D, Hugueny B, Beier U, Goffaux D, Noble R, Rogers C, Roset N, Schmutz S. 2006. Assessing the biotic integrity of rivers at the continental scale: a European approch.
Journal of Applied Ecology 43:70-80.
Ricklefs RE, Schluter D. 1993. Species diversity: Regional and historical influences. In
Species diversity in ecological communities, Ricklefs RE, Schluter D (eds). The
University of Chicago Press: Chicago; 350-363.
Schulz EJ, Hoyer MV, Canfield DE, Jr. 1999. An Index of Biotic Integrity: A test with limnological and fish data from sixty Florida lakes. Transactions of the American
Fisheries Society 128:564-577.
Simon TP. 1999. Assessment of Balon's reproductive guilds with application to Midwestern North American freshwater fishes. In Assessing the sustainability and biological
integrity of water resource quality using fish communities, Simon TP (ed.) CRC Press:
Boca Raton, Florida; 97-121.
Smogor RA, Angermeier PL. 1999. Effects of drainage basin and anthropogenic disturbance on relations between stream size and IBI metrics in Virginia. In Assessing the
sustainability and biological integrity of water resource quality using fish communities, Simon TP (ed.) CRC Press: Boca Raton, Florida; 249-272.
Sokal R, Rohlf FJ. 1994. Biometry : the principles and practice of statistics in biological
research. W. H. Freeman and Co: New York.
Turner DP. 2005. Thinking at the global scale. Global Ecology and Biogeography 14:505-508.
Whittier TR. 1999. Development of IBI metrics for lakes in Southern New England. In
Assessing the sustainability and biological integrity of water resource quality using fish communities, Simon TP (ed.) CRC Press: Boca Raton, Florida; 563-584.
Whittier TR, Paulsen SG. 1992. The surface waters component of the Environmental Monitoring and Assessment Program (EMAP): an overview. Journal of Aquatic
Ecosystem Health 1:119-126
Whittier TR, Hughes RM. 1998. Evaluation of fish species tolerances to environmental stressors in lakes in the northeastern United States. North American Journal of
Whittier TR, Halliwell DB, Paulsen SG. 1997. Cyprinid distributions in Northeast USA lakes: evidence of regional-scale minnow biodiversity losses. Canadian Journal of Fisheries
& Aquatic Science 54:1593-1607.
Whittier TR, Hughes RM, Peck DV. 2001. Comment: Test of an index of biotic integrity.
Transactions of the American Fisheries Society 130:169-172.
Whittier TR, Larsen DP, Peterson SA, Kincaid TM. 2002. A comparison of impoundments and natural drainage lakes in the Northeast USA. Hydrobiologia 470:157-171.
Winemiller KO, Rose KA. 1992. Patterns of life-history diversification in North-American fishes - Implications for population regulation. Canadian Journal of Fisheries and
Legends
Table 1: Assignment of the fish species into trophic, reproductive (Repro.) and tolerance (Tol.) guilds. The codes refer to table 2 for the trophic and reproductive guilds. Tolerance guilds are from Halliwell et al. (1999). I: intolerant, MT: intermediate tolerance, T: tolerant.
Table 2: Correspondence between trophic and reproductive guilds and the modalities used to derive the metrics.
Table 3: Description of the fish metrics.
Table 4: Environmental and anthropogenic variables included in the analysis with basic statistical descriptions of their distributions.
Table 5: Principal Components Analysis carried out on the environmental variables. Table entries are the variables scores on the first three axis of the PCA. Those loading most heavily on each PC are in bold.
Table 6: Regression of fish metrics (arcsine X transformed) against the anthropogenic variables. Table entries are regression coefficients, F statistic and model significance.
Table 7: Regression of fish metrics (arcsine X transformed) against the environmental and anthropogenic variables. Table entries are regression coefficients, F statistic, model significance level and variance partitioning; var env [c] is the percentage of the total variation attributable to pure environmental effects, var ant [a] to pure anthropogenic effects, var com [b] combined between anthropogenic and environmental effects and unexpl [d] variation unexplained by the model.
Figure 1: Partition of the variation of a bioassessment metric into four components. [a] exclusively anthropogenic, [b] combined between anthropogenic and environmental, [c] exclusively environmental and [d] unexplained. Adapted from Legendre and Legendre (1998).
Table 1 Species Trophic guild Repro. guild Tol. guild Species Trophic guild Repro. guild Tol. guild Alosa pseudoharengus KI A.1.4 + Diad MT Margariscus margarita GF A.1.3 MT Ambloplites rupestris IC B.2.2 MT Micropterus dolomieu TC B.2.2 MT Ameiurus natalis GF B.2.7 T Micropterus salmoides IC B.2.2 MT Ameiurus nebulosus GF B.2.7 T Morone americana IC A.1.4 + Diad MT
Amia calva TC B.2.5 T Moxostoma
macrolepidotum
BI A.1.3 MT
Anguilla rostrata IC A.1.1 + Diad T Moxostoma valenciennesi BI A.1.3 I Aplodinotus grunniens GF A.1.1 MT Notemigonus crysoleucas GF A.1.5 5
Carassius auratus BI A.1.5 T Notropis bifrenatus CI A.1.5 I
Carpoides cyprinus GF A.1.2 T Notropis heterodon CI A.1.5 I
Catostomus catostomus BI A.1.2 I Notropis heterolepis BI A.1.5 I Catostomus commersoni GF A.1.2 T Notropis hudsonius BI A.1.2 MT Coregonus artedi KI A.1.1 + Diad I Notropis volucellus GF A.1.5 MT Coregonus clupeaformis BI A.1.2 + Diad I Noturus gyrinus BI B.2.7 MT
Cottus cognatus BI B.2.7 I Noturus insignis BI B.2.7 MT
Couesius plumbeus IC A.1.2 MT Oncorhynchus mykiss IC A.2.3 I Culaea inconstans CI B.2.4 I Osmerus mordax IC A.1.2 + Diad I
Cyprinus carpio GF A.1.4 T Percina caprodes BI A.2.3 MT
Cyprinella spiloptera CI A.2.4 T Perca flavescens IC A.1.4 MT Dorosoma cepedianum KH A.1.2 T Percopsis omiscomaycus CI A.1.3 MT
Erimyzon oblongus GF A.1.2 I Phoxinus eos GF A.1.5 MT
Esox lucius TC A.1.5 I Phoxinus neogaeus IN A.1.4 MT
Esox niger TC A.1.5 MT Pimephales notatus GF B.2.7 T
Etheostoma fusiforme BI A.1.5 I Pimephales promelas GF B.2.7 T Etheostoma olmstedi BI B.2.7 MT Pomoxis nigromaculatus IC B.2.5 MT Exoglossum maxillingua BI B.2.3 I Pungitius pungitius CI B.2.4 + Diad MT
Fundulus diaphanus CI A.1.5 T Rhinichthys atratulus BI A.1.2 T Gasterosteus aculeatus CI B.2.4 + Diad MT Rhinichthys cataractae BI A.1.2 MT Hybognathus regius BH A.1.4 I Salmo salar IC A.2.3 + Diad I Ictalurus punctatus IC B.2.7 MT Salmo trutta IC A.2.3 + Diad I Labidesthes sicculus CI A.1.4 I Salvelinus alpinus IC A.2.3 + Diad I Lepisosteus osseus TC A.1.4 MT Salvelinus fontinalis CI A.2.3 + Diad I Lepomis auritus CI B.2.3 MT Salvelinus namaycush IC A.2.3 I Lepomis gibbosus IC B.2.2 MT Scardinius
erythrophthalmus
GF A.1.4 T Lepomis macrochirus GF B.2.2 T Semotilus atromaculatus IC A.2.3 T Lepomis microlophus BI B.2.2 MT Semotilus corporalis IC A.2.3 MT
Lota lota BI A.1.2 MT Sander vitreus TC A.1.2 MT
Table 2 Guild Description Piscivore Invertiv o re Om niv o re B ent hi c fe ede r Gua rder Li tho-p sammoph ilo us Phy to-ph ilou s Diad ro mo us BH benthic herbivore 0 0 0 1 BI benthic invertivore 0 1 0 1
CI water column invertivore 0 1 0 0
GF generalist feeder (omnivore) 0 0 1 0
IC invertivore/piscivore 1 1 0 0
IN invertivore 0 1 0 0
KH filter feeding herbivores 0 0 0 0
KI filter feeding invertivore 0 1 0 0
TC top carnivore (piscivore) 1 0 0 0
A.1.1 Nonguarders - Open substratum spawners - Pelagophils 0 0 0
A.1.2 Nonguarders - Open substratum spawners - Lithopelagophils 0 1 0
A.1.3 Nonguarders - Open substratum spawners - Lithophils 0 1 0
A.1.4 Nonguarders - Open substratum spawners - Phytolithophils 0 1 1
A.1.5 Nonguarders - Open substratum spawners - Phytophils 0 0 1
A.2.3 Nonguarders - Brood hiders - Lithophils 0 1 0
A.2.4 Nonguarders - Brood hiders - Speleophils 0 1 0
B.1.4 Guarders - Substratum choosers - Phytophils 1 0 1
B.2.2 Guarders - Nest spawners - Polyphils 1 1 1
B.2.3 Guarders - Nest spawners - Lithophils 1 1 0
B.2.4 Guarders - Nest spawners - Ariadnophils 1 1 1
B.2.5 Guarders - Nest spawners - Phytophils 1 0 1
B.2.7 Guarders - Nest spawners - Speleophils 1 1 0
C.1.4 Bearers - External bearers - Gill-chamber brooders 1 0 0
Table 3
Metric name Description
SpRichness Number of species in the sample
%_LithPsam Percentage of lithophilous or psammophilous species %_Phyto Percentage of phytophilous species
%_Guarder Percentage of nest guarder species
%_Diad Percentage of long-range diadromous species %_Pisc Percentage of piscivorous species
%_Inv Percentage of invertivorous species %_Omn Percentage of omnivorous species %_Benth Percentage of benthivorous species
%_Tol Percentage of species tolerant to environmental variations %_Intol Percentage of species intolerant to environmental variations
Table 4
Variable Description Min. – Max. Median
AREA_WS Area of the catchment (ha) 31 – 792100 1564
AV_DEP Estimated mean depth (m) 0.5 – 21.8 4.6
ELEV Lake altitude (m) 16 – 569 247
HI_PT High point of catchment (m) 81 – 1483 279
KM_SEA Distance from the ocean (km) 6 – 330 139
LKVOL2M3 Estimated lake volume (m3) 16410 – 5.42 108 2689000
LK_HA Lake surface area (ha) 3 – 3306 64
LTROFF_M Long-term average annual runoff (m) 0.34 – 0.77 0.61
PRECIP_M Long-term average precipitation (m) 0.80 – 1.28 1.09
RETENT Estimated water retention time for lakes (years) 0.01 – 5.60 0.40 Environmental
variables
SHR_LTH Length of shoreline including islands (m) 748 – 111500 6317
URB_TOT % catchment urban (nonresidential + residential) 0 – 37.8 0
urbanisation HOUDENKM Housing unit density (housing/km²) 0 – 120.2 2.6
variables POPDENKM Population density (persons/km²) 0 – 310.2 2.5
RD_DEN Road density (m/ha) 0 – 54.6 8.8
Anthropogenic variables
Table 5
env1 env2 env3
Inertia 41% 26% 13% AREA_WS 0.80 -0.01 -0.38 AV_DEP 0.78 -0.04 0.14 ELEV 0.04 0.85 0.46 HI_PT 0.42 0.79 0.27 KM_SEA 0.17 0.91 0.14 LKVOL2M3 0.99 -0.10 -0.05 LK_HA 0.95 -0.10 -0.14 LTROFF_M 0.16 -0.50 0.63 PRECIP_M 0.01 -0.64 0.60 RETENT 0.53 -0.14 0.39 SHR_LTH 0.92 -0.14 -0.10
Table 6
Metric intercept Urb_PCA AG_TOT F sig.
%_Phyto 0.836*** 0.068*** -0.105 16.5 <0.001 %_Guarder 0.598*** 0.085*** -0.074 29.8 <0.001 %_Diad 0.298*** -0.028* 0.129 2.4 0.095 %_LithPsam 1.077*** -0.013 -0.056 1.9 0.151 %_Pisc 0.769*** 0.063*** -0.154 10.9 <0.001 %_Inv 0.857*** -0.003 -0.105 1.4 0.239 %_Omn 0.613*** -0.019* 0.047 2.8 0.065 %_Benth 0.134*** -0.016 0.008 1.2 0.302 %_Tol 0.643*** 0.005 -0.006 0.2 -0.836 %_Intol 0.287*** -0.042*** 0.109 5.1 0.007 SpRichness 2.184*** 0.038 0.233 3.1 0.051
Table 7
Metric intercept Urb_PCA AG_TOT env1 env2 env3 F sig. var env
[c] var ant [a] var com [b] Unexpl [d]
Env.PCs Size Altitude Runoff
interpretation Dist. Sea Precipitation
N=112 %_Phyto 0.841*** 0.058*** -0.150 -0.032*** -0.013 -0.04* 11.5 <0.001 12.05 13.34 9.87 64.74 %_Guarder 0.600*** 0.087*** -0.089 0.007 0.005 -0.003 11.8 <0.001 0.44 29.94 5.42 64.20 %_Diad 0.284*** -0.049*** 0.217* 0.030** -0.058*** 0.018 9.5 <0.001 26.69 11.05 -6.83 69.09 %_LithPsam 1.08*** 0.005 -0.078 0.032*** 0.035*** 0.019 10.7 <0.001 30.04 0.75 2.66 66.55 %_Pisc 0.767*** 0.052** -0.141 0.025* -0.03* -0.006 6.9 <0.001 7.93 9.15 7.50 75.41 %_Inv 0.854*** -0.004 -0.083 0.028 -0.01 0.013 5.7 <0.001 18.59 1.72 0.87 78.82 %_Omn 0.616*** -0.015 0.025 -0.028*** 0.015* -0.009 7.4 <0.001 20.87 2.52 2.37 74.24 %_Benth 0.136*** -0.005 -0.006 0.034*** 0.019 0.013 5.2 <0.001 17.60 0.22 1.95 80.23 %_Tol 0.639*** -0.003 0.021 -0.015* -0.018 -0.001 1.8 0.111 7.67 0.11 0.22 92.00 %_Intol 0.282*** -0.027 0.149 0.03* 0.027* 0.046* 6.3 <0.001 14.36 3.10 5.54 77.01 SpRichness 2.21*** 0.035 0.029 0.136*** -0.014 -0.084** 26.8 <0.001 50.48 1.88 3.45 44.19
Variation in bioassessment metric (100%)
Explained by ant Unexplained
variation
Explained by env
[a] [b] [c] [d]
Variation in bioassessment metric (100%)
Explained by ant Unexplained
variation
Explained by env
[a] [b] [c] [d]