HAL Id: hal-00510659
https://hal.archives-ouvertes.fr/hal-00510659
Submitted on 20 Aug 2010HAL is a multi-disciplinary open access archive for the deposit and dissemination of sci-entific research documents, whether they are pub-lished or not. The documents may come from teaching and research institutions in France or abroad, or from public or private research centers.
L’archive ouverte pluridisciplinaire HAL, est destinée au dépôt et à la diffusion de documents scientifiques de niveau recherche, publiés ou non, émanant des établissements d’enseignement et de recherche français ou étrangers, des laboratoires publics ou privés.
Step interactions on Pt(111) vicinal surfaces determined
by grazing incidence x-ray diffraction: influence of the
step orientation
Geoffroy Prévot, Luc Barbier, Paul Steadman
To cite this version:
Geoffroy Prévot, Luc Barbier, Paul Steadman. Step interactions on Pt(111) vicinal surfaces de-termined by grazing incidence x-ray diffraction: influence of the step orientation. Surface Science, Elsevier, 2010, 604, pp.1265-1272. �10.1016/j.susc.2010.04.012�. �hal-00510659�
Step interactions on Pt(111) vicinal surfaces determined by grazing incidence x-ray diffraction: influence of the step orientation
G. Prévot
Institut des NanoSciences de Paris, UMR CNRS 7588, Université Pierre et Marie Curie-Paris 6, 140, rue de Lourmel, 75015 Paris, France
L. Barbier
DSM/IRAMIS/SPCSI, CEA-Saclay, 91191 Gif-sur-Yvette Cedex, France
P. Steadman
Diamond Light Source Ltd., Harwell Science and Innovation Campus, Didcot, Oxfordshire OX11 0DE, United Kingdom
Abstract
We have studied the step-step interactions on the Pt(997) vicinal surface. Grazing incidence X-ray diffraction (GIXD) allowed us to measure the elastic atomic relaxations near the surface due to the steps. By means of the model of buried elastic dipoles, within the framework of anisotropic linear elasticity (ALE) calculations, the surface stress of Pt(111), and the elastic interaction between steps are deduced. The values so-obtained are compared to the values previously measured on the Pt(779) surface with the same technique. The comparison shows the strong influence of step geometry on step interactions.
1. Introduction
Among vicinal surfaces of transition and noble metals, (111) platinum vicinal surfaces have attracted a considerable interest. In particular, due to the high regularity achieved by the array of monoatomic steps obtained when cutting a Pt crystal a few degrees from the (111)
direction, such surfaces have been used as nucleation centers for the guided growth of metallic nanowires [1,2,3]. The specific properties of Pt steps have also been enlightened in numerous catalysis studies [4,5,6]. Beside this technological interest, fundamental properties of platinum stepped surfaces (atomic relaxations, thermodynamics...) have been investigated by various experimental techniques such as scanning tunneling microscopy (STM) [7,8,9,10], low energy electron microscopy (LEEM)[11,12], and grazing incidence X-Ray diffraction (GIXD) [13, 14]. Theoretical investigations have also been performed using semi-empirical potentials [15], tight-binding (TB) approximation [16], embedded atom method (EAM) [17] or density functional theory (DFT) [16,18,19,20].
As compared for example with similar copper surfaces for which numerous studies were performed [21,22], there is still little data available on the energetics of Pt (111) vicinal surfaces. Concerning the relative energy of steps, STM experiments [7] have first shown that the free energy of steps with {111} microfacet orientation was 13% lower than the free energy of steps with {100} orientation. This was confirmed by recent STM analysis of the shape fluctuations of 2D-islands on Pt(111), giving step energies
β
A =0.348 ± 0.016 eV for {100} steps andβ
B =0.300 ± 0.014 eV for {111} steps. On the theoretical side, the first calculations have determined a nearly equal value of the step energy:β
A =β
B =0.34eV/atom, using EAM [17], or
β
B =0.47 eV/atom for {111} steps andβ
A =0.46 eV/atom for{100} steps using DFT [18]. However, more recent DFT calculations succeeded in reproducing the experimental anisotropy observed:
β
A =0.40 eV/at andβ
B =0.35 eV/at (β
B /β
A =0.88) [19], orβ
A =0.43 eV/at andβ
B =0.38 eV/at (β
B /β
A =0.88) [20].The magnitude of the A constant for the A/ d2 elastic interaction between steps was more controversial. From the STM measurement of the terrace width distribution on Pt(997), a surface with (111) terraces and {111} steps, a first value of the interaction energy constant of
=
analysis to the value of A=6 eV.Å [24]. In contrast, a value of only 0.5 eV.Å [14] for the elastic interaction energy between steps has been determined from the GIXD measurement of elastic relaxations on Pt(977), a surface with (111) terraces and {100} steps. Since it is generally assumed that the major contribution to the step interaction comes from elastic interaction [14,25], the difference between the two sets of measurements, by GIXD for {100} type steps and from the TWD measurement for {111} steps, cannot be attributed to the influence of other interactions, not accessible by GIXD, such as electronic interactions or electrostatic interactions between steps. It is at first surprising to find such a huge difference on the A value between these step orientations on Pt(111) vicinal surfaces, whereas the step formation energies
β
A andβ
Bare found to be very similar.These differences give rise to suspicion that something was misunderstood or that other effects remain to be discovered in our understanding of vicinal surfaces, thus casting doubt on all the theories developed to model these systems. Thus some effort has to be made to answer the question of the origin of the difference observed between {111} and {100} steps on Pt(111) vicinals: we have studied by GIXD the atomic relaxations near the surface of Pt(997) and compared the results with those obtained by the same technique on Pt(779). The paper is organized as follows. The experiment is described in Section 2. The results are analyzed in detail in Section 3 in the frame of the buried dipole model. We show that a quantitative value of the step interaction energy can be derived from the measurements or from the calculation of the atomic displacements. Section 4 is devoted to a general discussion and to the conclusion.
2. Experimental
GIXD experiments were performed on the ID3 beamline at the ESRF storage ring. The sample was a disk of 1 cm diameter, with one side polished and oriented along the (997) direction. The sample was positioned and prepared inside an ultrahigh vacuum chamber that was coupled to a six-axis diffractometer. Sample cleaning was achieved by cycles of Ar sputtering at 2 kV for 2 h at a pressure of 7.10-5 mbar, followed by heating during 5 min at
650°C under 5.10-7 mbar O2 and final annealing during 2 min at 850°C under UHV. After
several cycles of sputtering and annealing, no carbon nor oxygen contaminations could be detected by Auger electron spectroscopy.
2.2 Sample geometry
The Pt(997) surface consists of (111) terraces, separated by [110] steps. The number of ]
0 1 1
[ atomic rows in a terrace is equal to 9. The intra-row distance, i. e. the distance between two consecutive atoms along the step edge is a0 / 2, where a0 =3.92 Å is the lattice constant of Pt. The inter-row distance is d0 =a0 3/8, and the interstep distance is
=
d a0 1883/72=20.1 Å. A schematic of the surface is given in Fig. 1. The miscut angle,
i.e. the angle between (111) and (997) is θ =6.45°.
To define the basis for surface coordinates, we have used the orthogonal vectors
− − = 18 7 7 2 1 ar , − = 0 1 1 2 1 b r , and = 7 9 9
cr . c r is normal to the surface and b r
is oriented along the step edge.
The corresponding h , k , and l indices are used for indexing a reflection in reciprocal space. The reciprocal-space transformation from the surface coordinate ( hkl ) to the standard fcc coordinates ( HKL ) is given by:
− − − = l k h L K H 7 0 18 9 211 7 9 211 7 211 1 2.3 GIXD measurements
For GIXD measurements, monochromatic X-rays with a photon energy of 17 keV were selected by using a Si(111) monochromator. The incidence angle was kept fixed at 1° of the (997) surface. The scattered X-rays were detected using a NaI scintillation counter. Fluorescence was eliminated by use of an analyzer crystal mounted before the detector. 209 structure factors Fobs were acquired by performing standard rocking scans along 5 crystal truncation rods (CTR): (0 2 l ), (32 0 l ), (34 0 l ), (36 0 l ), and (38 0 l ). For (0 2 l ), only the atomic relaxations along z contribute to the shape of the rod (there is not any relaxations along y for symmetry reasons). For the other rods, the atomic relaxations along x are
dominant for small l values.
Voigt curves were used for integration of the profile of the rocking scans and deriving the diffracted intensity. The standard instrumental correction was applied to the structure factors for taking into account the geometry of the diffractometer.
2.4 Raw experimental results
Fig. 2 displays a map in the reciprocal space of the diffracted intensity around the (34 0 L ) rod. Two Bragg spots are visible, at l =lBragg =3 on the (34 0 l ) rod and at
=
Bragg
l 28 on the (36 0 l ) rod. They correspond to maxima of intensity, for which all atoms of
the crystal diffract in-phase. Along a CTR, when going away from the Bragg peak, the variation of amplitude is not a monotonous decrease. Minima and maxima of the diffracted intensity are clearly visible.
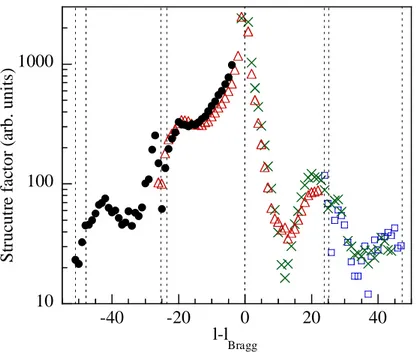
In Fig. 3, all data points are presented as a function of the momentum transfer l~ along l
with respect to the value corresponding to the nearest Bragg spot: ~l =l−lBragg. As can be seen, sharp intensity variations occur for all rods at the same relative position l~. For
example, along the (34 0 l ) and (36 0 l ) rods, the diffracted intensity has a minimum at
≈
l
~
12; along the (32 0 l ) and (34 0 l ) rods, the diffracted intensity has a minimum at l~≈34. Apart from these minima, very sharp variations of the structure factors are clearly visible, for example, around at l~≈-25 for the (38 0 l ) rod or at ~l ≈25 for the (32 0 l ) rod. These abrupt variations occur in a very narrow domain of l values. They are thus related in real space to slowly varying atomic displacements extending deep into the bulk of the crystal. As has been pointed out previously [26], they are related to the elastic displacements due to atomic relaxations near the step edge; they will be now discussed in detail.
It is also worth noting that the width of the CTRs varies slowly with l, allowing measurement of the rod intensities far from the Bragg peaks. This is the first indication that the steps are well ordered and that the surface may be below its roughening transition.
3. Analysis
3.1 Elastic modes and diffraction spectrum 3.1.1 Elastic modes
The variations of the diffracted intensity for a stepped surface is associated with the elastic relaxation modes near the surface of the crystal [26]. Atomic relaxations for atoms in the vicinity of the step edge occur due to the change in the number and symmetry of neighbouring atoms, and to the modification of the local electronic density of states near the steps. Since the steps form a periodic network of straight lines at the surface of the crystal, the elastic displacements at the surface can be written in a Fourier series:
( )
∑
∞ −∞ = = p x ipq p U x u( ) 0 exp( 0 ) r r with d q0 = 2π (1)where d is the interstep distance and p is an integer. pq is thus multiple of the reciprocal 0
unit vector in the x direction (parallel to the surface and perpendicular to the step). In our
case, there is no dependence of ur with y (direction parallel to the step) due to symmetry reasons. The periodic surface relaxations propagate elastically into the bulk and the displacements of bulk atoms keep the surface periodicity, with depth dependant phase and amplitude:
( )
∑ ∑
∞ −∞ = = n p npq z ipq x i p n u z x u( , ) 0 , exp(κ
0 )exp( 0 ) r r (2)where, for each mode considered,
κ
n is a complex numbers that reflects the crystal anisotropy (see below) and determines the phase and amplitude variation of ur with depth. We have( )
=∑
( )
n p n u p U0 r0 , r. Eq. (2) can be rewritten in a more concise way:
( )
∑ ∑
∞ −∞ = = n p p n r q i p n u r u( ) 0 , exp( , ) r r r r r (3) where = 0 , 0 pq pq q n o p nκ
r and = z y xrr . According to the continuous model, the evaluation of
the elastic relaxations at each atomic position gives the discrete atomic relaxations uN
r
. The elastic modes have been studied by Croset and Prévot [27,28] for surfaces of cubic crystal with dense steps. This applies in the present case since Pt is a fcc crystal and since steps on Pt(997) runs along the
[ ]
110 direction. In the frame of anisotropic linear elasticity, it is shown thatκ
n are given by the resolution of a 6th
order secular equation, with coefficient depending only on the elastic constants of the crystal and of the orientation of the surface. In the case where (x0 ) is a plane of symmetry, the secular equation reduces to a 4z th order
equation in which solutions are complex numbers. Their real part gives the propagation direction for each elastic mode, whereas the imaginary part gives the z attenuation. In the case of an isotropic crystal one obtains Im(κ)=−1. For Pt(997), the values found for κ are
i 458 . 1 465 . 0 1 =− −
κ
,κ
2 =0.172−0.613i,κ
3 =−0.465+1.458i, andκ
4 =0.172+0.613i. 3κ
andκ
4 have a positive imaginary part; since z<0 in the bulk, the corresponding modes diverge in the bulk, and must be rejected.Thus, the atomic relaxations in the bulk depend on the values of the only two first elastic modes. The first mode propagate along a direction close to [110], and decays rapidly into the bulk. The attenuation length of the pth harmonic is given by pd/(2
π
Im(κ
1)), giving 2.2 Å only, for the first harmonic. The second elastic mode propagate along a direction close to] 1 1 1
[ and decays more slowly into the bulk, and the attenuation length for the first harmonic
is 5.2 Å. For each mode, the real part of
κ
defines the very same variation of the phase with depth for all Fourier components. This defines specific directions that reflect the elastic anisotropy of the medium. Due to the large attenuation length of elastic modes, the relaxations of many non equivalent atoms (around 20 atoms for such a depth) have thus to be taken into account in order to fit correctly the GIXD results. However, since these relaxations are not independant, the number of free parameters for the fitting procedure is restricted.3.1.2 Diffraction spectrum
A first order expansion of the expression of the diffracted amplitude allows us to easily interpret the GIXD results [26]:
( )
[
(
)
]
( )
[
( )
]
( )
[
[
]
]
− + ≈ + =∑ ∑
∑
∑
∞ −∞ = n N p N p n N N N N N r q q i p n u r q i q A u r q i q A q A , , 0 0 0 exp , exp exp ) ( v r r r v r r v r (4)where the sum runs over all the atoms n of the crystal with unrelaxed position rn
v
. According to the second term, each harmonic of each mode corresponds to new diffraction satellites in addition to the Bragg spots. The positions of the satellites with respect to the Bragg spots are given by Re(qrn, p). Along the x direction ( h index), qx = pq0 that is the periodicity of the array of CTR. The diffraction satellites are thus located on the crystal truncation rods. Along the l index direction, the position of these satellites on a rod is given by
[
]
0Bragg cotan Re( ) pq
l + θ − κn , where lBragg is the position of the Bragg spot considered, and
θ
cotan
0
q is the distance along the l direction between the Bragg spots of two consecutive rods.
The interferences between the amplitude associated with the diffraction satellites and the fundamental of the rod determine the shape of the sharp variations that are observed on the rods, whereas the full width at half maximum of the diffraction satellites along l is
) Im(
3 −qz (sharper is the intensity modulation for slower attenuation in the bulk). Let us consider the first positive harmonic q0 of the elastic displacements. For Pt(997), using our system of reduced units, q0cotan
θ
=25. The satellite associated with the first elastic mode appears at a distance ∆l1 =23.7 from the Bragg spot, with a width w1 =7.1, whereas thesatellite associated with the second elastic mode appears thus at ∆l2 =25.5 with a narrower width w2 =3. The interferences of these satellites with the fundamental of the rods are clearly experimentally observed as shown in Fig. 3. The positions of the satellites associated with these modes are indicated by dotted lines in Fig. 3.
3.2 Model for surface relaxation and atomic displacements
Atomic displacements due to step relaxations have been shown to be the same as elastic displacements due to lines of force dipoles applied on a flat continuous interface, with the
same periodicity as the steps [29,28]. Using Hooke's law and mechanical equilibrium at the surface and in the bulk, it is possible to derive analytically the elastic displacements due to such dipoles. For this purpose, one generally assumes that the lines have a lorentzian shape in the xdirection [27,28].
However, for a given vicinal surface, the dipole orientation, the position with respect to the step edge and the lever arm orientation of the dipoles are a priori unknown. These parameters can be adjusted to reproduce the relaxations given by numerical simulations. This has been performed for vicinal surfaces of transition metals, using a model with semi-empirical potentials derived from tight binding considerations [15]. However, the comparison with GIXD experimental results for Cu and Pt vicinals [14,25] shows that the predicted displacements (from the tight binding model) are approximately half the value of the ones obtained by a fit of the experimental data. This indicates that such semi-empirical potentials hardly reproduce the finest details of surface relaxations. The real dipole parameters are better obtained via a direct fit of the GIXD results, by the analytical calculations of the elastic displacements.
We proceed in that way for analyzing our GIXD data and the measured diffracted intensities are fitted by adjusting only 9 free parameters: the positions x and 0 z of the lines 0
of dipoles with respect to the step edge, the width a of the lorentzian shape, the lever arm c orientation of the dipoles Ω, the two components of the dipole: the stretch component p S and the torque component pT, a step roughness factor β and the mean relaxation of the two
first terrace planes, dz1 and dz2. No Debye-Waller factors have been used, and the atomic
positions only depend on the parameters listed above.
In our calculation, the roughness is taken into account in the frame of the model of Robinson [30]. In this model, suitable for a weakly rough surface, each plane above the reference surface is characterized by a fractional occupancy p(n), which is the probability of
finding an atom in the nth plane. In the model of Robinson, p(n) follows an exponential
attenuation: p(n)=
ξ
n. ξ =0 for an ideal surface and ξ =1 for a surface above the roughening transition (where all planes are equiprobable and no reference plane could be defined anymore). The diffracted amplitude measured is then attenuated by a factor:(
)
) / ) ( 2 cos( 2 1 1 Bragg 2 2 rough l l l F ∆ − − + − = π ξ ξ ξ (5)where lBragg is the position of a Bragg spot along the rod and where ∆l is the distance between two consecutive Bragg spots along a rod (in our case, i.e. using surface coordinates
)
(hkl described in section 2.2, l∆ =211).
The fit is performed by means of a mapping of the parameter space (nine free parameters), combined with the Levenberg-Marquardt method [31]. A good fit of the experimen,tal structure factors is obtained with the elastic dipole intensities pS=2.3±0.2 nN and
T
p =1.1±0.1 nN. The corresponding R-factor [32] computed is
15 . 0 obs calc obs − = =
∑
F F∑
FR , where Fobs and Fcalc are respectively the measured and
simulated structure factors.
The roughness factor used for this fit, β=0.59±0.08, is small, considering the fact that the terraces have a large width of 9 atomic rows. This shows that the surface is well below its Kosterlitz-Thouless roughening transition. Due to surface roughness, the maximum attenuation of the measured structure factors, in our measurements, is equal to 0.4. In Fig. 4 is displayed the comparison between measured and simulated structure factors, using atomic positions from the continuous elastic model. The different parameters of the dipole used are given in Table 1, whereas a scheme of the dipole is drawn in the top right corner of Fig. 4. The corresponding elastic displacements are drawn in Fig. 5. The displacements depend mainly on the lever arm orientation Ω and on the p values (pS and pT). The relaxation of
the two first terrace planes, dz1 and dz2 appear as negligible, and could be fixed to 0 without
changing the quality of the fit. As it is displayed in Fig. 5, one observes along the
[ ]
112 axis both an oscillatory behavior of the relaxations when x varies and its decay with z . Near thesurface the mean displacements are higher in the x direction than in the z direction. In the
bulk, the opposite is true. This shows the opposite effects of the two different modes responsible of the elastic displacements: near the surface, both modes contribute to the atomic displacements, whereas deep into the bulk, the first mode becomes negligible. The step edge and corner atoms relax in an opposite direction, in the way of a "smoothing" of the step edge.
3.3 Surface stress
It is interesting to have a precise measure of pT since its value can be directly related to
the surface stress of the nominal surface τPt(111) through the relation:
Pt(111)
Stepτ
h
pT = (6)
where hStep =a0/ 3 =2.26Å is the step height. This equation, first stated by Marchenko and Parshin [29], has been shown to be a good approximation for various vicinal surfaces [15]. Reversing Eq. (6), one obtains τPt(111) =4.9 Nm-1 for pT=1.1±0.1 nN as determined in this study.
Experimentally, it is very difficult to measure the surface stress. However, ab initio calculations provide today accurate surface parameters for dense surfaces. Theoretical values
of τPt(111) have been derived in that way: Feibelman, within the local density approximation,
has obtained τPt(111) = 6.3 Nm-1 [18]. Needs and coworkers, with a similar technique, have obtained τPt(111) = 5.6 Nm-1 [33]. Note that the value we obtain (4.9 Nm-1) is in the same range of magnitude as these theoretical predictions, although slightly lower. It is closer to the
value τPt(111) =4.1 Nm-1 found from similar GIXD measurements of the elastic dipole density on Pt(779) [14].
Pt(997) and Pt(779) experimental dipole values may be further compared since both surfaces have the same terrace orientation, namely (111). They differ only by their step orientation and the step microfacets have respectively the {100} and (111) orientations. Since the surface stress of dense terraces is isotropic, the value pT =hStepτPt(111) should not depend
on the step orientation. In a first attempt, the GIXD experimental data on Pt(779) [13] were interpreted by means of a Green function numerically computed from semi-empirical potentials derived from tight-binding considerations, where the force distribution considered was a dipole applied to the step edge and step corner atoms [14]. A surface stress value
=
Pt(111)
τ 4.1 Nm-1 was found. In order to have a direct comparison between Pt(997) and
Pt(779), the measured structure factors have been fitted again, but with the present analytical buried dipole model. The result is indicated in the right column of Table 1, and remains close to the early one. The torque dipole density pT =0.82 nN is only slightly lower, giving a lower estimate of the surface stress: τPt(111) =3.6 Nm
-1
. Thus, the analysis, within the same model, of the GIXD results gives values of the torque dipole (4.9 and 3.6 Nm-1) that slightly depends on
the step orientation. The fact that, within the same model, the value of the torque dipole that fits the GIXD results depends on the step orientation demonstrates either that Eq. (6) is only an approximate, or the dipole determined does not exactly reflects the force distribution applied at the step edge.
Let us recall that if the elastic displacements are directly determined by fitting the experimental structure factors, the force distribution is derived assuming three main assumptions:
- standard linear elasticity is valid;
- the elastic constants are the same everywhere within the bulk, up to the surface.
In fact, the linear elasticity calculations do not take into account modifications of the elastic constants near the surface and more especially near step edges. Actually, it is shown through a model with suitable manybody interaction potentials that a stiffening of some elastic constants occurs near steps of vicinal surfaces of transition metals [34]. Such an effect would reduce the atomic displacements for one given applied force. By using bulk elastic constants for the elastic calculations, one neglects this effect, and the fit of the atomic displacements gives an undervalue of the dipole density.
Another alternative may be that the experimental pT value would be slightly
underestimated due to step disorder. As pointed out in [26], thermal step disorder reduces the contribution of integer-order harmonics in the Fourier decomposition of the elastic displacements, leading to a decrease of the amplitude of the satellite associated with the elastic mode considered. However, such an attenuation is here well taken into account by means of the Robinson model for surface roughness (see Eq. (5)).
3.4 Step-step elastic interactions
The elastic interaction energy between two straight steps can be obtained from the value of the elastic dipoles experimentally measured. The interaction energy
β
Int between two force dipoles is inversely proportional to the square of the step-step distance [29]: βint(θ)= A/d2.The total free energy β of a regular array of steps is thus the sum of the isolated step formation energy β0 and this step-step interaction:
2 0 2 0 2 2 0 ) / ( 6 d d E d A + = + =β π β β (7)
The coefficient A depends on the elastic constants of the substrate, and on the characteristics of the dipoles (lever arm orientation, stretch and torque component). It can be
analytically computed [27]. In particular, A depends quadratically on p , with a prefactor depending on the lever arm orientation Ω and on the orientation ϕ of the forces acting on the lever arm.
Using the values of the elastic dipoles determined by GIXD for Pt(997), and equations given in ref. [27], one finds E2 =1100±200 meV/atom, where “per atom” means per interatomic distance along the step edge, which is equal to a0/ 2 in our case. This
corresponds to a value A=1.4 eV.Å. Applying the very same calculation for Pt(779), a much lower value is obtained: E2 =360±200 meV/atom (A=460 meV.Å). Note that this last value is well consistent with the one derived in ref. [14] for the same surface. There is thus a factor of three between the elastic interactions between steps on Pt(997) and on Pt(779). This difference does not only result from the difference in the component p and S pT of the
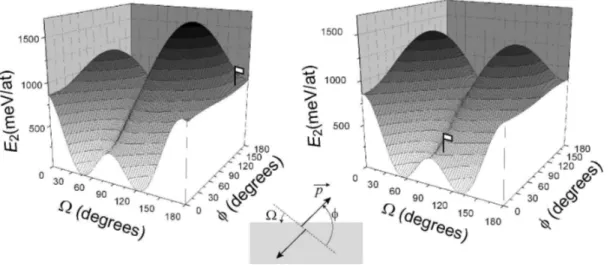
dipoles, that are respectively 10% and 35% higher in absolute value for Pt(997) than for Pt(779). Both the dipole lever arm orientation Ω and the orientation ϕ of the forces acting on the lever arm play a role. In order to illustrate the weight of these parameters, the evolution of
) , (
2 Ω
ϕ
E versus Ω and ϕ is drawn in Fig. 6 for Pt(997) and Pt (779), with the same dipole
density p=2.4 nN, that is the mean of the Pt(997) ( p=2.55 nN) and Pt(779) (p=2.25 nN) values. The evolution of E2(Ω,
ϕ
) is very similar for the two surfaces. E2 displays two minima for ϕ =0 (pure stretch dipoles), and two maxima for ϕ close to 90° (pure torque dipoles). For Pt(997), the characteristics of the dipoles are Ω=173° and ϕ =154°. This corresponds to a region of rather high E2 values, and where the dependence of E2 with ϕ is weak. For Pt(779), the characteristics of the dipoles are Ω=101° and ϕ =21°. This corresponds to a region of low E2 values, between the two minima of E2.The small differences between the two curves of Fig. 6 are due to the crystalline anisotropy of Pt: C44 =0.0765 1012 Nm-2, whereas C11 =0.3467 1012 Nm-2, and C12 =0.2507
1012 Nm-2 [35]. Note that for both surfaces, we have chosen the convention that steps are
ascending from the left to the right, so that the [110] axis is oriented in opposite direction for the two surfaces. However, the crystalline anisotropy is not at the origin of the strong variations of E2(Ω,
ϕ
) observed. These variations are due to the buried nature of the elastic dipole, and similar effects would be observed on isotropic crystals, or on crystals with reverse anisotropy [27]. The geometry of the step plays thus an important role for the dipole orientation. However, it seems not possible to correlate precisely the step geometry to the dipole orientation (lever arm orientation Ω and force orientation ϕ).4. Discussion and conclusion 4.1 Discussion
The present result for the step-step interaction energy (A=1.4 eV.Å) by GIXD measurements on Pt(997) is lower than the values obtained from the analysis of STM measurements of the step fluctuation : from the measurements of the terrace width distribution (TWD) on the (997) surface [8], the first value of A=2.4 eV.Å [36] has been deduced and reevaluated to A=6 eV.Å in a subsequent analysis of the TWD [24].
We have used the recent STM measurements [10] of the step stiffness on Pt(111) to reanalyze the results of Hahn et al. [8]. Since it is not the aim of this paper to discuss how step interactions energies can be derived from TWDs, we shall only mention the procedure used in our present analysis. The TWDs were analyzed in the capillary wave approximation [37, 38]. In this model, the kink formation energy along a step E and the step interaction k energy A are analytically related to the step stiffness β~ and to the variance w2 of the TWD. In such a model, using the experimental values w2 =1.095d02 and β~=1.16 eV/at measured respectively at 900 K [8] and at 653 K [10], one gets E =0.223 eV/at for the kink energy and k
=
A 2.60 eV.Å for the step interaction energy, in agreement with ref. [23]. Note that the use of the capillary wave approximation in the analysis of the data is valid if the measurement temperature is above the roughening temperature TR. Firstly, this is qualitatively shown by
the wide TWD measured [8], much larger than the universal TWD at TR [37]. Secondly, the
obtained E and A values lead to k TR= 570 K, which validate our approximation.
We cannot exclude that these values are overestimated and marred by a high uncertainty since the determination of the step stiffness and of the TWD were done in two different experimental studies and at two different temperatures [8,9]. Note also that the simple analysis of the TWD as performed in [36, 24] or in the present paper is rather rough since only one point of the step-step correlation function is considered. Only a full 2-d analysis of the step roughness, like the consistent analysis of GIXD and STM measurements of the full correlation functions (see [39] for Cu(115)) or the present GIXD measurements on large segments of the CTRs with the subsequent elastic analysis allows extracting much more accurate values of the step interaction constant.
Our measurements confirm that step interactions are much higher on Pt vicinals than on Cu vicinals [25, 36, 24, 38], but of the same order of magnitude as on a (332) Au vicinal
surface, for which A=950 meV.Å has been determined by GIXD [40]. The elastic
interactions can also be compared to the electrostatic interactions between steps. These interactions come from the presence of electrostatic dipoles at the steps. The interaction follows Eq. 7 with an E2 coefficient proportional to the square of the electrostatic dipole.
Such dipoles have been measured on Pt(111) vicinal surfaces, with the two types of step orientation [41]. The vertical component of the electrostatic dipole at a step measured for {111}-type steps (resp. {100}-type steps) is equal to 0.52 D/atom (resp. 0.64 D/atom), and contributes to the interaction energy for E2 =35 meV/atom (resp. 53 meV/atom). Whereas elastic interactions depend highly on the step orientation, this dependence appears thus much
weaker for electrostatic interactions. For both surfaces, electrostatic interactions are much lower than elastic interactions. This confirms, if necessary, that the elastic interaction dominates and is thus the interaction driving the surface roughness behavior.
Our results can also be used for the comparison of the isolated step free energy on the two types of (111) vicinals. STM measurements undoubtedly show that the free energy of steps on Pt(111) is anisotropic [7]. More precisely, the free energy of steps with {111} microfacet orientation is 13% lower than the free energy of steps with {100} microfacet orientation. This ratio is accurately obtained from the observation of the shape of large islands for which elastic interactions should be negligible. On the contrary, DFT calculations have been performed on vicinals with a small interstep distance: (331), (221), (211) and (533), with three or four atomic rows per terrace [18,19] or on a nominal surface with striped islands [20]. In all cases, the contribution of the step-step interaction to the step energy is not negligible: if one extrapolates the elastic interactions between steps, using Eq. 7 with the values of E2
determined by GIXD, one finds that the contribution of the elastic interaction energy to the step energy should be, for example, of 0.092 eV/atom for Pt(221), and 0.025 eV/atom for Pt(533). As a result, the step energy, extrapolated from the experimental measurements of the island shape fluctuations and from the GIXD experiments should be 0.373 eV/at for Pt(553) steps and 0.392 eV/at for Pt(221) steps. Our experiments show that at such small distances, the energy anisotropy for isolated steps is compensated by step repulsive interactions that are higher for {111} steps than for {100} steps. Note that this does not allow to recover the values of step energies computed by DFT [18,19], except for (221) steps in ref. [19] (see Table 2).
Of course, at such small interstep distances, Eq. 7 is not strictly valid. Higher order terms are not negligible and lead generally to a reduction of the elastic interaction energy, with respect to the E2/ d2 value. Atomistic calculations using semi-empirical potentials derived
from tight-binding consideration [15] have shown that for Pt(221), the elastic energy was reduced by 26% with respect to the value extrapolated from Pt(997), whereas this reduction was of 12% for Pt(335) with respect to the value determined for Pt(779).
However, this shows that step energies computed on vicinal surfaces with a high miscut cannot directly been used for determining step energy of isolated steps without any estimate of the step interaction energy.
4.2 Conclusion
We have measured by GIXD the Crystal Truncation Rods of a Pt(997) surface. The data has been analyzed by a model based on linear elasticity. We have shown that the model of a buried dipole reproduces well the atomic displacements due to steps. The good agreement between experimental and calculated structure factors allows us to determine with good precision the characteristics of the force distribution at the steps.
The value so-obtained of the elastic dipole allows us to measure a value of 4.9 Nm-1 for
the surface stress of the Pt(111) terraces and a coefficient of the step-step elastic interactions
of A=1.4 eV.Å. These results compare well with results of DFT calculations of the surface
stress [18,33] and STM measurements of the step interactions [23,24].
By comparing our results on Pt(997) with previous measurements performed with the similar technique on Pt(779), we find that despite the fact that elastic dipoles have nearly the same density for these two surfaces, the elastic interactions are 3.5 times higher on Pt(997) than on Pt(779). The differences between these two surfaces, which are mainly due to the orientation of the dipole lever arm with respect to the surface plane, show the importance of the step geometry on the elastic interactions.
Finally, we have shown that elastic interactions have to be considered when comparing the experimental values of the free energy of isolated steps and DFT calculations of the free
energy of steps on vicinal surfaces. Whereas isolated {111}-type steps are favored with respect to {100}-type steps, this effect is compensated by elastic interactions for short interstep distances, leading to nearly equal step free energies for the two kinds of steps on (211) and (221) surfaces.
References
1
P. Gambardella, Ž. Šljivančanin, B. Hammer, M. Blanc, K. Kuhnke, and K. Kern, Phys. Rev. Lett. 87 (2001) 056103 .
2
P. Gambardella, M. Blanc, K. Kuhnke, K. Kern, F. Picaud, C. Ramseyer, C. Girardet, C. Barreteau, D. Spanjaard, and M. C. Desjonqueres, Physical Review B 64 (2001) 045404.
3
T. Y. Lee, S. Sarbach, K. Kuhnke, and K. Kern, Surface Science 600 (2006) 3266.
4
H. Wang, R. G. Tobin, D. K. Lambert, C. L. DiMaggio, and G. B. Fisher, Surface Science
372 (1997) 267. 5
A. T. Gee, B. E. Hayden, C. Mormiche, and T. S. Nunney, Journal of Chemical Physics 112 (2000) 7660.
6
E. H. G. Backus, M. Forsblom, M. Persson, and M. Bonn, Journal of Physical Chemistry C
111 (2007) 6149. 7
T. Michely and G. Comsa, Surf. Sci. 256 (1991) 217.
8
E. Hahn, H. Scief, V. Marsico, A. Fricke, K. Kern, Phys. Rev. Lett. 72 (1994) 3378.
9
M. Giesen, G. S. IckingKonert, D. Stapel, and H. Ibach, Surf. Sci. 366 (1996) 229.
10
J. Ikonomov, K. Starbova, H. Ibach and M. Giesen, Phys. Rev. B 75 (2007) 245411.
11
M. Ondrejcek, W. Swiech, and C. P. Flynn, Surface Science 566 (2004) 160 .
12
C.P. Flynn, M. Ondrejcek, and W. Swiech, Chem. Phys. Lett. 378 (2003) 161.
13
P. Steadman, K.F. Peters, H. Isern, and S. Ferrer, Phys. Rev. B 64 (2001) 125418.
14
G. Prévot, P. Steadman and S. Ferrer, Phys. Rev. B 67 (2003) 245409.
15
G. Prévot and B. Croset, Phys. Rev. B 74 (2006) 235410.
16
S. Baud, C. Ramseyer, G. Bihlmayer, S. Blugel, C. Barreteau, M. C. Desjonqueres, D. Spanjaard, and N. Bernstein, Phys. Rev. B 70 (2004) 235423.
17
R.C. Nelson , T.L. Einstein, S.V. Khare, P.J. Row, Surf. Sci. 295 (1993) 462.
18
19
G. Boisvert, L.J. Lewis, and M. Scheffler, Phys. Rev. B 57 (1998) 1881.
20
P.J. Feibelman, Surf. Sci. Lett. 463 (2000) L661.
21
M. Giesen, Prog. Surf. Sci. 68 (2001) 1, and references therein.
22
L. Barbier, L. Masson, J. Cousty, and B. Salanon, Surf. Sci. 345 (1996) 197.
23
H.-C. Jeong, and E. D. Williams, Surf. Sci. Rep. 34, 171 (1999).
24
T.L. Einstein, H.L. Richards, S.D. Cohen, and O. Pierre-Louis, Surf. Sci. 493 (2001) 460.
25
G. Prévot, A. Coati and Y. Garreau, Phys. Rev. B 70, 205406 (2004)
26
G. Prévot, B. Croset, A. Coati and Y. Garreau, J. Appl. Cryst 40, 874 (2007).
27
B. Croset and G. Prévot, Phys. Rev. B 73 (2006) 205418.
28
G. Prévot and B. Croset, Phys. Rev. Lett. 92, 256104 (2004).
29
V.I. Marchenko and A. Ya Parchin, Sov. Phys. JETP 52, 129 (1980).
30
I. K. Robinson, Phys Rev. B 33 (1986) 3830.
31
W. H. Press, S. A. Teukolsky, W. Vetterling, B. P. Flannery, Numerical Recipes in Fortran, The Art of Parallel Scientific Computing 2d ed. (Cambridge University Press,
Caambridge, 1992).
32
J. S. Kasper and Kathleen Lonsdale (eds.), International tables for X-ray crystallography, Vol. II, 2d ed. (The Kynoch Press, Birmingham, 1967) p. 332.
33
R. J. Needs, M. J. Godfrey and M. Mansfield, Surf. Sci. 242 (1991) 215.
34
A. Kara, T. S. Rahman, Surf. Sci. Rep. 56 (2005) 159.
35
D. R. Lide, CRC Handbook of Chemistry and Physics 75th ed. (CRC Press, Boca Raton,
1995).
36
H.-C. Jeong, E. D. Williams, Surf. Sci. Rep. 34 (1999) 171.
37
E. Le Goff, L. Barbier, L. Masson, B. Salanon, Surface Science 432 (1999) 139.
38
E. Le Goff, L. Barbier, B. Salanon, Surface Science 531 (2003) 337.
40
G. Prévot, Y. Girard, V. Repain, S. Rousset, A. Coati, Y. Garreau, J. Paul, N. Mammen, S. Narasimhan, Phys. Rev. B 81 (2010) 075415.
41
Tables Pt(997) Pt(779) 0 x (Å) 0.5±0.08 -0.9 0 z (Å) -1.0±0.2 -0.75 ) / ln(ac a0 -2.7±0.2 -9.9 Ω (degrees) 173±3 101 S p (nN) -2.3±0.2 2.1 T p (nN) 1.1±0.1 0.82 1 dz (Å) 0.015±0.01 -0.026 2 dz (Å) -0.007±0.01 -0.017
Table 1. Parameters of the elastic dipoles used for fitting the GIXD results on Pt(997), and comparison with Pt(977). (x ,0 z ) is the position of the lines of dipoles with respect to the 0
step edge, a is the width of the lorentzian shape, c Ω is the lever arm orientation of the dipoles, p and S pT are the stretch component and the torque component of the dipole, and
1
dz and dz2 are the mean relaxation of the two first terrace planes. Positive value for p and S
T
p correspond to the standard case of a contraction of the step edge due to a tensile surface
Step β (eV/at) exp. [10]
(
)
2 0 2 d d E (eV/at) [this work] β (eV/at) extrapolated β (eV/at) DFT [18] β (eV/at) DFT [19] (211) step 0.045 0.393 0.47 (533) step 0.025 0.373 0.470 (322) step 0.016 0.364 0.43 {100} isolated step 0.348 0. 0.348 (221) step 0.092 0.392 0.463 0.38 {111} isolated step 0.300 0. 0.300Table 2. values of the step formation and interaction energies on various Pt vicinal surfaces. In the first column are given the values found from STM analysis of the island shape fluctuations on Pt(111) [10], in column 2 are given the values determined by GIXD from the present analysis, column 3 is the sum of the first two columns, whereas the results of DFT calculations [18,19] are given in the last two columns.
Figures
a
Side view
z
x
a
b
Top view
y
x
c
Fig. 1. Schematic of the Pt(997) surface, including the unit cell (a,b,cr)
r r
for X-rays measurements.
10
20
30
40
50
30 32 34 36 38
h
l
Fig. 2. Reciprocal space map of the diffracted intensity around the (34 0 L ) rod (color online).
10 100 1000 -40 -20 0 20 40 S tr u cu tr e fa ct o r (a rb . u n it s) l-l Bragg
Fig. 3. Experimental structure factors of four crystal truncation rods on Pt(997), as function of
Bragg
l l
l = −
~
(color online). Blue squares: (32 0 l ) rod; green crosses: (34 0 l ) rod; red triangles: (36 0 l ) rod; black dots: (38 0 l ) rod. The dotted lines correspond to the positions of the satellite spots associated with the elastic modes, at l−lBragg multiple of 23.7 and 25.5
100 1000 0 10 20 30 40 50
S
truc
tur
e
F
ac
tor
(a
rb.
uni
ts
)
10 100 1000 0 10 20 30 40 50S
truc
tur
e
F
ac
tor
(a
rb.
uni
ts
)
10 100 0 10 20 30 40 50S
truc
tur
e
F
ac
tor
(a
rb.
uni
ts
)
10 100 1000 0 10 20 30 40 50 10 100 1000 0 10 20 30 40 50(0 2 l)
(32 0 l)
(34 0 l)
(38 0 l)
(36 0 l)
Ω x z p pT pS x0 z0l (reciprocal space units)
l (reciprocal space units)
Fig. 4. Comparison between experimental and theoretical structure factors for Pt(997) (color online). Black dots: experiments; full red line: simulation with the elastic response to lines of dipoles. The parameters used for the fit are given in Table 1. The schematic of the force dipole used for fitting the X-rays is drawn in the top right corner.
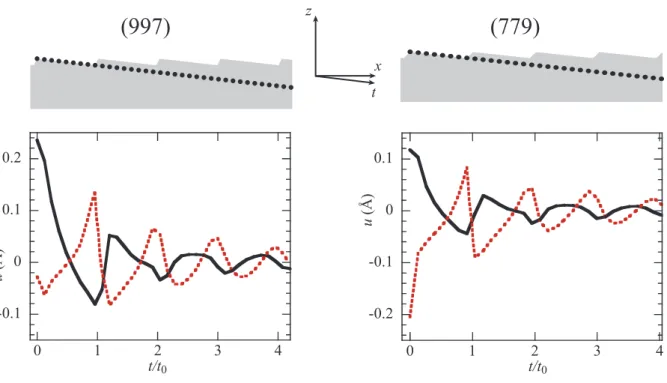
x t z
(997)
(779)
-0.2 -0.1 0 0.1 0 1 2 3 4 u ( Å ) t/t0 -0.1 0 0.1 0.2 0 1 2 3 4 u ( Å ) t/t0Fig. 5. Elastic displacements ur(t) used for analyzing the GIXD results on Pt(997) and Pt(779) (color online). Continuous black line: u ; red dotted line: x uz. For Pt(997) (resp. Pt(779)), t is
along a
[ ]
112 (resp.[ ]
112 ) axis, and t0 =a025/ 24 (resp. a023/ 24) is the interstepdistance projected along the t axis. The corresponding atoms are indicated by dots in the upper schematic.
Fig. 6. Evolution of the coefficient E2 of the step interaction energy with dipole lever arm
orientation Ω and dipole orientation ϕ. ϕ=0 corresponds to a pure stretch dipole, whereas
° =90
ϕ corresponds to a pure torque dipole. Left: for Pt(997); right: for Pt(779). The value of
the dipole density used for the determination of E2 is the same for both surfaces:p=2.4 nN. The experimental values found for Pt(997) (resp. Pt(779)) are indicated by a flag on the graphs; they correspond to Ω=173° and ϕ =154° (resp. Ω=101° and ϕ=21° ).