HAL Id: hal-01823925
https://hal-centralesupelec.archives-ouvertes.fr/hal-01823925
Submitted on 7 Jul 2020
HAL is a multi-disciplinary open access archive for the deposit and dissemination of sci-entific research documents, whether they are pub-lished or not. The documents may come from teaching and research institutions in France or abroad, or from public or private research centers.
L’archive ouverte pluridisciplinaire HAL, est destinée au dépôt et à la diffusion de documents scientifiques de niveau recherche, publiés ou non, émanant des établissements d’enseignement et de recherche français ou étrangers, des laboratoires publics ou privés.
The pipe model theory half a century on: a review
Romain Lehnebach, Robert Beyer, Veronique Letort, Patrick Heuret
To cite this version:
Romain Lehnebach, Robert Beyer, Veronique Letort, Patrick Heuret. The pipe model theory half a century on: a review. Annals of Botany, Oxford University Press (OUP), 2018, 121 (5), pp.773 - 795. �10.1093/aob/mcx194�. �hal-01823925�
REVIEW: PART OF A SPECIAL ISSUE ON FUNCTIONAL–STRUCTURAL PLANT GROWTH
MODELLING
The pipe model theory half a century on: a review
Romain Lehnebach1,2,*,†, Robert Beyer3,4,†, Véronique Letort3 and Patrick Heuret51Centre de coopération Internationale de la Recherche Agronomique pour le Développement (CIRAD), UMR Amap, Kourou,
France, 2Botany and Modelling of Plant Architecture and Vegetation (Amap), Université Montpellier, CIRAD, CNRS, INRA,
IRD, Montpellier, France, 3Laboratory of Mathematics in Interaction with Computer Science (MICS), CentraleSupélec, France, 4Department of Zoology, University of Cambridge, Cambridge, UK and 5Institut National de la Recherche Agronomique (INRA),
UMR Ecofog, Kourou, France
†Joint first authorship.
*Corresponding author: E-mail [email protected]
• Background: More than a half century ago, Shinozaki et al. (Shinozaki K, Yoda K, Hozumi K, Kira T. 1964a. A quantitative analysis of plant form – the pipe model theory. I. Basic analyses. Japanese Journal of Ecology B: 97–105) proposed an elegant conceptual framework, the pipe model theory (PMT), to interpret the observed linear relationship between the amount of stem tissue and corresponding supported leaves. The PMT brought a satisfactory answer to two vividly debated problems that were unresolved at the moment of its publication: (1) What determines tree form and which rules drive biomass allocation to the foliar versus stem compartments in plants? (2) How can foliar area or mass in an individual plant, in a stand or at even larger scales be estimated? Since its initial formulation, the PMT has been reinterpreted and used in applications, and has undoubtedly become an important milestone in the mathematical interpretation of plant form and functioning.
• Scope: This article aims to review the PMT by going back to its initial formulation, stating its explicit and implicit properties and discussing them in the light of current biological knowledge and experimental evidence in order to identify the validity and range of applicability of the theory. We also discuss the use of the theory in tree biomechanics and hydraulics as well as in functional–structural plant modelling.
• Conclusions: Scrutinizing the PMT in the light of modern biological knowledge revealed that most of its properties are not valid as a general rule. The hydraulic framework derived from the PMT has attracted much more attention than its mechanical counterpart and implies that only the conductive portion of a stem cross-section should be proportional to the supported foliage amount rather than the whole of it. The facts that this conductive portion is experimentally difficult to measure and varies with environmental conditions and tree ontogeny might cause the commonly reported non-linear relationships between foliage and stem metrics. Nevertheless, the PMT can still be considered as a portfolio of properties providing a unified framework to integrate and analyse functional–structural relationships.
Key words: Corners’ laws, Leonardo da Vinci’s rule, Pressler’s law, sapwood, heartwood, wood sectoriality, functional–structural plant modelling.
INTRODUCTION
Since the seminal works of the mathematical biologists d’Arcy
Thompson (1917) and Julian Huxley (1924), who explored the effects of scale on the shape of living organisms, the study of how the characteristics of organisms change with body size during ontogeny has become a central issue in many fields of biology (Niklas, 1994). Mathematical relationships between organs/parts and the body size of organisms, currently named allometry, have been explored for many different purposes. First, identification of mathematical rules of proportions is a starting point for investigations into mechanistic explanations and functional requirements (e.g. allocation rules) (Le Roux
et al., 2001; Niklas and Enquist, 2002; Fourcaud et al., 2008). Second, because ontogeny and evolution are closely and recip-rocally interrelated, ontogenetic trajectories have fed studies on the evolution of biological forms (Gould, 1977; Klingenberg,
1998). Third, the identification of such relationships provides proxies to estimate traits whose direct measurement would encounter experimental difficulties (Niklas, 1994). Originally developed in the field of zoology, allometry-based studies are now widespread in the botany and forestry domains, notably as a way to better understand tree growth and to derive forest management strategies (Kittredge, 1944), and have contributed to the development of dendrometric science. The aim of this branch of science is to understand the interdependence of the components of plant form: e.g. the relationship between tree height and diameter, branching patterns and biomass distribu-tion among compartments, e.g. the crown and the trunk. In the context of current interest in forest carbon stocks to mitigate greenhouse gas emissions, the use of allometric regression models has become a crucial step in predicting the above-ground biomass of a tree from dendrometric variables that are easier to measure and are non-destructive, e.g. diameter
at breast height (DBH), height or wood density (Chave et al., 2005; Feldpausch et al., 2011). Further, the patterns revealed by these models make it possible to investigate fundamental ecophysiological mechanisms that underlie plant development and to predict their survival and plasticity in a changing envi-ronment (McDowell and Allen, 2015).
In this allometric race, many efforts have been devoted to relationships involving plant leaf area, whose estimation was – and still is – a primary objective. Indeed, plant leaf area is directly linked to light interception, transpiration and photo-synthesis, and is considered to be the single most important determinant of plant productivity. With the aim of indirectly estimating tree crown biomass, Shinozaki et al. (1964a) pro-posed a new way of looking at experimental results obtained using the stratified clipping technique (Monsi and Saeki, 1953). This method consists in measuring photosynthetic and non-photosynthetic tissues in different horizontal layers from the top to the bottom of a field, a forest or simply a plant. Shinozaki
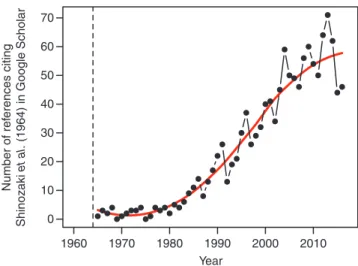
et al. (1964a) proposed an elegant conceptual framework in terms of empirical rules to interpret the relationship between crown foliage and sapwood (SW) dimensions. The pipe model theory (PMT) states that a unit amount of leaves is associated with the downward continuation of non-photosynthetic tissue that has a constant cross-sectional area. The PMT provided a satisfactory answer to two problems that were still unresolved at the time of its publication: (1) What determines tree form and which rules drive the allocation of biomass to the leaf versus stem compartments in plants? (2) How can one estimate the leaf area or mass of an individual plant or a stand, or at even bigger scales? The PMT proposed an elegant answer to both questions, appealing in its conceptual simplicity and intuitiveness. Since its original formulation, the PMT has been reinterpreted and derived, and has undoubtedly become an important milestone in the mathematical interpretation of plant form and function-ing. The number of citations of the original paper continues to increase, more than half a century after its publication (Fig. 1). However, its apparent simplicity conceals several ambiguities that have given rise to differences in the way the PMT has been subsequently understood, interpreted and used. The aim of this review is to go back to the original paper of Shinozaki et al. and
to analyse the initial formulation of the theory and the way it was derived by the authors. We discuss explicit and implicit proper-ties of the PMT in the light of current biological knowledge of tree functioning, and explore experimental evidence supporting and challenging the theory, thus providing an assessment of its validity and range of applicability. We compare the PMT with related theories, such as Huber’s value, Leonardo da Vinci’s rule, Corner’s rules and Pressler’s law, and review the more or less appropriate use of the PMT in plant growth models with a par-ticular focus on functional–structural plant models. Finally, we discuss potential applications of the theory in future research.
THE PIPE MODEL THEORY: ORIGINAL CONCEPTS AND IMPLICATIONS
The elements of a success story
The original paper by Shinozaki et al. (1964a) is undoubtedly a milestone paper that quickly became famous worldwide and has been cited over 1000 times (Fig. 1) in domains as diverse as plant physiology, functional–structural plant modelling and ecology. The presentation of the theory rests on three main elements: two well-known elements, often cited or reproduced, are the textual descriptions and the explanatory drawings, particularly the one presented in Fig. 8 of the original publication (Fig. 2). These two elements circulated much more widely than the third element, which nevertheless represented most of the content of the paper: the range of experimental results that provided the basis for the derivation of the theoretical concept. The theoretical concept and its graphical symbolism are in fact only tentative representations of the properties observed in these experimental data. However, the scientific community adopted the concept while neglecting the experimental basis, which may have facilitated misinterpre-tations. More importantly, and rather surprisingly, these three elements (theoretical concept, graphical representation, experi-mental results) do not all convey the same pieces of informa-tion. As a result, the combination of these three components led to some sort of confusion in the discussions about its properties and applications. This confusion underlines the interest of clearly separating the experimental analysis from the concepts (i.e. both the theory and its graphical representation) it has led to.
A wide range of experimental results. In the 1960s, the stratified clip technique introduced by Monsi and Saeki (1953; for an English translation see Monsi and Saeki, 2005) enabled the acquisition of
70 60 50 40 Number of re fe rences citing Shinozaki et al. (1964) in Google Scholar 30 20 10 1960 1970 1980 1990 Year 2000 2010 0
Fig. 1. Number of citations recorded in Google scholar since the original pub-lication of the PMT in 1964 (vertical line).
Fig. 2. The original graphical representation of the PMT by Shinozaki et al. (1964a). Each active pipe (solid lines) is linked to a leaf or a set of leaves (black circles). The drawing highlights the accumulation of disused pipes at the centre of the stem resulting from the shedding of branches and leaves (dashed lines and circles). Note that there is no connection among active and disused pipes
large amounts of data on the vertical distribution of leaves and non-photosynthetic organs within plant communities. The technique was originally designed to investigate light propagation in cano-pies, which required the quantitative characterization of the inner crown structure. The stratified clip technique consists of cutting all plants within a square of a given inner area (chosen under the constraint of feasible labour) from top to bottom in horizontal lay-ers of a given thickness (5–20 cm in Monsi and Saeki, 2005), after which the plant material is classified into two groups within each species: photosynthetic tissues (i.e. chlorophyll-rich leaf lamina, excluding yellow ones) and non-photosynthetic tissues (stems, branches, stalks, fruits, etc.). It is not mentioned whether petioles are considered as part of leaves or part of the non-photosynthetic organs, although this consideration would be of interest in relation to the concept of conducting pipes (Sébastien Levionnois, France, pers. comm.). The fresh material from each layer is immediately weighed in the field. It should be noted that the architectural or topological structures of the trees are not taken into account. While most plant ecologists focused on the profile of leaves as an inde-pendent variable in the analysis of measurements, Shinozaki et al. proposed to interpret this distribution in relation to that of the non-photosynthetic compartment and to consider the cumulated amount of leaves above a certain height.
This relationship was investigated in different kinds of plants and species, as diverse as herbaceous plants (e.g. maize, reed, sesame, golden rod) and trees (e.g. Ficus erecta, paper birch). A wide range also characterizes the scales considered for data acquisition, ranging from natural or cultivated stands with differ-ent densities to individual trees and even to the level of a single branch. It is striking that nine out of the 12 figures in Shinozaki
et al. (1964a) display data at the scale of a square metre, whereas the concepts that originated from these data were formulated at the scale of the individual (Shinozaki et al. described it as ‘pipe model theory on tree form’ at the end of the abstract), which is also the scale at which the theory has been applied most often since. Finally, the variables used in the linear regressions (inci-dentally, standard criteria used to assess the quality of the regres-sion, such as R2 or the distributions of residuals, for instance,
are not provided in the paper, nor is an explanation of how the number of points considered as belonging to the crown versus the stem is chosen) are not homogeneous throughout the paper: photosynthetic matter (except in one figure where fruits are also included) versus non-photosynthetic matter (dry or fresh weight per length section), expressed in various units that range from g 50 cm−2 10 cm−1 to ton ha m−1. It is also important to note that the
notion of functional stem cross-section or SW only appears at the end of the paper (Fig. 9 in the original publication).
The wide range of species and scales confers a certain apparent robustness on the theory, suggesting its validity for a wide range of growth forms (from herbaceous to trees) and for different scales (from branch to individual plant and stand). Nevertheless, this broad scope of applicability, illustrated by a set of variables of different nature and units, has led to different interpretations, as discussed in the following sections.
A textual formulation. The essence of the PMT concept is sum-marized in the following sentences: ‘a unit amount of leaves is provided with a pipe whose thickness or cross-sectional area is constant. The pipe serves both as the vascular passage and as the mechanical support, and runs from the leaves to the stem base through all of the intervening strata’. However, Shinozaki
et al. are not always consistent throughout the paper regard-ing the variables they consider. In particular, it is not clear whether they favour the total amount of stem (i.e. weight of a slice of ‘small’ thickness at a certain height, hence likened to a cross-sectional area) or only the functional cross-sectional area, as seems to be suggested by the mechanistic interpreta-tion of the theory in the sentences cited above. The different variables whose occurrence can be inventoried in the text are: (1) ‘amount of leaves’ and ‘cross sectional area’; (2) ‘amount of leaves’ and ‘amount of the stem’; and (3) ‘a proportional relation between the amount of actively functioning woody organs at a certain height z and the amount of leaves they sup-port F(z)’ (in the abstract and on pages 99 and 102, respectively, in Shinozaki et al., 1964a).
A graphical representation. The schematic drawings (Fig. 2) (Fig. 8 in the original paper) are likely to have contributed significantly to the success of the PMT by providing a visual representation that makes it possible to immediately grasp the main concepts. The graphical representation conveys several pieces of information that are not necessarily included in the theoretical formulation. First, it favours a representation of the tree compartment as strictly partitioned, i.e. where a block of leaves is associated with one and only one block of stem. The size of these blocks is questionable: the figure suggests that each leaf is associated with one particular pipe, while in fact the relationship is established between uncountable quantities (weight, cross-sectional area). Although the drawing features simple leaves directly connected to a main stem, the text men-tions branches, stating that the figure illustrates the process by which the trunk is incrementally formed by the accumulation of disused pipes that once supported then shed branches. This oversimplified representation of a plant does not accommodate the role of the branch structure, which we discuss in the follow-ing section.
On the explicit and implicit properties that can be derived from the theory, and related theories (Fig. 3)
The last two elements (i.e. the textual formulation and the graphical representation) in fact imply much more than what is explicitly stated in Shinozaki’s paper and resonate with other generic theories developed by several authors.
First, the theory states that ‘a pipe runs from a unit of leaves to the stem base and has a constant cross-sectional area’. Consequently, this pipe has to follow the whole path determined by the tree branching structure, implying that the cross-sectional area of trunks and branches should be proportional to the amount of leaves located above the section in the tree architecture but not above it in terms of absolute height. However, plant archi-tecture was not taken into account in Shinozaki’s experimental datasets since the quantities considered were collected slice by slice, depending on their height alone. It was not until the intro-duction of the main axis cutting (MAC) method by Chiba (1991)
that both tree branching and the vertical distribution pattern of organs were taken into account in analysis of experimental data. Sapwood area and leaf area/mass are proportional (property 1). If, as stated in the text, the ‘pipes mainly serve as vascular passage from the roots to the leaves’, then only active pipes should be taken into consideration instead of the whole set of
pipes (i.e. the whole trunk section, as in the original paper). Therefore, an explicit property of the PMT is the proportional relationship between conductive area of the stem SW at a cer-tain height along the stem and the mass of foliage above. This property echoes Pressler’s law, which postulates that ring area growth (the cross-sectional area of a single annual increment) at any point on the stem is proportional to the quantity of foli-age above this point (Fig. 3) (Pressler, 1865, cited in Larson, 1963).
From an evolutionary perspective, in his seminal paper on the durian theory, Corner (1949) made empirical observations such as ‘The stouter the main stem, the bigger the leaves and the more complicated their form’. He completed this with a second point he called ‘diminution on ramification’, as ‘The greater the ramification, the smaller become the branches and their appendages’. These principles were referred to as Corner’s rules by Hallé et al. (1978). The relationship between stem primary diameter (before secondary growth) and leaf size has been explored by several authors and intuitively explained by functional requirements in terms of hydraulic and mechani-cal supplies (Hallé et al., 1978; White, 1983a, b; Brouat et al., 1998; Westoby and Wright, 2003). These authors generally considered the first of Corner’s rules as consistent with the PMT at the scale of the leafy twig, and thus can be considered as an affiliated theory (Fig. 3).
Non-scalability (property 2). Several authors assumed the pro-portionality constant of the leaf-to-wood mass ratio (i.e. the specific pipe length, L) to be constant across seasons, growth stages and experimental environmental conditions for a particu-lar species (Waring et al., 1982; Gerrish, 1990). This may have been suggested by the fact that the values of L are given for dif-ferent species (graphs and Table 1 in Shinozaki et al.’s paper) with no details on the corresponding environmental conditions. This may have led to the interpretation that the PMT is not scalable, in the sense that it does not account for size-related effects on the leaf mass-to-SW area ratio (Mencuccini et al., 2011). This property of non-scalability, or at least changes in L with stand density or growth stages, is in fact acknowledged by Shinozaki et al.: they report variations of L within a growth
season in a dense stand of 3-year-old Ulmus parvifolia (Fig. 11 in their paper) and with combinations of different growth stages and densities in maize (Zea mays) and buckwheat (Fagopyrum esculentum) in their Table 2. They were unable to identify any generic trend in these variations of L in their data and conclude that ‘more experimental studies are, however, needed to clarify the behavior of L under various growing conditions’. However, in their second paper, Shinozaki et al. (1964b) suggest that the SW at the crown base can serve as a basis for the estimation of foliage mass in stands regardless of their age or habitat. This point is particularly important because this hypothetical con-stancy of L throughout plant development or under different conditions (Dean et al., 1988) was – incidentally – the corner-stone of the PMT used to estimate leaf area from measurements of SW area. This erroneous interpretation that L should be a constant has subsequently raised unjustified criticisms of the PMT when some experimental results refuted that assumption (see The variability and plasticity of the AL:AS ratio and the scalability of the PMT), while it was in fact established only as an internal relationship within a plant (or a stand) at a given time. Finally, we note the link between the parameter L and the ‘Huber value’, i.e. the ratio of the cross-sectional xylem areas of a stem to the fresh weight of the leaves supplied by the stem (Fig. 3) (As:Al ratio; Huber, 1928).
The area-preserving rule (property 3). Because pipes have a constant cross-sectional area, the PMT assumes that the con-ductive SW area of a stem at a given height is equal to the cumulative basal area of its daughter axes above that height (Yamamoto and Kobayashi, 1993; McCulloh et al., 2003). Even more important for our purposes is the central idea of the PMT: the cross-sectional area of the conductive SW is pre-served at each branching event and remains constant irrespec-tive of its position along the trunk. Not 50 but some 500 years ago, a prophet of the PMT, Leonardo da Vinci, noticed that the total cross-sectional area of all the branches at any height was equal to the cross-sectional area of its trunk (Fig. 3) [Notebooks of Leonardo da Vinci, pp. 394, 395 (Richter and Bell, 1970)]. Da Vinci also drew the frequently revisited com-parison of a tree’s branching system to a river course feeding
(3) Area preserving rule (2) Non-scalability Pipe model Pressler’s law Corner’s rules Huber value Da Vinci’s rule (4) Hydraulic sectoriality (5) Operating time of pipes (1) Proportionality between SW area and leaf area/mass
Fig. 3. Overview of the PMT properties (black boxes) and their link with affiliated theories (grey boxes). The description of properties and affiliated theories is provided in section 2.2
a main stream. This is equivalent to the area-preserving rules (Horn, 2000). Although the PMT refers to the balance between transpiration and stem water supply, some authors also used the conservation of cross-sectional area in branching points motivated by the PMT to describe root systems (Shinozaki
et al., 1964a; Oppelt et al., 2001; Pagès et al., 2004; Salas
et al., 2004).
Hydraulic sectoriality (property 4). Both the text and the figure (reproduced as Fig. 2 in this paper) in Shinozaki et al. (1964a) suggest a sectored anatomy, with no lateral transport of water and mineral between pipes. From this point of view, an implicit prop-erty of the PMT is that the hydraulic architecture is not an inte-grated system (Cruiziat et al., 2002).
Operating time of pipes (property 5). Furthermore, Shinozaki et al. state that ‘the successive accumulation of disused pipes in the trunk is associated with the progress of tree growth’. Further on in the text, they complete this statement with ‘the pipes which make up the stem and branches of a tree are renewed every year’. One critical point is that it is not explicitly stated whether pipes can be reused in two successive years or not. However, the graphical representation and the text suggest that when a new leaf is produced, a corresponding new functional pipe is also produced, and is automatically disabled when the leaf is shed (Fig. 2). This point has important consequences: it implies that in deciduous trees in temperate zones, only the last wood growth ring is conductive, since the leaves are renewed every year and secondary growth is annual. In evergreen spe-cies, the conductive SW would correspond to a number of rings that is equivalent to the lifespan of the leaves (Kershaw and Maguire, 2000).
Summary. The PMT presents some characteristics that have contributed to its success: an elegant and intuitive concept, a simple and easy-to-interpret graphical representation, and the fact that it is (apparently) based on solid experimental results. Different kinds of plant species are considered in the work of Shinozaki et al., giving to the PMT a universal and generic sense. As a result, it has occasionally been seen as a universal rule. Authors applying the PMT in plant modelling (see below) appear to implicitly assume that the underlying concepts have been properly validated by experimental results. However, as we showed, the properties associated with the PMT listed above are poorly supported by the experimental results presented in the original paper. For example, the set of experimental data presented in the paper does not include measurements of any characteristic of ‘functioning woody organs’. The only excep-tion could be seen in Shinozaki et al.’s Fig. 9, where stem wood increment in the preceding 5 years is used and can be consid-ered as an approximation of the functioning wood volume. The theory cannot be said to follow rigorously from the analysis of the experimental data despite Shinozaki et al.’s argument that ‘as demonstrated by actual measurements of the trunk thick-ness ..., this hypothesis seems acceptable and may be called the pipe model theory of tree form’. Instead, it arose from an imaginative effort to conceptualize the way plants function and the causes that might explain the reported relationships. The PMT is thus rather a hypothesis than a conclusion drawn from a thorough analysis of experimental facts.
It also raises several questions about the nature of the pipe. Aside from the root-to-leaf continuity and a constant
cross-sectional area, Shinozaki et al. provided no explicit description of the internal structure of pipes. This lack of char-acterization has facilitated very diverse interpretations of the notion of pipes. Is the pipe is merely a virtual construct that helps understanding and modelling tree form, or does it corre-spond to an actual anatomical object? In the following section we review the current literature on wood anatomy in order to scrutinize the concept of the pipe.
EXAMINING PMT-AFFILIATED PROPERTIES IN THE LIGHT OF OUR ACTUAL KNOWLEDGE OF PLANT
BIOLOGY
What is a pipe?
As argued above and by other authors (Normand et al., 2008;
Mencuccini et al., 2011; Holtta et al., 2013), the PMT does not provide any details about the nature of ‘pipes’, thus lead-ing to different interpretations of their structure. First, the ana-logy between the structure of a stem as described by Shinozaki et al. (i.e. a longitudinally oriented set of pipes) and the ana-tomical structure of a plant stem has led to the interpretation of Shinozaki et al.’s pipe as a tracheary element (i.e. a vessel or tracheid) (Rennolls, 1994; West et al., 1997, 1999; Roderick and Berry, 2001; McCulloh et al., 2003). The extent to which the concept of the pipe as a structure providing mechanical and hydraulic support of leaves in the PMT corresponds to or deviates from anatomical reality depends on the taxonomy of the plant under study. In angiosperm stems, water is con-ducted by vessels whose cross-sectional area is greater than that of fibres, which provide mechanical support. Given this marked functional differentiation between cells, considering the pipe as a single secondary xylem cell is unrealistic for angiosperm species. In contrast, it is more realistic in the case of gymnosperms, since their xylem cells are differentiated only to a small extent: tracheids are the main cell type ensur-ing both mechanical support and the longitudinal motion of water. Although varying within tree as well as within growth ring (Lachenbruch et al., 2011), their diameter is generally smaller than that of angiosperms vessels (Sperry et al., 2006). Therefore, in relatively structurally homogeneous wood, as found in gymnosperms, tracheids might form a cellular unit integrating the functions of a pipe sensu Shinozaki et al. An alternative interpretation of Shinozaki et al.’s notion of the pipe may be a wood strand rather than an individual tracheary element. This interpretation would seem particularly rea-sonable in the case of angiosperm species as wood strands integrate both mechanical and conductive tracheary elements (i.e. fibres and vessels, respectively). It is important to note that studies that established empirical relationships between leaf quantity and SW or stem area (e.g. Waring et al., 1982;
Morataya et al., 1999) considered, explicitly or not, pipes as strands of wood. Given the observed variations of cell mor-phologies occurring within a single plant during its ontogeny (Lachenbruch et al., 2011), considering pipes as quantities of wood is more generic and makes it possible to account for the heterogeneous nature of the material, which could not be done by considering the pipe as a unique tracheary element (Savage
Since Pressler’s law (Pressler, 1865) is a particular case of the PMT for deciduous temperate species, the particular set of pipes formed in the most recent growing season would correspond to the last annual wood increment. By extension, one could expect to observe a number of functionally active annual wood increments (i.e. sets of pipes that were formed in a specific growing season) equal to the age of the oldest liv-ing leaves in evergreen species. However, it is likely that the water supply of very young leaves at the beginning of the grow-ing season is provided, at least in part, by the precedgrow-ing annual increment (i.e. 1-year-old pipes) (Rennolls, 1994). In this case, pipes do not necessarily correspond only to annual growth ring (Rennolls, 1994). This view also challenges the validity of the sectoriality property of the PMT (property 4).
Sectoriality and integration of the vascular system of plants
Both the textual formulation and the schematic drawings published in the paper by Shinozaki et al. suggest that water and mineral nutrients are conducted from the soil to a given leaf unit through a single pipe that is disconnected from adjacent ones. Such a vascular plant is sectorial in the sense of Watson and Casper (1984) and Watson (1986), i.e. it is an assembly of independent integrated physiological units (Herrera, 2009). Before questioning the biological relevance of this property, a proper definition of the concept of sectoriality is required. The hydraulic connectivity can be considered in the lateral (i.e. radial and tangential movement of water) and axial [i.e. ‘bottom-up’ sectoriality as a preferential pathway from roots to different parts of the crown (Herrera, 2009)] directions. Clearly, these two axes need to be considered together in order to under-stand tree hydraulic architecture as a whole. Thus, sap flux in sectorial plants is compartmentalized within some parts of their structures (e.g. within the same branch), with a strong degree of independence from other compartments [e.g. among distinct
branches (Sprugel et al., 1991; Vuorisalo and Hutchings, 1996;
Brooks et al., 2003)]. In contrast, in a non-sectorial plant (i.e. an integrated plant), different compartments are interrelated by vascular connections. The figure produced by Schenk
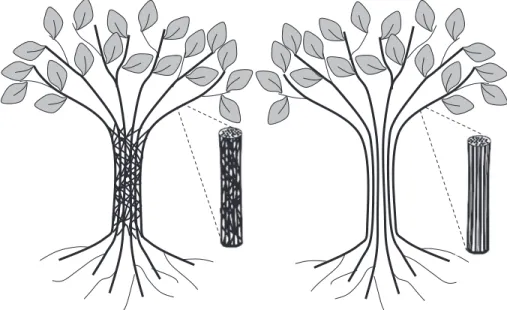
et al. (2008) illustrates the two extremes of the sectoriality– integration continuum (Fig. 4). The degree of sectoriality (or the degree of integration) depends on vessel distribution and morphology, such as diameter and clustering of vessels, and/ or the non-uniform location and frequency of inter-conduit pit-ting to keep sectors separated (Carlquist, 1984; Ellmore et al., 2006; Zanne et al., 2006; Lachenbruch and McCulloh, 2014). Moreover, Zwieniecki et al. (2013) suggest that sap ion concen-tration can also directly modify the extent of lateral transport as a cause of changes in xylem axial resistance. In line with the PMT, this section only examines xylem functioning; however, the concept of sectoriality applies to the entire vascular system, including phloem and carbohydrate distribution (Orians et al., 2005a).
Examining xylem hydraulic architecture and connections within a tree is a tedious task (Cruiziat et al., 2002; David et al., 2012). Numerous methods have been used to study hydraulic connections at scales ranging from individual vessels to the entire plant. Introducing dyes or mineral stable isotopes into the stems of the living tree make it possible to visualize water-conduction pathways (Larson et al., 1994; Schulte and Brooks, 2003; Orians et al., 2004; Sano et al., 2005; Ellmore et al., 2006; Umebayashi et al., 2008; Espino and Schenk, 2009) and to measure sap flow in different parts of trees. This method, possibly coupled with manipulation such as split-root or branch severing, can produce a map of preferential pathways (Infante
et al., 2001; Lopez-Bernal et al., 2010; David et al., 2012;
Nadezhdina et al., 2012, 2013; Sato et al., 2012; Shinohara
et al., 2013). We refer to Orians et al. (2005a) for an extended discussion of the advantages of the different techniques.
These experimental results reveal that plant species exhibit a wide range of variation in their degree of sectoriality (Schulte
Fig. 4. Graphical representation of the hydraulically integrated (left) and sectorial plant (right) by Schenk et al. (2008). The sectoriality–integration property is illustrated at the whole-plant scale (i.e. absence/presence of connections between adjacent pipes connecting a set of roots to a set of leaves) and at the wood strand
and Brooks, 2003; Ellmore et al., 2006; Schenk et al., 2008;
Espino and Schenk, 2009), ranging from highly sectored spe-cies, constructed of autonomous subunits such as ring-porous species like oak and elm (Orians et al., 2005b; Ellmore et al., 2006) and longitudinally split shrubs (Schenk et al., 2008), to fully integrated species appearing as single units, such as dif-fuse porous species like birch and many others (Watson and Casper, 1984; Tyree and Zimmermann, 2002; Orians et al., 2005b; Ellmore et al., 2006). Intermediate degrees of sectorial-ity or integration are possible at the scale of species, individu-als and organs (Vuorisalo and Hutchings, 1996; Orians et al., 2004; Ellmore et al., 2006; Nadezhdina, 2010). Sprugel et al. (1991) suggested that sectoriality could provide advantages in terms of damage control, stress isolation and light capture. A high degree of sectoriality ensures better protection against the spread of embolism and therefore is seen as a success factor for adaptation in xeric environments. A drawback is reduced specific conductivity (Zanne et al., 2006; Schenk et al., 2008;
Lachenbruch and McCulloh, 2014). In contrast, low sectori-ality appears to be an advantage in environments with patchy resources (Orians et al., 2004; Ellmore et al., 2006), such as the forest understorey (Thorn and Orians, 2011). Sectoriality is also expected to occur more frequently in gymnosperms and dicotyledons than in monocotyledons, because of their open vascular systems (Vuorisalo and Hutchings, 1996; Orians
et al., 2005a). Nevertheless, the gymnosperm xylem structure, in which the bulk of axial elements conduct water, permits higher hydraulic integration than angiosperm wood (Cruiziat
et al., 2002). Intraspecific differences can also be observed and the degree of sectoriality may vary according to the ontogen-etic stage of the plant (Watson and Casper, 1984; Zanne et al., 2006; Salguero-Gomez and Casper, 2011). This touches upon a hypothesis of Hallé (1991), that juvenile wood would consti-tute the stem of young trees for which crown development has not yet started, while mature wood results from integration of root systems of different reiterated complexes that constitute the mature tree crown (Barthélémy and Caraglio, 2007). This hypothesis has given rise to the term ‘crown-formed wood’ to describe fluctuations in wood structure associated with the size of the crown (Amarasekara and Denne, 2002). The link between the degree of reiteration of species and their sectorial-ity degrees is an active research area (Herrera, 2009).
In summary, while some plants exhibit a distinct sector-ial hydraulic system, thus conforming to the PMT, the large observed diversity of degrees of hydraulic connectivity among species or depending on growth conditions shows that the notion of the pipe is not a universally valid one and should be more nuanced.
Discussing the hydraulic sectoriality or integration concept in the framework of the PMT relies strongly on the presence or absence of a preferential vascular pathway to a given leaf or a set of leaves. With water being to some extent able to move radi-ally between pipes of the same cohort (i.e. same-aged pipes), is a cohort of leaves (i.e. same-aged leaves) only connected with the corresponding cohort of pipes? In other words, are leaves formed in a specific year only connected to the growth rings formed in the same year? In needle-pulling experiments on 16 gymnosperms species, Maton and Gartner (2005) observed that leaves of deciduous species pull water only through the current growth ring, whereas different evergreen species were shown
to pull water from up to 2-year-old growth rings. This diversity of patterns in the ascent of water reflects the different mecha-nisms driving the formation of new connections between leaves of varying age and newly produced xylem as well as the deacti-vation of old ones. Maton and Gartner (2005) demonstrated that a leaf can be connected to different pipe cohorts in its life-time. The authors were unable to classify some species due to high intra-specific variability, and even observed some samples pulling water from different growth rings. This questioned the concepts of both leaf traces (MacDougal et al., 1929) and ray parenchyma (Barnard et al., 2013) as pathways for the radial movement of water between different cohorts of pipes.
Stem, SW and ring tapering
Sapwood area at crown base or at breast height? A key prop-erty associated with the PMT is the constancy of the ratio of leaf to conductive SW (SW) area (AL:AS) within a tree. This rule is expected to be valid in any point of the tree branching structure and throughout plant ontogeny. It predicts increasing SW area from the tree top downwards following the increase in foliage biomass/area towards the crown base and subsequently a constant SW area between crown and stem base. The ratio of leaf area to SW area at breast height should thus be equal to the same ratio computed with SW area at crown base. However, many studies (reviewed in the following paragraphs) reported that SW area increases from the crown base to breast height. Thus, to avoid biases due to the effect of SW tapering below the crown base, it would be preferable to measure the ratio of leaf area to SW area at the crown base rather than at breast height, to obtain more reliable values at the intra-specific level (Waring
et al., 1982; Marchand, 1984; Bancalari et al., 1987; Maguire and Batista, 1996).
Tapering of sapwood thickness or area. Many studies reported SW thickness, instead of area, to increase downward within the crown and then to remain constant below crown base for both gymnosperms (Yang et al., 1985; Ojansuu and Maltamo, 1995; Climent et al., 2003; Pinto et al., 2004; Knapic et al., 2006; Longuetaud et al., 2006) and angiosperms (Dhôte et al., 1997; Björklund, 1999; Knapic et al., 2006; Miranda et al., 2006; Morais and Pereira, 2007). This implies that stem and heartwood (HW) tapering is generally similar in shape (Long
et al., 1981; Pinto et al., 2004; Longuetaud et al., 2006; Morais and Pereira, 2007). However, other authors reported different observations. Climent et al. (2003) identified a group of Pinus canariensis trees with HW proportion reaching a maximum between 4 and 8 m from the tree base (i.e. non-monotonic HW tapering) and a different group with monotonic decreas-ing HW proportion towards the top of the tree. Similar patterns were also recorded in Pinus pinaster (Berthier et al., 2001;
Pinto et al.; 2004, Knapic and Pereira, 2005) and Pinus syl-vestris (Björklund, 1999; Mörling and Valinger, 1999) and are considered to be a specific feature of conifer species (Climent
et al., 2003). It has been suggested that the parts of trees with a high HW proportion could be linked to high production of ethylene at the part of the stem that is subject to the maximum mechanical stress when the tree sways (Climent et al., 2003). Aside from these particular cases, the constant SW thickness
found along the branch-free stem has been suggested to vali-date the PMT (e.g. Knapic and Pereira, 2005). This conclu-sion neglects the fact that a constant SW thickness is usually incompatible with a constant SW area in tapered stems. Indeed, when both SW thickness and area are considered together, it is generally observed that SW area increases from the crown base towards the ground, whereas SW thickness remains constant (Long et al., 1981; Ojansuu and Maltamo, 1995; Gominho and Pereira, 2005; Longuetaud et al., 2006; Miranda et al., 2006;
Morais and Pereira, 2007).
Models of sapwood area tapering. The experimental difficulty of measuring SW area below the crown has motivated research-ers to describe and model SW tapering along the stem in order to predict the SW area at different heights by tree metrics readily measurable from the ground. In addition, they aim at studying HW variations within the stem, an objective shared with the forestry and timber industry to better assess the profitability of stems and forest plots. Ojansuu and Maltamo (1995) modelled SW area tapering in P. sylvestris using a combination of HW and stem taper models and tree biometric descriptors (DBH, tree and crown height). Using the same predictors, Maguire and Batista (1996) were also able to model SW tapering by deriving stem taper models. More recently, Cruickshank et al. (2015)
developed models using variables available from remote sens-ing. They compared an empirical and a functional approach: the functional one strongly relied on assumptions based on the PMT as well as an exponential decay function allowing the SW area to drastically increase near the stem base (see below); the empirical one is a segmented polynomial equation (Gallant and Fuller, 1973). The functional model predicted an overly abrupt change between trunk and crown segment in the vicinity of the crown base that was not always clearly observed at this pos-ition, but instead in higher parts of the crown. The empirical model proved more flexible and allowed estimation of the pos-ition of inflection points of the SW area profile. It showed that, at least for lodgepole pine (Garber and Maguire, 2005) and western hemlock (Kershaw and Maguire, 1995), the inflection point appeared to be closely related to the modal value of the leaf density distribution within the crown, which varies between species (Maguire and Bennett, 1996; Weiskittel et al., 2009), but also within a given species depending on stand density or social status (Garber and Maguire, 2005).
Relation with foliage distribution. In a Douglas-fir stand, fo-liage distribution strata were successfully identified using measured SW area tapering and assuming a constant ratio of leaf area to SW area (Maguire and Bennett, 1996), but some discrepancies between estimated and observed distributions challenged the validity of the said ratio within the crown, where it was shown to vary significantly (Bancalari et al., 1987; Kershaw and Maguire, 1995; Mäkelä and Vanninen, 2001; Kantola and Mäkelä, 2004; Schneider et al., 2011). Dean
et al. (1988) observed a ratio of lower leaf area to SW area at the crown top and crown base than at mid-height. Mäkelä and Vanninen (2001) observed the same tendency for the ratio of leaf mass to stem area in P. sylvestris, and observed that the highest ratio value corresponded to the peak of foliage distri-bution. It has been hypothesized that the variation in the ratio of leaf area to SW area could result from the variations in SW conductivity and transpiration rate per unit of foliage within the
crown (Brix and Mitchell, 1983), the potential incongruity be-tween SW area and area of actually conducting wood (Mäkelä and Vanninen, 2001), and the conservation of higher SW area to store water (Cruickshank et al., 2015).
Trunk basis. A strong non-linear increase in SW area has also been observed at the trunk basis (Long et al., 1981; Ojansuu and Maltamo, 1995; Mörling and Valinger, 1999; Cruickshank
et al., 2015), which may result from an increase in SW area or a decrease in HW area as mentioned above (Climent et al., 2003). For conifer species, this phenomenon could be due to a different trade-off between water transport and mechanics. Indeed, a larger proportion of latewood in this part of the tree (Gartner et al., 2004) might provide sufficient strength to meet the strong mechanical constraints present in this part, but might also decrease xylem specific conductivity (Zimmermann, 1983;
Gartner, 1991; Domec and Gartner, 2002), resulting in a higher production of SW to meet hydraulic demands (Stokes and Berthier, 2000; Berthier et al., 2001; Cruickshank et al., 2015). Relation with Pressler’s law. Under the assumption that physio-logically active wood area is equal to the last annual wood incre-ment, the PMT can be interpreted as an alternative formulation of Pressler’s law (Pressler, 1865; Cruiziat et al., 2002). The lat-ter states that ‘Ring area growth (cross-sectional area of a single annual increment) at any point on the stem is proportional to the quantity of foliage above this point’ (Pressler, 1865, cited by Larson, 1963). This law assumes that the yearly carbon al-location from the crown is uniform along the stem and does not vary significantly with environmental conditions. It has been widely used in forest science as it represents an intuitive way to describe, understand and predict the layering of xylem at the origin of the stem shape (Larson, 1963; Houllier et al., 1995). Yet it has not been used as widely as the PMT, presumably be-cause it implies a priori knowledge about stem increment distri-bution, which is less easily measurable in the field than the stem or SW area.
If we accept the above-described property 5 of the PMT, which states that only the last wood growth ring is conductive in deciduous species, then the PMT and Pressler’s law are equiva-lent. Few studies have confirmed Pressler’s law (e.g. Ottorini, 1991, for Douglas-fir), whereas many works have underlined discrepancies between the theory and biological observations (Farrar, 1961; Weiner, 1984; Osawa et al., 1991; Yamamoto, 1994; Courbet, 1999; Saint-André et al., 1999; Kershaw and Maguire, 2000; Deleuze and Houllier, 2002; Bevilacqua et al., 2005; Cortini et al., 2013). Hatsch (1997) showed that in ses-sile oak it is not the ring surface that remains constant under the crown but its thickness. Moreover, the competitive status of trees is of primary importance. Dominant and suppressed trees show an increase and decrease in growth ring area towards the base, respectively, while intermediate trees show no variations (Larson, 1963; Courbet, 1999; Cortini et al., 2013). This sug-gests that the constant growth ring area along the trunk pos-tulated by the model is not a general rule. Moreover, extreme events such as drought can influence the longitudinal second-ary growth pattern. For example, Bouriaud et al. (2005) showed that during dry years ring-area increments were more strongly reduced at breast height than in the upper parts of the tree. Apart from the variations along the bole, another common criticism of Pressler’s law is linked to the observation of a strong increase in
ring area at the trunk base, resulting in the butt swelling of trees (Farrar, 1961; Larson, 1963; Ottorini, 1991; Courbet, 1999;
Dhôte et al., 2000; Deleuze and Houllier, 2002; Bevilacqua
et al., 2005; Cortini et al., 2013; Yu et al., 2014), the magnitude of which is linked to crown dimensions (Larson, 1963; Cortini
et al., 2013) and therefore strongly suspected to be related to mechanical support (Larson, 1963; Gartner, 1995). Some stud-ies indicate that the relationship between ring area and foli-age area is not simply proportional (Hall, 1965; Deleuze and Houllier; 1995, Kershaw and Maguire, 2000; Groot and Saucier, 2008), but decreases with increasing distance to the treetop as a result of decreasing photosynthetic rate and light intensity, as well as increasing foliage age (Kershaw and Maguire, 2000). An additional criticism is related to the fact that the crown base and the point along the stem below which growth ring area is roughly constant may not coincide. Indeed, while some stud-ies report a maximum growth point in the vicinity of the crown base (Larson, 1963, and references therein), this point was also recorded at different depths within the crown (Courbet, 1999;
Cortini et al., 2013). These observations motivated the idea of an ‘efficient crown base’ excluding lower branches that cannot be seen as part of the crown due to ageing or to mechanical com-petition with neighbours (Houllier et al., 1995; Courbet, 1999).
The simplicity of Pressler’s law does not account for varia-tions in ring area distribution related to varying growing con-ditions (Deleuze and Houllier, 2002), crown classes (Mitchell, 1975), site quality, silvicultural treatments and competition (Bevilacqua et al., 2005) or age (Larson, 1963; Ottorini et al., 1996; Courbet, 1999). Therefore, with the aim of stem form modelling, the above criticisms call for improvements of the model (Houllier et al., 1995; Courbet, 1999; Cortini et al., 2013). Courbet (1999) developed a flexible three-segmented model with Pressler’s law as a particular case, allowing ring area to (1) decrease non-linearly within the crown, (2) vary along the trunk and (3) increase sharply at the trunk base, and providing intuitive and uncorrelated coefficients that could be analysed in different growing conditions. However, this model requires input variables that are not easily available, such as foliage dis-tribution or increment area at breast height. Cortini et al. (2013)
developed a species-level mixed-effect three-component model to predict ring increment along the stem based on more read-ily accessible crown and stand variables. Whereas empirical models are efficient in predicting radial increment distribution over the studied range of species and stand characteristics, they are not suited for prediction outside the range covered by the dataset (Courbet, 1999; Cortini et al., 2013). A more flexible modelling approach consists in process-based models (Deleuze and Houllier, 1995, 2002) that integrate budget, distribution and translocation of carbon through the phloem and partition-ing coefficients between tree compartments at different spatial scales. However, these models failed to predict the sharp incre-ment at the trunk base of highly butt-swelled trees (Deleuze and Houllier, 2002), suggesting that mechanical signal might interfere with a simple carbon diffusion principle.
To conclude, our comparison between theory and observa-tion demonstrated that, in its initial formulaobserva-tion, Pressler’s law, as an intuitive and straightforward framework to understand how the stem forms and the crown develops through simula-tions or retrospective approaches, is not generally valid.
Relation with Leonardo da Vinci’s rule (area-preserving rule). The PMT implicitly assumes the validity of Leonardo da Vinci’s rule: that the axis cross-sectional area below a given branching point is equal to the sum of the cross-sectional areas of the daughter branches above this point (Shinozaki et al., 1964a; Richter and Bell, 1970; Nikinmaa, 1992; Yamamoto and Kobayashi, 1993). Although Leonard da Vinci’s rule is oc-casionally used as a structural property of tree models (West
et al., 1999; Eloy, 2011; Minamino and Tateno, 2014), there is little experimental work confirming its validity. As in the case of tapering rules, the area-preserving rule has been tested with regard to cross-sectional areas of ring increments, SW and whole axes excluding bark (Nikinmaa, 1992; Yamamoto and Kobayashi, 1993; Hatsch, 1997; Sone et al., 2005, 2009). Furthermore, it should be noted that Leonardo da Vinci’s rule was also tested at a microanatomical scale by considering xylem conduit dimensions and comparing it with the Murray law to investigate how branching systems optimize hydraulic flux to woody and leafy organs (McCulloh et al., 2003; Chen
et al., 2012; Price et al., 2014; Carvalho et al., 2017a, b). In Cryptomeria japonica, Yamamoto and Kobayashi (1993)
demonstrated a good correlation between trunk cross-sectional area and the cumulative cross-sectional area of its daughter branches at the top of the tree, where HW is not developed. However, the slope of this linear relationship varied among individuals and was not systematically equal to 1, thus challeng-ing the area-preservchalleng-ing rule. Similarly, in Scots pine (P. sylves-tris), Nikinmaa (1992) observed a significant linear correlation between the diameter of the trunk at the crown base and the sum of living branch cross-sectional area above. However, considerable variation of the slope existed among individuals of the same stand as well as between stands, with an apparent effect of a north-to-south gradient of stand location (the same cross-sectional area supported more branches in the south than in the north). In Quercus petraea, Hatsch (1997) analysed the ratio between (1) the differences in SW area below and above branch insertion and (2) the SW area of the same branch for each branch located in tree crown, in order to estimate the local contribution of the branch in terms of stem SW tapering. For juvenile and adult trees, the ratio was overall <1 with a con-siderable variability that could not be related to any particu-lar branch characteristic (position in the crown, age, size, …). A relationship could also not be identified between the num-ber of rings in SW of branches and the stem. The authors con-cluded that the PMT was not helping to explain this variability. In contrast, Sone et al. (2005, 2009) demonstrated the validity of the area-preserving rule for the whole cross-sectional area of branches in the crown of young Acer trees. However, this rule was not valid for the current-year growth ring area: the average yearly growth of the cross-sectional area of a branch was found to be smaller than the sum of growth of its daughter branches. The authors related this to the fact that the proportion of the current-year growth area relative to the cross-sectional area of the branch is almost always greater for small, young branches than it is for large, old branches. The authors noted that Leonardo da Vinci’s rule would not hold if the decrease in basipetal growth was repeated every year. In summary, the above results show that the Leonardo da Vinci’s rule does not hold in general conditions.
The variability and plasticity of the AL:AS ratio and the scalability of the PMT
The PMT suggests a constant ratio of leaf area to SW area across the tree at one given point in time. A tempting and com-mon, however improper, over-generalization of the theory is to assume this ratio to be constant within a given species irre-spective of the plant’s ontogenetic stage, seasons and environ-mental conditions. Before synthesizing the various results on AL:AS ratio variability, we note that, depending on the studies, different types of variables were used to analyse the relation-ship between an amount of leaves and the SW area supplying water to it (reviewed in Whitehead and Jarvis, 1984, p. 86): (1) some authors consider the leaf area while others measure the leaf mass (e.g. the pipe model ratio in Sattler and Comeau, 2016), which might lead to different results due to the vari-ability of leaf mass per area (LMA) within a set of leaves (Valentine, 2001); (2) some authors consider SW area while others prefer whole-stem/branch sectional area (considering, implicitly or not, that the whole of the section is conductive); and (3) there is a high diversity of approaches used to measure and estimate the SW area if this is the considered variable. As a necessary prerequisite to any synthesis, these methodological aspects will be discussed more precisely in the following sec-tions. It is also important to recall that the constancy of the leaf area/SW area ratio within a species was not explicitly claimed in the original formulation of Shinozaki et al. as discussed above. Consequently, the PMT has been misinterpreted as a species-specific isometric relationship between leaf area and conductive SW area. As no rule describing the variation of the parameter L with tree size was given by Shinozaki et al., a key criticism of the PMT is its non-scalability (Mencuccini et al., 2011).
Studies on the AL:AS ratio have been conducted for a wide range of experimental designs that can be categorized as fol-lows. (1) Even-aged monospecific stands in which only domi-nant or codomidomi-nant trees are considered. In this particular case, it is assumed that selecting samples from stands of various ages sharing similar environments and silvicultural treatments allows us to consider that the different measured trees describe a single chronosequence, i.e. that they share the same developmental trajectory, with the ‘size’ effect directly related to the ontogeny (Magnani et al., 2000; McDowell et al., 2002; Delzon et al., 2004a). (2) Even-aged monospecific stands in which site fertil-ity, stand density or thinning intensities are compared (Brix and Mitchell, 1983; Binkley, 1984; Bancalari et al., 1987; Granier, 1987; Aussenac and Granier, 1988; Long and Smith, 1988;
Pothier and Margolis, 1991; Shelburne et al., 1993; Mencuccini and Grace, 1995; Medhurst and Beadle, 2002; McDowell et al., 2006). (3) Even-aged stands in which trees with different com-petitive status, from suppressed to dominant, are considered (Long and Smith 1988). (4) Natural forest stands in which trees of different sizes are compared without any information on age or growth histories. Most of the published work demonstrates that AL:AS ratios vary among individuals of the same species. Decreases in AL:AS ratios have been reported in particular along the developmental trajectory (Magnani et al., 2000; McDowell
et al., 2002; Barnard and Ryan, 2003; Delzon et al., 2004a) and for increasing size (Albrektson, 1984; Ryan et al., 2000;
Schäfer et al., 2000; Phillips et al., 2001; Fischer et al., 2002;
Kostner et al., 2002; Mokany et al., 2003; Delzon et al., 2004a,
b; Ewers et al., 2005). However, the reverse pattern was also observed (Coyea and Margolis, 1992; McDowell et al., 2002). The decrease in AL:AS ratios with increasing tree size may be a homeostatic mechanism partially compensating for the decrease in hydraulic conductance as trees grow in height (McDowell
et al., 2002). Variations have also been studied according to site fertility (Binkley, 1984; Bancalari et al., 1987; Long and Smith, 1988; Shelburne et al., 1993), site differences in water vapour pressure deficit (Mencuccini and Grace, 1995; McDowell et al., 2006) and species mixture (Binkley, 1984) as well as stand den-sity and thinning practices (Brix and Mitchell, 1983; Granier, 1987; Aussenac and Granier, 1988; Long and Smith, 1988;
Pothier and Margolis, 1991; Shelburne et al., 1993; Medhurst and Beadle, 2002). In summary, previous studies have dem-onstrated that AL:AS ratios should not be considered as merely species-specific, and that, instead, additional parameters should be added to make the PMT scalable with respect to tree ontoge-netic stage and size, social status, site quality or silvicultural practices, thus adding to the flexibility of the PMT from a time-dynamic point of view (Ogawa, 2015).
Estimating crown leaf area and sapwood area independently
Among papers applying the PMT to examine the leaf to SW area ratio AL:AS, two main objectives can be distinguished: (1) to develop methods to evaluate leaf area using non-destruc-tive methods as described in Leaf mass/area section; (2) to test the variability of this ratio with respect to different factors as described in the section The variability and plasticity of the AL:AS ratio and the scalability of the PMT. It is important to note that although the word ‘sapwood’ does not appear in either of the two papers by Shinozaki et al. (1964a, b), it is commonly assumed that this is what the authors meant by the concept of ‘active pipes’ (Valentine, 2001). Disused pipes then correspond to non-conducting xylem, which is often confused with HW (see below). The experimental techniques used to measure the variables AL and AS, at different scales ranging from the whole plant to individual branches, provide more or less direct, precise and independent results. It thus seems important to briefly sum-marize and discuss them, as we do in the following sections. Leaf mass/area. Measuring the foliar area of adult trees can be very tedious (Dean et al., 1988). Indirect techniques have been developed to avoid this experimental work load. A com-mon non-destructive approach consists of using crown length or size to infer leaf area (Cienciala et al., 2006; Cruickshank et al., 2015). This approach relies on the assumption of high correla-tion between crown dimension in terms of biometric parameters and the volume of the assimilation apparatus (Lemke, 1966;
Jelonek et al., 2008; Sattler and Comeau, 2016). More recently, an increasing number of studies based on terrestrial LIDAR scan data open promising prospects for the non-destructive quantification of volumes or biomass of individual tree crowns (Hosoi and Omasa, 2006; Béland et al., 2014; Stovall et al., 2017).
Most other approaches are destructive. In line with the ori-ginal experimental datasets of Shinozaki et al.’s paper, several studies use leaf biomass without converting it to leaf area (Grier and Waring, 1974; Kendall Snell and Brown, 1978; Brix and
Mitchell, 1983; Albrektson, 1984; Granier, 1987; Aussenac and Granier, 1988). In most studies, either the whole crown is stratified into horizontal layers (e.g. Grier and Waring, 1974) or branch whorls (or pseudo-whorls) are considered as distinct layers (e.g. Whitehead, 1978). Thus, the vertical distribution of foliage can be taken into account. In each layer, leaves are usu-ally freshly weighed but can also be dried, sometimes together with the twigs that carry them. Then, dry weight is estimated using fresh weight/dry weight or leaf mass/wood mass conver-sion factors that are calibrated on a sub-sample (e.g. Grier and Waring, 1974). In some studies fresh weight is considered dir-ectly without conversion to dry weight (e.g. Morataya et al., 1999), which is a potential cause of bias.
Other studies consider leaf area. As it is easier to measure total leaf mass than the total leaf area, a common approach is to calculate a mean specific leaf area (SLA) by dividing the total leaf area of a subsample by its dry mass (Gower et al., 1999). As SLA varies within the crown, many authors calculate different SLA values by stratifying the crown into horizontal layers, considering branch categories or/and separating leaves according to their age in evergreen species (e.g. Landsberg
et al., 1997). In some cases, intermediary allometric models at branch level are developed. Because HW is often absent in branches, the entire cross-sectional area is considered as the SW area (Gehring et al., 2015). Statistical models such as gen-eralized linear models are used to predict leaf area from branch size (diameter or length) and/or position. Tree-level leaf area is then calculated via the ‘branch summation method’, in which the branch-level model is applied to each branch and predicted branch leaf area values are added up (Monserud and Marshall, 1999; Fischer et al., 2002; Zellers et al., 2012).
In the following we discuss these different approaches. First, the crown leaf surface in adult trees is always estimated and never actually measured. Potential errors from using allometric rules are never accounted for, and thus biases resulting from the different methods can be difficult to assess. Moreover, in the branch summation method AL and AS cannot really be con-sidered as independently measured given that branch diameters are used to estimate leaf area, before total leaf area is compared with SW area to validate the PMT. This implies that the method used to evaluate the PMT relies itself on a PMT-like approach. Second, using either foliage biomass or leaf area can poten-tially lead to different conclusions. Although some authors have argued against this (Kershaw, 2001), there is evidence that a constant ratio of cross-sectional area to leaf mass does not imply a constant ratio of cross-sectional area to leaf area within the tree crown (Waring et al., 1982; Valentine, 2001). Because SLA can vary by up to a factor of 2 between the top and the bot-tom of the crown, using leaf area instead of mass may reduce the variation in the observed ratio. Third, Gower et al. (1999)
highlighted the fact that the lack of a consensual methodology for defining SLA has caused confusion in the literature and even blurred the conclusions of reviews that do not distinguish between the different methods. For instance, for needle-like leaves both projected and total leaf area differ according to the shape of the leaf (cylinder in some pines or with a square cross-section in black spruce). Adequate adjustments required in the calculation of SLA are still not always standardized in the literature despite the existence of recommended protocols (Cornelissen et al., 2003).
Sapwood area. The SW and HW are classically considered as two distinct functional wood compartments in perennial stems. Fundamentally, this distinction is made on the assumption that SW is physiologically active whereas the HW is the dead part of the wood that no longer contains living cells (Bamber, 1976;
Bamber and Fukazawa, 1985; Hillis, 1987). Heartwood is gen-erally darker than SW, although not always (Hillis, 1977). The term ‘sapwood’ may be misleading from an etymological point of view. As sap is defined as the fluid that circulates in the vascu-lar system of a plant (Zimmermann, 1983), in a literal sense, the term ‘sapwood’ refers to ‘wood’ that transports ‘sap’. However, while SW remains physiologically active until it transforms into HW, particularly in terms of water and carbohydrate storage, there is strong evidence that water conduction along the stem is restricted to the outermost SW (Ziegler, 1968; James et al., 2002; Spicer and Holbrook, 2005). The subdivision of SW into conducting wood (i.e. wood still able to transport water) and storage wood (i.e. wood having mainly storage functions), as proposed by Ziegler (1968), is almost never accounted for in studies considering AL:AS ratios in trees. Hence, depending on the species in question, SW area is measured according to different protocols that are more or less in agreement with the notion of conductive SW.
In most cases, SW is defined visually as the lighter part of the wood cross-section in contrast to the darker HW (Grier and Waring, 1974; Waring et al., 1977; Morataya et al., 1999;
Cruickshank et al., 2015). In other cases, and especially when HW is visually indistinguishable from SW, the latter is deter-mined by examining the differences in light transmission when the cross-section is held against bright light (Kaufmann and Troendle, 1981; Long and Smith, 1988; Barnard and Ryan, 2003;
Delzon et al., 2004b). In some species, wood disc immersion in water can reveal the contrast between HW and SW (Bancalari
et al., 1987); however, the use of passive staining by chemical solutions is often necessary (Kutscha and Sachs, 1962; Waring
et al., 1977; Kendall Snell and Brown, 1978; Whitehead, 1978;
Granier, 1981; Albrektson, 1984; Whitehead and Jarvis, 1984;
Whitehead et al., 1984; Baldwin, 1989; Mencuccini and Grace, 1995; Fischer et al., 2002). The latter approach makes it pos-sible to differentiate between living and dead tissue based on the reaction either with phenolic secondary compounds, which are more frequent in HW, or with starches, which are more fre-quent in SW. Universal pH indicators can also be used follow-ing the principle of differences in acidity between HW and SW (Waring et al., 1980). This first set of methods can be applied to the observation of a wood disc collected from the felled tree. In other cases, they can be applied to wood increment cores from standing trees to measure SW thickness, which is in turn used with stem diameter as input variables to compute SW area. Another method consists in staining the water pathway within the living stem with dye injections (Tyree and Zimmermann, 2002) in order to delineate the conducting SW area. The stained wood region above the injection point is then observed after a few hours (Santiago et al., 2000; Reyes-García et al., 2012;
Pivovaroff et al., 2014). This method is probably the most accurate and least prone to estimation errors.
These methods for measuring the SW area are extremely diverse and lead to estimates that are difficult to compare. In some conifer species, the whole SW remains conductive until it transforms into HW (Swanson, 1966; Ziegler, 1968; Rust et al.,