HAL Id: hal-02121046
https://hal.archives-ouvertes.fr/hal-02121046
Submitted on 26 Nov 2020HAL is a multi-disciplinary open access archive for the deposit and dissemination of sci-entific research documents, whether they are pub-lished or not. The documents may come from teaching and research institutions in France or abroad, or from public or private research centers.
L’archive ouverte pluridisciplinaire HAL, est destinée au dépôt et à la diffusion de documents scientifiques de niveau recherche, publiés ou non, émanant des établissements d’enseignement et de recherche français ou étrangers, des laboratoires publics ou privés.
Matching habitat choice promotes species persistence
under climate change
Felix Pellerin, Julien Cote, Elvire Bestion, Robin Aguilée
To cite this version:
Felix Pellerin, Julien Cote, Elvire Bestion, Robin Aguilée. Matching habitat choice promotes species persistence under climate change. Oikos, Nordic Ecological Society, 2019, 128 (2), pp.221-234. �10.1111/oik.05309�. �hal-02121046�
1
Matching habitat choice promotes species persistence under climate change
1
Félix Pellerin1*, Julien Cote1, Elvire Bestion1,2, Robin Aguilée1 2
Accepted in Oikos – Pelelrrin F, Cote J., Bestion E. & R. Aguilée. 2019. OIkos. 128(2):
3
221-234. DOI : 10.1111/oik.05309
4
1 UMR5174 (Laboratoire Evolution & Diversité Biologique), CNRS, Université Toulouse III
5
Paul Sabatier, 118 route de Narbonne, 31062 Toulouse, France. 6
7
2 Environment and Sustainability Institute, College of Life and Environmental Sciences,
8
University of Exeter, Penryn, Cornwall TR10 9EZ, UK 9
10
felix.pellerin@univ-tlse3.fr ; julien.cote@univ-tlse3.fr ; e.bestion@outlook.com ; 11 robin.aguilee@univ-tlse3.fr 12 13 *Corresponding author: 14 Félix Pellerin 15
Université Toulouse III Paul Sabatier; UMR5174 EDB (Laboratoire Évolution & Diversité 16
Biologique); 118 route de Narbonne, F-31062 Toulouse, France 17
Phone: +33 (0) 5 61 55 60 85, Fax : +33 (0) 5 61 55 73 27, email : felix.pellerin@univ-tlse3.fr;
18 19
2 Abstract:
20
Species may survive under contemporary climate change by either shifting their range or 21
adapting locally to the warmer conditions. Theoretical and empirical studies recently 22
underlined that dispersal, the central mechanism behind these responses, may depend on 23
the match between an individuals’ phenotype and local environment. Such matching habitat 24
choice is expected to induce an adaptive gene flow, but it now remains to be studied whether 25
this local process could promote species’ responses to climate change. Here, we investigate 26
this by developing an individual-based model including either random dispersal or 27
temperature-dependent matching habitat choice. We monitored population composition and 28
distribution through space and time under climate change. Relative to random dispersal, 29
matching habitat choice induced an adaptive gene flow that lessened spatial range loss 30
during climate warming by improving populations' viability within the range (i.e. limiting range 31
fragmentation) and by facilitating colonization of new habitats at the cold margin. The model 32
even predicted in some cases range contraction under random dispersal but range 33
expansion under optimal matching habitat choice. These benefits of matching habitat choice 34
for population persistence mostly resulted from adaptive immigration decision and were 35
greater for populations with larger dispersal distance and higher emigration probability. We 36
also found that environmental stochasticity resulted in suboptimal matching habitat choice, 37
decreasing the benefits of this dispersal mode under climate change. However population 38
persistence was still better under suboptimal matching habitat choice than under random 39
dispersal. Our results highlight the urgent need to implement more realistic mechanisms of 40
dispersal such as matching habitat choice into models predicting the impacts of ongoing 41
climate change on biodiversity. 42
Keywords: species range shift, adaptation, dispersal, gene flow, individual-based model 43
3 Introduction:
45
Contemporary climate change threatens biodiversity worldwide by impacting species 46
persistence and distribution (Parmesan 2006, Selwood et al. 2015, Urban 2015). Species 47
may persist under climate change through two main non-exclusive responses: by tracking 48
suitable climatic conditions across space (geographical range shift, e.g. Hill et al. 2011, Chen 49
et al. 2011) or by adapting to the new local climatic conditions without shifting their 50
geographic range (populations’ phenotypic shift, e.g. Boutin and Lane 2014, Merilä and 51
Hendry 2014). Both responses are strongly influenced by dispersal (i.e. movement from the 52
natal site to the first breeding site, or between successive breeding locations (Howard 53
1960)). Dispersal allows the colonization of new habitats made available by climate change 54
and induces a gene flow affecting population’s phenotypic composition. Assuming that 55
individuals disperse with a constant probability and settle into randomly chosen habitats, 56
gene flow is predicted to swamp local adaptation by bringing non-adapted alleles into 57
populations (Lenormand 2002), which could compromise persistence under climate change 58
(Pease et al. 1989, Polechová et al. 2009). 59
However, dispersal is increasingly recognized to be a non-random process (Bowler 60
and Benton 2005, Edelaar et al. 2008, Clobert et al. 2009, Edelaar and Bolnick 2012, Travis 61
et al. 2012, Lowe and McPeek 2014). The different stages of this process (i.e. departure, 62
transience and settlement) are influenced by individual phenotype, local context and often 63
their match (i.e. matching habitat choice). Variation in the phenotype of individuals may imply 64
variation of fitness in specific environments which should select for inter-individual 65
differences in emigration and immigration decisions according to their fit to local 66
environmental conditions (Edelaar et al. 2008). Individuals are expected to move from 67
habitats where they expect a low fitness and to settle in habitats where they expect a higher 68
fitness, making dispersal an adaptive process. 69
4
Matching habitat choice has been demonstrated in various species (e.g. insects 70
(Karpestam et al. 2012), fishes (Bolnick et al. 2009), birds (Dreiss et al. 2012, Camacho et al. 71
2016, Benkman 2017), reptiles (Cote and Clobert 2007a, Cote et al. 2008)), for different 72
phenotypic traits matching different environmental conditions. For example, in three-spine 73
sticklebacks (Gasterosteus aculeatus), a mark-transplant-recapture experiment showed that 74
dispersers’ preferences for lake and stream habitats depended on lake-like and stream-like 75
morphological attributes (Bolnick et al. 2009). Under stable environmental conditions, 76
matching habitat choice is predicted to promote adaptive gene flow compared to fitness 77
independent dispersal (Holt 1987, Jaenike and Holt 1991, Ruxton and Rohani 1999, 78
Armsworth and Roughgarden 2005a, 2008, Bolnick and Otto 2013, Scheiner 2016). Such 79
adaptive gene flow acts as one of the main factors favoring population adaptation and 80
differentiation on small spatio-temporal scales (Edelaar and Bolnick 2012, Bolnick and Otto 81
2013, Scheiner 2016, Edelaar et al. 2017). Despite the influence of matching habitat choice 82
on local eco-evolutionary dynamics, there remains scope for exploring whether this individual 83
behavioral process acting at a small spatial scale can influence species’ responses to 84
environmental conditions at larger spatial scales. 85
Under variable environmental conditions, matching habitat choice and ensuing 86
adaptive gene flow may locally promote an efficient shift in mean populations’ phenotypes 87
and therefore may influence species’ responses to changing conditions such as ongoing 88
climate change. For example, in ectotherm species, physiology directly depends on external 89
temperature and individuals are characterized by a thermal phenotype (i.e. thermal optimum 90
and tolerance) that links their physiology and performance to temperature (Huey and 91
Stevenson 1979). This thermal phenotype can vary within species and populations (Artacho 92
et al. 2013, Goulet et al. 2017). Thereby, individual thermal optimum may shape individuals’ 93
movements across a landscape through the filter of phenotypic adaptations to varying 94
temperature (Bestion et al. 2015). As climate warming is expected to increase local 95
mismatch between individual thermal optimum and local temperature, matching habitat 96
5
choice may make movements towards more suitable climatic conditions easier and promote 97
an efficient shift of species geographic distribution (Edelaar and Bolnick 2012). However to 98
our knowledge, this verbal prediction remains untested and the underlying mechanisms by 99
which matching habitat choice may influence species’ responses to climate change are still 100
poorly understood. 101
Here we investigate the influence of matching habitat choice on species’ responses to 102
climate change and more precisely how very local mechanisms, here non-random individual 103
movements, could influence species’ global response to environmental change. We used an 104
individual-based model to tackle this question to allow precise integration of such a complex 105
process into the model. Thus, we developed a mechanistic individual-based model 106
representing a virtual species, inspired by the biology of ectotherm species, distributed along 107
a thermal gradient. We modeled two dispersal modes: random dispersal and matching 108
habitat choice. We simulated different rates of climate change and followed populations’ 109
genetic composition through space and time. After quantifying the adaptiveness of gene flow 110
under both dispersal modes, we evaluated the influence of adaptive dispersal on extinction 111
risk at the edges of and within the spatial range, on the proportion of the geographical range 112
within which the species goes extinct during climate change and on the time to species 113
extinction. 114
Methods: 115
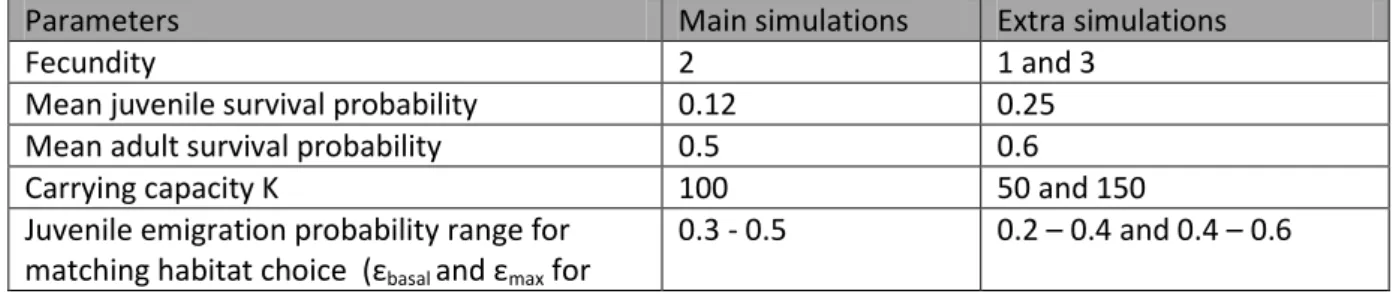
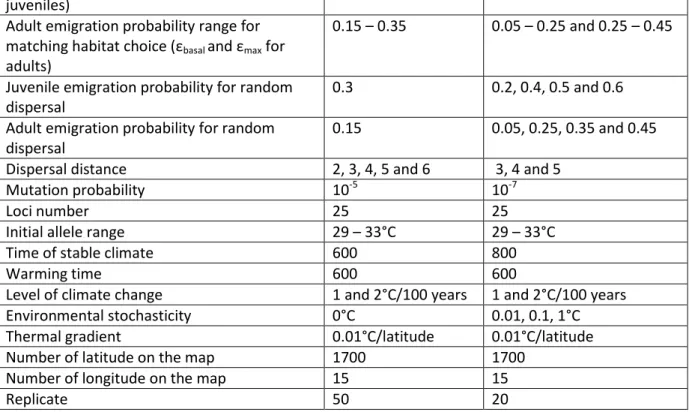
All parameters used in the model are summarized in Table 1. 116
Environment: 117
Individuals were distributed on a two dimensional landscape (i.e. grid map) constituting 1700 118
lines (latitudes) and 15 columns (longitudes) built as a tube to avoid edge effects. A thermal 119
gradient representing mean annual temperatures with 0.01°C increment per space unit 120
occurred along the latitudinal axis. Before climate change, temperature ranged from 19°C to 121
6
36°C, preventing any individual from surviving at the edges of the latitudinal axis according to 122
their initial genotypic/phenotypic values (Table 1) and therefore avoiding edge effects on the 123
latitudinal axis. Temperature along the longitudinal axis was constant (no environmental 124
stochasticity, though see robustness section). We assumed that all map cells could sustain a 125
population with constant carrying capacity K through space and time (i.e. continuous 126
landscape with no unsuitable habitats). We simulated two levels of climate change (1°C or 127
2°C of warming over 100 years) by uniformly increasing temperature at each location through 128
time. 129
Population dynamics and genetics: 130
We modeled a sexual species with two life stages (juveniles and adults). Each individual was 131
characterized by a thermal phenotype represented as a Gaussian function of survival 132
dependency to temperature with constant variance among individuals and mean 133
corresponding to individual thermal optimum: 134
(1)
with S(T) being the survival probability, T the local temperature, σ2 the gaussian variance and 135
Topt the thermal optimum. This optimum was genetically determined by 25 additive
136
independent diploid loci with values taken from real numbers (i.e. genotypic values 137
corresponding to phenotypic ones; the thermal optimum of each individual was thus obtained 138
by averaging all allele values of its genotype). As a complex continuous trait, we considered 139
that the thermal optimum was genetically determined by many independent loci with 140
infinitesimal effects on the phenotypic trait. We arbitrarily chose to fix this number at 25. We 141
assume no environmental effect (i.e. no phenotypic plasticity). In each population at each 142
time step (one time step corresponds to one year), individuals could disperse, then 143
reproduce (adults only) and survive or die (Supplementary material Appendix A: Figure A1). 144
7
Reproduction was independent of temperature. Each adult female produced a 145
number of offspring taken from a Poisson distribution, with a mean fecundity of 2. 146
Reproducing males were randomly chosen from the same patch. For each transmitted allele, 147
mutation occurred with a probability of 10-5 (Table 1). The new allele was taken from a 148
Gaussian distribution centered on the mean parental allele value and of arbitrary variance 149
1.11. With such variance, 95% of new alleles were in a ± 1 interval around the parental 150
value. The sex of offspring was randomly chosen, resulting in a population sex-ratio of 1:1 at 151
birth. 152
At the end of each time step, individuals died or survived. If juveniles survived they 153
became adults and the adult stage lasted until individuals died. Survival probability depended 154
on the match between thermal phenotype and external temperature in juveniles and adults 155
(i.e. Gaussian function of temperature (equation (1)); Supplementary material Appendix A: 156
Figure A1). For each phenotype, the Gaussian function was scaled such that within the 157
temperature range of ± 2.4°C around the optimal temperature (which corresponds to the 158
temperature range in which the non-scaled survival probability was always higher than 0.05), 159
the mean survival probability was equal to 0.12 for juveniles and 0.5 for adults (Table 1). As 160
observed in many species (e.g. Martin 1995 (birds), Pike et al. 2008 (reptiles), Gaillard and 161
Yoccoz 2003 (mammals)), we considered the survival probability to be lower in juveniles than 162
in adults. Survival was also density dependent: when current population size in a patch, N, 163
exceeded carrying capacity K, each individual was killed with a probability 1 − N/K, so that 164
the population size did not exceed on average the carrying capacity after the survival event. 165
The density-dependent survival event occurred after the phenotype-dependent survival 166
event. 167
We implemented two different dispersal modes, random dispersal and matching 168
habitat choice. In the case of matching habitat choice, the departure probability of each 169
individual depended on its expected lifetime reproductive success (LRS) (Le Galliard et al. 170
2008) and was exclusively driven by local thermal adaptation, that is the match between 171
8
individual thermal phenotype and local temperature (i.e. survival probability without density 172
dependence called hereafter thermal survival probability; Supplementary material Appendix 173
A: Figure A1). The lifetime reproductive success was calculated without density dependence 174
for one year (i.e. the adult stage) for adults and for two years (i.e. the juveniles and the adult 175
stage) for juveniles. 176
(2)
with LRSadult and LRSjuvenile being the lifetime reproductive success of adults and juveniles
177
respectively. As we did not know the number of years an individual could live, we assumed 178
the same reproductive success over the years for adults. LRSadult was therefore calculated for
179
one year as calculating LRS over a longer period of time will not change its value. Emigration 180
probability for each individual was calculated as 1-LRS and scaled to mimic realistic 181
dispersal probabilities observed in nature. We considered higher dispersal in juveniles than 182
in adults, as observed in species were natal dispersal is dominant over breeding dispersal 183
(e.g. Greenwood and Harvey 1982). Dispersal probability thus varied from 0.3 to 0.5 for 184
juveniles and from 0.15 to 0.35 for adults (Table 1). The detailed formula was as follow: 185
(3)
with ε the dispersal probability, εbasal the lower dispersal bound (e.g. 0.3 in juveniles), εmax the
186
upper dispersal bound (e.g. 0.5 for juveniles), LRS the lifetime reproductive success 187
(equation (2)) and LRSmax the maximum LRS obtained when individual thermal optimum
188
perfectly matches local temperature. Dispersers could visit all habitats on the perimeter of a 189
circle centered on the middle of the departure habitat and of radius exactly equal to the 190
dispersal distance and settled in the habitat that maximized their lifetime reproductive 191
success (Supplementary material Appendix A: Figure A2). We assumed that dispersers had 192
access to every habitat on that perimeter, including those where only a corner was on the 193
9
circle’s perimeter (i.e. as each habitat corresponded to a square on the map). Habitats at a 194
distance from the departure habitat lower than the dispersal distance cannot be chosen to 195
settle. Within a simulation, dispersal distance was fixed and all individuals thus dispersed at 196
the same distance from their departure habitat. When more than one habitat maximized their 197
lifetime reproductive success, dispersers settled randomly in one of these habitats 198
(Supplementary material Appendix A: Figure A2). 199
In case of random dispersal, individuals dispersed with a constant probability (0.3 for 200
juveniles and 0.15 for adults; Table 1). As the effective dispersal rate in the case of matching 201
habitat choice was not constant over space and time, we set the random dispersal probability 202
to be equal to the lower dispersal probability εbasal from the matching habitat choice scenario.
203
We also ran simulations with random dispersal probability set to the upper dispersal 204
probability εmax from the matching habitat choice mode, allowing us to compare random
205
dispersal with matching habitat choice scenarios for comparable dispersal probability (see 206
robustness section). Dispersers visited all habitats on the perimeter of a circle centered on 207
the middle of the departure habitat and of radius equal to the dispersal distance and settled 208
in a randomly chosen habitat among these visited habitats (Supplementary material 209
Appendix A: Figure A2). Again, all individuals thus dispersed at the same distance from their 210
departure habitat. It allowed us to compared results obtained under matching habitat choice 211
to the random dispersal mode without having differences in the effective dispersal distances 212
between dispersal modes. The results we obtained by comparing simulations under both 213
dispersal modes were thus only due to the direct effect of habitat choice in emigration and 214
immigration decisions. The dispersal distance was fixed within simulations; we ran 215
simulations with five dispersal distances (2, 3, 4, 5, 6 units on the landscape per dispersal 216
event corresponding to a change of 0.02, 0.03, 0.04, 0.05 and 0.06°C on the thermal 217
gradient). 218
To disentangle the influence of emigration from immigration in the matching habitat 219
choice mode, we ran simulations with adaptive emigration only (dispersal probability 220
10
depending on the match between phenotype and habitat of origin but random settlement 221
decision) and adaptive immigration only (fixed dispersal probability but settlement decision 222
depending on the match between phenotype and habitat visited). 223
Simulations: 224
At the beginning of simulations, we built a landscape and implemented a population of size 225
corresponding to the carrying capacity at each location of that landscape (i.e. the entire 226
landscape was inhabited at carrying capacity, fixed at 100 individuals at every location of the 227
map). For each individual, the allele values of the 25 loci determining the thermal optimum 228
were taken from a uniform distribution between 29 and 33°C (Table 1). The initial sex-ratio 229
was 1:1 and the proportions of juveniles and adults were 0.5 each. The system evolved 230
under stable climate for 600 years. As mutations brought new alleles into the populations, the 231
range was not stabilized and the species would invade the landscape after a sufficient time 232
under stable climate. We choose 600 years of stable climate before simulated climate 233
change because it matched the minimum time needed for all phenotypes expressed from the 234
initial distribution of genotypes (i.e. uniform distribution between 29°C and 33°C) to be 235
distributed on the landscape among all parameter values we tested. In the parameter set that 236
led to the widest range size, the individuals were distributed between latitude 100 and 237
latitude 900 corresponding to a range of temperature from 27 to 35°C on the grid. We also 238
ran simulations with 800 years of stable climate and did not observe any difference in the 239
results we obtained from those obtained with 600 years of stable climate (Supplementary 240
material Appendix I: Figure I1-I4). Then we simulated climate change for 600 years with two 241
levels of climate change (1°C and 2°C of warming over 100 years) by uniformly increasing 242
temperature at each location through time. 243
The model was coded in C++ using the GNU Scientific Library for random numbers 244
generation (Galassi et al. 2009) and outputs were analyzed using R3.3.1 (R Development 245
Core Team 2010). 246
11
We show the results for 20 sets of parameters values (2 dispersal modes * 2 levels of 247
climate change * 5 dispersal distances), each one replicated 50 times. Simulations with 248
adaptive emigration only and adaptive immigration only were replicated 20 times. Extra 249
simulations for the robustness of results against various parameters of the model were 250
replicated 20 times. The number of replication was sufficient to obtain very low standard error 251
in our results as running simulations with 40 replicates gave the same results. 252
Outputs: 253
At the end of each time step, we calculated the mean thermal survival probability (i.e. the 254
mean survival probability of all individuals without density dependence) through time for 255
residents, immigrants and emigrants of each population across the range. We then 256
calculated gene flow adaptation as the difference between immigrants’ relative adaptation 257
(i.e. difference between the mean thermal survival probability of immigrants and the mean 258
thermal survival probability of residents of each population) and emigrants’ relative 259
adaptation (i.e. difference between the mean thermal survival probability of emigrants and 260
the mean thermal survival probability of residents of each population). 261
The proportion of range loss was computed as 1-Nt/N0 with Nt the number of
non-262
empty latitudes (i.e. one individual at least was present at the given latitude) at time t and N0
263
the number of non-empty latitudes at time 0 (i.e. just before the start of the climate change). 264
The extinction time was computed as the number of years of climate change needed for all 265
populations to go extinct. When extinction did not occur during the simulation time (600 266
years), extinction time was arbitrarily recorded as 600 years. Range contraction was 267
computed as 1-Rt/R0 with Rt being the range size (difference between extreme occupied
268
latitudes) at time t. Range fragmentation was computed as (Rt – Nt )/Rt. Finally, the local
269
mean thermal fitness load was computed at each location and time as one minus the mean 270
thermal survival probability of residents. 271
Robustness: 272
12
To test for the robustness of our results regarding the influence of major demographic 273
parameters known to impact species’ responses to climate change, we ran additional 274
simulations for different parameter values of mean survival probability, fecundity, carrying 275
capacity and dispersal probability. We varied the basal dispersal probability εbasal from 0.2 to
276
0.4 for juveniles and from 0.05 to 0.25 for adults. For simplicity, the range of variation of the 277
emigration probability for matching habitat choice was fixed at 0.2 in all simulations. We 278
added extra simulations of random dispersal with emigration probability of 0.5 and 0.6 for 279
juveniles and 0.35 and 0.45 for adults, corresponding to the maximal emigration probability at 280
which individuals could disperse in the matching habitat choice simulations. This allowed us 281
to compare results obtained under matching habitat choice and random dispersal with similar 282
dispersal rate. The different values for each parameter are provided in Table 1. 283
We also tested the influence of spatio-temporal environmental stochasticity on our 284
results. Environmental stochasticity could influence species’ responses to climate change 285
because it should reduce the adaptiveness of the immigration decision in matching habitat 286
choice mode (a right choice at time t could be wrong at time t+1). At each time step (i.e. one 287
year), the temperature of each cell of the map was calculated as the current mean 288
temperature of the latitude + γ, with γ being a temperature randomly taken from a uniform 289
distribution centered on 0 and of variance determined by the level of environmental 290
stochasticity. The higher the environmental stochasticity is, the farther the temperature of a 291
habitat can be from the mean temperature of the latitude. An individual that chooses a 292
habitat that fits its phenotype at time t could therefore be maladapted the year after as the 293
temperature changes stochastically. We ran simulations with environmental stochasticity 294
corresponding to the temperature difference between 2 latitudes (0.01°C), 10 latitudes 295
(0.1°C) and 100 latitudes (1°C). Parameters values are summarized in Table 1. 296
We also considered density dependence in matching habitat choice to test for the 297
influence of the other factors involved in dispersal decisions. We thus included the density-298
dependent survival term in the lifetime reproductive success of both juveniles and adults: 299
13 (4)
Finally, we ran simulations with low mutation rate (10-7 per locus; Table 1) to study 300
the influence of mutations on the velocity of range shift. 301
Results: 302
We observed that matching habitat choice induced an adaptive gene flow under climate 303
change (Figure 1A, Supplementary material Appendix 2: Figure B1A, B2A) while gene flow 304
was never adaptive in the random dispersal mode. Such adaptive gene flow resulted in a 305
higher thermal survival probability (i.e. survival probability without density dependence) of all 306
individuals in the case of matching habitat choice than in the case of random dispersal 307
(Figure 1B, Supplementary material Appendix 2: Figure B1B, B2B). In the matching habitat 308
choice mode, we observed that thermal survival probability was generally higher for 309
immigrants than for residents and emigrants excepted at time 0 where thermal survival 310
probability was maximal for all individuals (Figure 1B and Supplementary material Appendix 311
B: Figure B1B, B2B). In some cases, we also observed that residents’ thermal survival 312
probability was higher than emigrants’ thermal survival probability (for example: Figure 1A; 313
Dispersal distance: 2 space units; Time: 200 years). In the matching habitat choice mode, 314
immigrants were therefore better adapted than residents and emigrants were therefore less 315
adapted that residents, resulting in an adaptive gene flow. Conversely, we did not observe 316
14
any difference in thermal survival probability between residents, immigrants and residents 317
from the random dispersal modes (Figure 1B and Supplementary material Appendix B: 318
Figure B1B, B2B), preventing gene flow from being adaptive. 319
The adaptive gene flow due to matching habitat choice decreased the probability that 320
populations go extinct under both climate change scenarios tested and, when extinction 321
occurred, matching habitat choice delayed it (Figure 2C, D). The spatial range loss was 322
always lower with matching habitat choice than when individuals moved randomly (Figure 323
2A, B). The difference in spatial range loss between dispersal modes could be large for some 324
sets of parameters. For example, while climate warming led to an extensive loss of 50 % of 325
the species range under a certain set of parameters of the random dispersal mode, in the 326
matching habitat choice mode the same set of parameters led to an expansion of the spatial 327
range (e.g. Figure 2A, dispersal distance: 3 space units). The spatial range loss was above 328
25% for most of the parameter values in the random dispersal mode (9 out of 10 sets of 329
parameters), while it only surpassed 25% in three out of 10 sets of parameters in the 330
matching habitat choice mode (Figure 2A, B). Furthermore, matching habitat choice almost 331
always allowed species persistence for longer periods of time than random dispersal with a 332
time to extinction up to four times longer in the adaptive than in the random dispersal mode 333
(Figure 2C, D). In the random dispersal mode, species went extinct during simulation time for 334
three out of five dispersal distances under 1°C of warming over 100 years, while extinction 335
was not observed during simulation time under matching habitat choice (Figure 2C). For 336
faster climate change, matching habitat choice always extended time to extinction compared 337
to random dispersal (Figure 2D). 338
Matching habitat choice decreased spatial range loss owing to fewer local extinctions 339
both at the edges of the spatial range and within the spatial range compared to random 340
dispersal. The spatial range was less contracted in the matching habitat choice mode (Figure 341
3A, B), because the colonizing front was moving faster (Figure 4 and Supplementary material 342
Appendix C: Figure C1). This faster colonizing front, closer to the speed of climate change, 343
15
was explained by individuals moving more in the direction of their shifting climatic niche when 344
dispersal was adaptive (Figure 4 and Supplementary material Appendix C: Figure C1). It 345
promoted species’ range shift and reduced population extinction at the edges of the 346
distribution. However for the lowest dispersal distance, the speed of the colonizing front was 347
slower than the speed of the climate, meaning that the range was not shifting as fast as the 348
climatic niche in the case of matching habitat choice, leading to important range size 349
reduction. For higher dispersal distances, the speed of the colonizing front was as fast as or 350
even faster than the speed of climate evolution in the case of matching habitat choice (Figure 351
4C,E). This was never the case in the random dispersal mode. The speed of the colonizing 352
front could be faster than the speed of climate in case of matching habitat choice because of 353
mutations. Mutations allowed new phenotypes to appear and these phenotypes, when 354
dispersal distance was sufficient, could colonize new habitats at the cold margin of the range. 355
Matching habitat choice promoted such colonization and we thus observed a faster 356
colonizing front than the speed of the climate only in the case of matching habitat choice 357
mode. When mutation rate was low, the speed of the colonizing front never overtook the 358
speed of the climate (Supplementary material Appendix C: Figure C2). 359
For all parameter values, matching habitat choice also reduced local population 360
extinctions within the spatial range (Figure 3D,E) compared to random dispersal mode. 361
Under random dispersal mode, extinctions within the range often occurred right behind the 362
colonizing front (Supplementary material Appendix D: Figure D1B). Local maladaptation was 363
indeed high at this location (Supplementary material Appendix D: Figure D1C) because of 364
the non-adaptive gene flow preventing any change in the mean populations’ phenotype in 365
response to climate change (Supplementary material Appendix D: Figure D1D). Under 366
matching habitat choice, adaptive gene flow prevented strong maladaptation behind the 367
colonizing front, reducing fragmentation of the range (Supplementary material Appendix D: 368
Figure D1). 369
16
The influence of matching habitat choice on species’ response to climate change 370
could be explained by adaptive emigration, adaptive immigration or the combination of both. 371
When we modeled adaptive immigration with no adaptive emigration, most results were 372
similar to the scenario where both emigration and immigration were adaptive. Indeed, the 373
spatial range was better maintained (Supplementary material Appendix E: Figure E1A,B), 374
less contracted (Supplementary material Appendix E: Figure E2A,B) and – to a lesser extent 375
– less fragmented (Supplementary material Appendix E: Figure E2C,D) and the extinction 376
time was longer (Supplementary material Appendix E: Figure E1C,D) than under random 377
dispersal for most parameter values. On the contrary, the results with adaptive emigration 378
and no adaptive immigration were similar to those obtained under random dispersal 379
(Supplementary material Appendix E: Figures E1, E2). 380
Dispersal distance had a strong influence on observed patterns. The higher the 381
dispersal distance was, the higher the thermal survival probabilities of residents, of 382
immigrants and of emigrants were, particularly in the matching habitat choice mode (Figure 383
1B, Supplementary material Appendix B: Figure B1B, B2B). While dispersal was always 384
adaptive under matching habitat choice (Figure 1A, Supplementary material Appendix B: 385
Figure B1A, B2A), dispersal distance had to be sufficiently high to maintain a high survival 386
probability through time for all individuals (Figure 1B, Supplementary material Appendix B: 387
Figure B1B, B2B). As dispersal distance positively influenced thermal survival probability, it 388
also positively influenced range loss limitation, time of persistence, limitation of range 389
contraction and range fragmentation (except under random dispersal for a warming of 390
2°C/100 years; see below) and colonization success in the two dispersal modes (Figure 2, 3, 391
4). However, its effect was much larger in the matching habitat choice mode than in the 392
random dispersal mode. For example, an increase of 1 unit in dispersal distance induced a 393
12% reduction in range loss under random dispersal whereas the same increase allowed a 394
shift from a range loss of 45% to a range expansion of 20% under matching habitat choice 395
(Figure 2A; dispersal distance of 2 and 3 units). Dispersal distance also promote species 396
17
range shift under climate change by increasing the speed of the colonizing front in both 397
random dispersal and matching habitat choice (Figure 4). However, despite the positive 398
influence of dispersal distance, matching habitat choice promoted species’ responses to 399
climate change compared to random dispersal even for low dispersal distances (i.e. 2 space 400
units). 401
The only situation where dispersal distance did not positively influence species’ 402
response to climate change was for range contraction under random dispersal and a 403
warming of 2°C/100 years (Figure 3D). In this case, fragmentation was higher for 404
intermediate dispersal distance than for low and high dispersal distances. At low dispersal 405
distance, the range was nearly extinct after 100 years of warming (range loss equal to 1 in 406
case of random dispersal with a dispersal distance of 2 space unit; Figure 2B), preventing 407
fragmentation from being high (if the range is small, extinction within the range should be 408
rare). When dispersal distance increased, the part of the range that remained after 100 years 409
of warming also increased (Figure 2B) allowing fragmentation to rise (Figure 3D). 410
In addition to dispersal distance, we explored the influence of the major demographic 411
parameters of the model that are survival probability, fecundity, carrying capacity and 412
emigration probability, on species’ responses to climate change. We found that our 413
conclusions held for the different parameter values we tested for. In all cases, matching 414
habitat choice reduced range loss during climate change compared to random dispersal 415
(Figure 5). For the majority of parameter values, matching habitat choice also extended 416
extinction time, reduced range contraction and range fragmentation (Supplementary material 417
Appendix F: Figure F1-F3). The higher the survival probability, fecundity, carrying capacity or 418
emigration probability was, the lower the range loss during climate change was for both 419
species performing matching habitat choice and random dispersal. Range loss during climate 420
change however depended much more on survival probability and fecundity than on carrying 421
capacity which had a very low impact (Figure 5). Interestingly, emigration probability had a 422
greater impact on species performing matching habitat choice than on those dispersing 423
18
randomly. For example, a 0.4 increase in juveniles emigration probability reduced range loss 424
of 0.25 during climate change with random dispersal whereas a 0.1 increase in juveniles 425
emigration probability reduced range loss of 0.6 with matching habitat choice (Figure 5, 426
warming = 1°C/100 years). 427
We also tested for the influence of other factors involved in dispersal decisions such 428
as conspecific density. We found that matching habitat choice depending on temperature 429
and local density improved the persistence of populations (i.e. lower extinction rate 430
(Supplementary material Appendix G: Figure G1A,B) and extended time to extinction 431
(Supplementary material Appendix G: Figure G1C,D)) compared to random dispersal, by 432
reducing range contraction (Supplementary material Appendix G: Figure G2A,B) and range 433
fragmentation (Supplementary material Appendix G: Figure G2C,D). Differences between 434
results with and without the dependency of matching habitat choice on local density were 435
well below the range of differences observed between matching habitat choice and random 436
dispersal modes (Figure 2 and 3 versus Supplementary material Appendix G: Figure G1 and 437
G2). 438
Finally, our conclusions also held for the different levels of spatio-temporal 439
environmental stochasticity we tested for, while stochasticity led to less adaptive dispersal 440
decisions. For all parameters values, spatial range loss for matching habitat choice during 441
climate change was lower than, or at least equal to random dispersal (Figure 6). For the 442
majority of parameter values, matching habitat choice also extended extinction time, reduced 443
range contraction and range fragmentation (Supplementary material Appendix H: Figure H1-444
H3). In both dispersal modes, spatial range loss was positively correlated to environmental 445
stochasticity. However, in most cases, environmental stochasticity had a stronger impact on 446
range loss for the matching habitat choice mode than for the random dispersal mode (Figure 447
6A). Indeed, for the different dispersal distances tested, range loss under climate change in 448
case of random dispersal was not impacted by low to moderate environmental stochasticity 449
while range loss was impacted under matching habitat choice, confirming the negative 450
19
influence of environmental stochasticity on the optimality of matching habitat choice. Under 451
very high environmental stochasticity, range loss strongly increased for both dispersal 452
modes. For this high environmental stochasticity, species went extinct in both random 453
dispersal and matching habitat choice for low dispersal distance and a warming of 2°C/100 454
years (Figure 6B) such that the benefit of matching habitat choice on species range loss 455
compared to random dispersal was lost. 456
Discussion: 457
In this study, we demonstrated that matching habitat choice induces an adaptive gene flow 458
enhancing individuals’ mean survival probability, reducing population extinction risk and 459
improving species persistence under climate change compared to random dispersal. We 460
investigated the influence of matching habitat choice on population dynamics and adaptation, 461
revealing the specific mechanisms by which this local-scale dispersal strategy increases 462
population persistence under climate change at a larger scale. Matching habitat choice (i) 463
promotes colonization and therefore species’ range expansion and (ii) reduces population 464
extinction within the range and therefore range fragmentation. 465
Predictions for the probability of extinction and for the time to extinction under random 466
dispersal and matching habitat choice greatly differed in magnitude. We even found 467
qualitatively different predictions in some cases, where the model predicted range 468
contraction under random dispersal while it predicted range expansion under matching 469
habitat choice, especially for large dispersal distances (Figure 2, 3). The predicted 470
differences for the time to extinction can be so large that the species was predicted to go 471
extinct in 200 years in the random dispersal mode while no extinction was recorded for 600 472
years of continuing climate change in the matching habitat choice mode. Therefore, for 473
species performing matching habitat choice efficiently, this dispersal mode has to be 474
considered when predicting populations’ range shift and extinction risk. 475
20
In our model, the benefits of matching habitat choice on species’ responses to climate 477
change depend much more on adaptive immigration than emigration decisions 478
(Supplementary material Appendix E: Figure E1, E2). Emigration decisions depend on 479
individuals gathering information on local thermal conditions and assessing their phenotypic 480
match to these conditions while immigration decisions entail a comparison of thermal 481
conditions throughout the environment. Individuals would therefore have to visit numerous 482
candidate habitats to choose the most suited one (Delgado et al. 2014). Species with low 483
prospecting and dispersal abilities should thus be more at risk facing climate change as they 484
might not be able to visit enough patches to choose habitats adaptively (Edelaar et al. 2008). 485
However, accumulating studies evidenced fine-tuned processes underlying informed 486
dispersal and many species may gather information on surrounding habitats before 487
emigration (Cote and Clobert 2007b, Jacob et al. 2015a). These additional processes may 488
reinforce the effects of adaptive immigration decisions by allowing species to orient their 489
movements towards habitats with suitable thermal conditions. 490
The benefits of performing matching habitat choice compared to random dispersal 491
may therefore depend on species ability to disperse and to gather accurate information on 492
thermal conditions. Our results indeed show that dispersal distance and emigration 493
probability positively influenced the benefit of adaptive gene flow - resulting from matching 494
habitat choice - on population persistence, range fragmentation and range shift as a minimal 495
dispersal distance is required to maintain a high survival probability through time. The 496
minimal dispersal distance corresponded here to a distance from two to three times the 497
distance at which the climatic niche was moving from low to high latitudes (e.g. minimal 498
dispersal distance from 2 space units for a warming of 1°C/100 years). In the conditions of 499
our model, 2 space units corresponded to 0.02°C variations along the gradient. In the real 500
world, a typical annual temperature decrease with latitude is -0.75°C per degree latitude (Van 501
De Water et al. 1994). Given that one degree latitude corresponds approximately to 110km 502
around 45° latitude, dispersal distances of 2 space units in our model correspond to 503
21
distances of 2.93 km for temperate areas. Such distance might be achievable by many 504
species as the mean maximum dispersal distance for species dispersing actively was found 505
to be 9.12 km (Jenkins et al. 2007). We found that above this minimal dispersal distance, 506
species could track climate change without suffering range size reduction. Overall, species 507
with lower dispersal abilities should therefore be more at risk from climate change because 508
they might not be able to track suitable climatic conditions and to choose habitats adaptively 509
(Pearson 2006, Schloss et al. 2012). 510
We think our model could be applied to a large variety of species with good 511
movement skills. However, as outlined above, our model is restricted to species able to 512
perceive variation in thermal conditions and perform matching habitat choices accordingly. 513
Matching habitat choice might therefore be easier to perform on an altitudinal than on a 514
latitudinal axis because of the steeper thermal gradients. In mountain areas, temperature can 515
strongly vary at local spatial scales, allowing species with low dispersal ability and/or low 516
thermal sensitivity to detect and choose habitats with suitable microclimates. However, in 517
lowland areas, species may also be able to perform matching habitat choice as implemented 518
in our model. Climate change may induce important variations during a restricted period of 519
the year (e.g. summer) while changes in mean annual temperature would appear small as in 520
our model. These punctual variations might be enough to influence species dispersal, 521
especially for ectotherms in which small variations near the upper physiological thermal limits 522
induce important fitness changes (Huey et al. 2012). The pertinence of matching habitat 523
choice should nonetheless be ascertained on a case-by-case basis. 524
Our conclusions may further depend on the optimality of dispersal decisions. 525
Suboptimal emigration and immigration decisions can result from low prospecting skills and 526
from variability in climatic conditions and environmental conditions induced by habitat 527
fragmentation or environmental stochasticity. Indeed, in our model, environmental 528
stochasticity led to suboptimal immigration decisions due to temporal low predictability of the 529
climate and to increased range loss in the matching habitat choice mode. Induced 530
22
suboptimal decisions however still increased species persistence under climate change in 531
comparison to random dispersal. This is in accordance with the observations of Edelaar and 532
Bolnick (2012) on population adaptation and differentiation under stable climate for random, 533
suboptimal and optimal immigration decisions. Similarly to environmental stochasticity, 534
landscape fragmentation magnifies dispersal costs and should therefore hamper the 535
exploration of surrounding habitats reducing the optimality of dispersal decisions (Jacob et al. 536
2015b, Cote et al. 2017). Landscape fragmentation might therefore decrease the observed 537
benefits of matching habitat choice and might underpin the expected synergetic effects of 538
climate change and fragmentation on population persistence and spatial range shift 539
dynamics (Brook et al. 2008). This hypothesis remains to be tested. Finally, habitat choice 540
may also become suboptimal in the presence of other major dispersal drivers. For example, 541
intraspecific competition may influence individuals' fitness differently than local thermal 542
conditions (Paterson and Blouin-Demers 2017). Matching habitat choice may therefore 543
depend on adaptation to both local climates and local density. In our model, the responses to 544
climate warming were similar when matching habitat choice depended on both thermal 545
adaptation and local density and when matching habitat choice depended on thermal 546
adaptation only (Supplementary material Appendix G:Figure G1, G2). On top of those 547
discussed above, we expect our conclusions to hold qualitatively for other sources of 548
variation in the optimality of habitat choice. 549
Some other assumptions of our model may be critical to our results. Among these 550
assumptions, selection occurred on survival only. Survival, but not reproductive success, 551
depended on local temperature and density. It implies that non-adapted individuals could 552
reproduce and transmit their genes to the next generation before dying. It should therefore 553
slow down the adaptive process and increase the impact of non-adapted gene flow on 554
population adaptation under random dispersal. If selection was occurring on both 555
reproduction and survival, selection would be stronger and adaptation faster, reducing the 556
transmission of maladapted genes to the next generation and thus the impact of maladapted 557
23
individuals. As a consequence, it should limit the influence of maladaptive gene flow under 558
random dispersal that is involved in range limitation under stable climate (Kirkpatrick and 559
Barton 1997, Lenormand 2002, Bridle and Vines 2007) and may reduce the observed 560
differences in population extinction and species’ range shift between random dispersal and 561
matching habitat choice. However, our conclusions should qualitatively hold as matching 562
habitat choice promotes dispersal and gene flow in the direction of the moving climatic niche 563
compared to random dispersal. Colonization of new habitats should therefore remain higher 564
under matching habitat choice than under random dispersal. 565
Matching habitat choice positively influenced species’ responses to climate change by 566
limiting the mismatches between individuals’ phenotypes and local environments (Figure 1A). 567
Phenotypic plasticity may also limit such mismatches. Phenotypic plasticity has been 568
demonstrated to influence species’ responses to climate change by limiting range size 569
reduction (Valladares et al. 2014). Recent models allowing evolution of both matching habitat 570
choice and phenotypic plasticity demonstrated that under temporally stable climate (i.e. no 571
change in the mean temperature in the landscape but environmental stochasticity 572
integrated), phenotypic plasticity evolved more frequently than matching habitat choice 573
(Scheiner 2016, Edelaar et al. 2017). However under climate change, phenotypic plasticity 574
might delay evolutionary response in the long term, whereas matching habitat choice 575
promotes it by inducing an adaptive gene flow (Valladares et al. 2014). Under such 576
conditions, the benefit of phenotypic plasticity could be lower than those of matching habitat 577
choice, promoting the evolution of the latter. On the other hand, phenotypic plasticity could 578
limit the mismatch between phenotypes and climate until the limits of plasticity are reached. If 579
plasticity evolved, it could allow further coping with environmental change without any 580
evolutionary change of the traits under selection. Depending on the cost of plasticity and 581
matching habitat choice, both mechanisms could thus evolve to facilitate species’ responses 582
to climate change. Future models could tackle this question by allowing the evolution of both 583
24
phenotypic plasticity and matching habitat choice under a continuous period of climate 584
change. 585
The influence of informed dispersal on local adaptation and population differentiation 586
has been theoretically well-studied (Holt 1987, Armsworth and Roughgarden 2005a, b, 2008, 587
Ravigné et al. 2009, Bolnick and Otto 2013, Holt and Barfield 2015). Others have 588
investigated its evolution under various conditions (Travis et al. 1999, 2009, Hovestadt et al. 589
2010, Scheiner 2016, Edelaar et al. 2017) and its feedback effect on dispersal propensity, 590
range limits and range expansion (Enfjäll and Leimar 2009, Kubisch et al. 2010, 2011, 591
Bocedi et al. 2014, Poethke et al. 2016). Here we investigated the effect of a particular type 592
of informed dispersal, matching habitat choice, on species’ responses to climate change. 593
Using a simple model with robust predictions, we showed that neglecting these mechanisms 594
may lead to inaccurate estimates of species extinction risk and spatial range shift. Similarly, 595
matching habitat choice should greatly affect predictions of population dynamics, 596
evolutionary adaptation, species interactions, and changes in community composition in 597
response to climate warming. While our model focused on the match between thermal 598
optimum and external temperature, conclusions should be similar for any other phenotypic 599
trait interacting with environmental variables affected by contemporary global change (e.g. 600
hygrometry and UV intensity). We therefore recommend future research to pay more 601
attention to matching habitat choice when studying populations’ dynamics and spatial range 602
shift to improve model predictions and management policies. 603
Data accessibility: 604
Source code of the simulations will be deposited on Dryad upon acceptance. 605
Competing interests: 606
The authors declare no competing financial interests. 607
Authors’ contributions: 608
25
EB and JCo designed the study. All authors developed the model. FP analyzed the results 609
and all authors discussed them. FP wrote the first draft of the manuscript and all authors 610
contributed substantially to revisions. 611
Funding: 612
F. P. was supported by a PhD fellowship from the French “Ministère de la Recherche et de la 613
Technologie”. JCo was supported by an ANR-12-JSV7-0004-01 and by the ERA-Net 614
BiodivERsA, with the national funder ONEMA, part of the 2012-2013 BiodivERsA call for 615
research proposals. EB was supported by a young researchers’ award from the Bettencourt-616
Schueller foundation. This work was supported by the French Laboratory of Excellence 617
project “TULIP” (ANR-10-LABX-41). This work was performed using the cluster EDB-Calc 618
(which includes software developed by the Rocks(r) Cluster Group at the San Diego 619
Supercomputer Center, University of California) of the laboratory “Evolution et Diversité 620
Biologique”. 621
Acknowledgements: 622
We are grateful to S. Meylan, O. Ronce and E. Fronhofer for comments and suggestions on 623
the models and results. We thank Pim Edelaar, Justin Travis and reviewers for their useful 624
comments on the manuscript. We thank Aïsha Bruendl for editing the manuscript. We thank 625
P. Solbès for support on the EDB-Calc system. 626
26 References:
628
Armsworth, P. R. and Roughgarden, J. E. 2005a. The impact of directed versus random movement on 629
population dynamics and biodiversity patterns. - Am. Nat. 165: 449–465. 630
Armsworth, P. R. and Roughgarden, J. E. 2005b. Disturbance induces the contrasting evolution of 631
reinforcement and dispersiveness in directed and random movers. - Evolution 59: 2083– 632
2096. 633
Armsworth, P. R. and Roughgarden, J. E. 2008. The structure of clines with fitness-dependent 634
dispersal. - Am. Nat. 172: 648–657. 635
Artacho, P. et al. 2013. Interindividual variation in thermal sensitivity of maximal sprint speed, 636
thermal behavior, and resting metabolic rate in a lizard. - Physiol. Biochem. Zool. 86: 458– 637
469. 638
Benkman, C. W. 2017. Matching habitat choice in nomadic crossbills appears most pronounced when 639
food is most limiting. - Evolution 71: 778–785. 640
Bestion, E. et al. 2015. Dispersal response to climate change: scaling down to intraspecific variation. - 641
Ecol. Lett. 18: 1226–1233. 642
Bocedi, G. et al. 2014. Mechanistic modelling of animal dispersal offers new insights into range 643
expansion dynamics across fragmented landscapes. - Ecography 37: 1240–1253. 644
Bolnick, D. I. and Otto, S. P. 2013. The magnitude of local adaptation under genotype-dependent 645
dispersal. - Ecol. Evol. 3: 4722–4735. 646
Bolnick, D. I. et al. 2009. Phenotype-dependent native habitat preference facilitates divergence 647
between parapatric lake and stream stickleback. - Evolution 63: 2004–2016. 648
Boutin, S. and Lane, J. E. 2014. Climate change and mammals: evolutionary versus plastic responses. - 649
Evol. Appl. 7: 29–41. 650
Bowler, D. E. and Benton, T. G. 2005. Causes and consequences of animal dispersal strategies: 651
relating individual behaviour to spatial dynamics. - Biol. Rev. 80: 205–225. 652
Bridle, J. R. and Vines, T. H. 2007. Limits to evolution at range margins: when and why does 653
adaptation fail? - Trends Ecol. Evol. 22: 140–147. 654
Brook, B. W. et al. 2008. Synergies among extinction drivers under global change. - Trends Ecol. Evol. 655
23: 453–460. 656
Camacho, C. et al. 2016. Natal habitat imprinting counteracts the diversifying effects of phenotype-657
dependent dispersal in a spatially structured population. - BMC Evol. Biol. 16: 158–167. 658
Chen, I.-C. et al. 2011. Rapid range shifts of species associated with high levels of climate warming. - 659
Science 333: 1024–1026. 660
Clobert, J. et al. 2009. Informed dispersal, heterogeneity in animal dispersal syndromes and the 661
dynamics of spatially structured populations. - Ecol. Lett. 12: 197–209. 662
27
Cote, J. and Clobert, J. 2007a. Social personalities influence natal dispersal in a lizard. - Proc. R. Soc. B 663
Biol. Sci. 274: 383–390. 664
Cote, J. and Clobert, J. 2007b. Social information and emigration: lessons from immigrants. - Ecol. 665
Lett. 10: 411–417. 666
Cote, J. et al. 2008. Social personality trait and fitness. - Proc. R. Soc. B Biol. Sci. 275: 2851–2858. 667
Cote, J. et al. 2017. Evolution of dispersal strategies and dispersal syndromes in fragmented 668
landscapes. - Ecography 40: 56–73. 669
Delgado, M. M. et al. 2014. Prospecting and dispersal: their eco-evolutionary dynamics and 670
implications for population patterns. - Proc. R. Soc. Lond. B Biol. Sci. 281:2013–2851. 671
Dreiss, A. N. et al. 2012. Local adaptation and matching habitat choice in female barn owls with 672
respect to melanic coloration. - J. Evol. Biol. 25: 103–114. 673
Edelaar, P. and Bolnick, D. I. 2012. Non-random gene flow: an underappreciated force in evolution 674
and ecology. - Trends Ecol. Evol. 27: 659–665. 675
Edelaar, P. et al. 2008. Matching habitat choice causes directed gene flow: a neglected dimension in 676
evolution and ecology. - Evolution 62: 2462–2472. 677
Edelaar, P. et al. 2017. Should I change or should I go? Phenotypic plasticity and matching habitat 678
choice in the adaptation to environmental heterogeneity. - Am. Nat. 190: 506–520. 679
Enfjäll, K. and Leimar, O. 2009. The evolution of dispersal – the importance of information about 680
population density and habitat characteristics. - Oikos 118: 291–299. 681
Gaillard, J.-M. and Yoccoz, N. G. 2003. Temporal variation in survival of mammals: A case of 682
environmental canalization? - Ecology 84: 3294–3306. 683
Galassi, M. et al. 2009. GNU Scientific Library Reference Manual - 3rd Ed. 684
Goulet, C. T. et al. 2017. Repeatability and correlation of physiological traits: Do ectotherms have a 685
“thermal type”? - Ecol. Evol. 7: 710–719. 686
Greenwood, P. J. and Harvey, P. H. 1982. The natal and breeding dispersal of birds. - Annu. Rev. Ecol. 687
Syst. 13: 1–21. 688
Hill, J. K. et al. 2011. Climate change and evolutionary adaptations at species’ range margins. - Annu. 689
Rev. Entomol. 56: 143–159. 690
Holt, R. D. 1987. Population dynamics and evolutionary processes: the manifold roles of habitat 691
selection. - Evol. Ecol. 1: 331–347. 692
Holt, R. D. and Barfield, M. 2015. The influence of imperfect matching habitat choice on evolution in 693
source–sink environments. - Evol. Ecol. 29: 887–904. 694
Hovestadt, T. et al. 2010. Information processing in models for density-dependent emigration: A 695
comparison. - Ecol. Model. 221: 405–410. 696
Howard, W. E. 1960. Innate and environmental dispersal of individual vertebrates. - Am. Nat. 63: 697
152–161. 698
28
Huey, R. B. and Stevenson, R. 1979. Integrating thermal physiology and ecology of ectotherms: a 699
discussion of approaches. - Am. Zool. 19: 357–366. 700
Huey, R. B. et al. 2012. Predicting organismal vulnerability to climate warming: roles of behaviour, 701
physiology and adaptation. - Philos. Trans. R. Soc. B Biol. Sci. 367: 1665–1679. 702
Jacob, S. et al. 2015a. Social information from immigrants: multiple immigrant‐based sources of 703
information for dispersal decisions in a ciliate. - J. Anim. Ecol. 84: 1373–1383. 704
Jacob, S. et al. 2015b. Habitat matching and spatial heterogeneity of phenotypes: implications for 705
metapopulation and metacommunity functioning. - Evol. Ecol. 29: 851–871. 706
Jaenike, J. and Holt, R. D. 1991. Genetic variation for habitat preference: evidence and explanations. - 707
Am. Nat. 137: S67–S90. 708
Jenkins, D. G. et al. 2007. Does size matter for dispersal distance? - Glob. Ecol. Biogeogr. 16: 415–425. 709
Karpestam, E. et al. 2012. Matching habitat choice by experimentally mismatched phenotypes. - Evol. 710
Ecol. 26: 893–907. 711
Kirkpatrick, M. and Barton, N. H. 1997. Evolution of a species’ range. - Am. Nat. 150: 1–23. 712
Kubisch, A. et al. 2010. On the elasticity of range limits during periods of expansion. - Ecology 91: 713
3094–3099. 714
Kubisch, A. et al. 2011. Density-dependent dispersal and the formation of range borders. - Ecography 715
34: 1002–1008. 716
Le Galliard, J.-F. et al. 2008. Lifetime and intergenerational fitness consequences of harmful male 717
interactions for female lizards. - Ecology 89: 56–64. 718
Lenormand, T. 2002. Gene flow and the limits to natural selection. - Trends Ecol. Evol. 17: 183–189. 719
Lowe, W. H. and McPeek, M. A. 2014. Is dispersal neutral? - Trends Ecol. Evol. 29: 444–450. 720
Martin, K. 1995. Patterns and Mechanisms for Age-dependent Reproduction and Survival in Birds. - 721
Am. Zool. 35: 340–348. 722
Merilä, J. and Hendry, A. P. 2014. Climate change, adaptation, and phenotypic plasticity: the problem 723
and the evidence. - Evol. Appl. 7: 1–14. 724
Parmesan, C. 2006. Ecological and evolutionary responses to recent climate change. - Annu. Rev. 725
Ecol. Evol. Syst. 37: 637–669. 726
Paterson, J. E. and Blouin-Demers, G. 2017. Density‐dependent habitat selection predicts fitness and 727
abundance in a small lizard. - Oikos in press. 728
Pearson, R. G. 2006. Climate change and the migration capacity of species. - Trends Ecol. Evol. 21: 729
111–113. 730
Pease, C. M. et al. 1989. A model of population growth, dispersal and evolution in a changing 731
environment. - Ecology 70: 1657–1664. 732