HAL Id: hal-03146199
https://hal.archives-ouvertes.fr/hal-03146199
Submitted on 18 Feb 2021
HAL is a multi-disciplinary open access
archive for the deposit and dissemination of
sci-entific research documents, whether they are
pub-lished or not. The documents may come from
teaching and research institutions in France or
abroad, or from public or private research centers.
L’archive ouverte pluridisciplinaire HAL, est
destinée au dépôt et à la diffusion de documents
scientifiques de niveau recherche, publiés ou non,
émanant des établissements d’enseignement et de
recherche français ou étrangers, des laboratoires
publics ou privés.
Measurement and modelling of gaseous elemental iodine
(I2) dry deposition velocity on grass in the environment
Oumar Telly Bah, Didier Hebert, Olivier Connan, Luc Solier, Philippe
Laguionie, Didier Bourles, Denis Maro
To cite this version:
Oumar Telly Bah, Didier Hebert, Olivier Connan, Luc Solier, Philippe Laguionie, et al..
Mea-surement and modelling of gaseous elemental iodine (I2) dry deposition velocity on grass in
the environment.
Journal of Environmental Radioactivity, Elsevier, 2020, 219, pp.106253.
�10.1016/j.jenvrad.2020.106253�. �hal-03146199�
Measurement and modelling of gaseous elemental iodine (I
2) dry
1
deposition velocity on grass in the environment
2
3
Oumar Telly Bah(1,2)*, Didier Hébert1, Olivier Connan1, Luc Solier1, Philippe Laguionie1, Didier Bourlès2, Denis Maro1.
4
1Institut de Radioprotection et de Sûreté Nucléaire, PSE-ENV/SRTE/LRC, BP 10, Rue Max-Pol Fouchet, 50130 Cherbourg
5
Octeville, France.
6
oumar-telly.bah@irsn.fr, didier.hebert@irsn.fr, olivier.connan@irsn.fr, luc.solier@irsn.fr, philippe.laguionie@irsn.fr
7
denis.maro@irsn.fr
8
2Aix-Marseille Univ., CNRS, IRD, INRAE, Coll France, UM 34 CEREGE, Technopôle de l’Environnement
Arbois-9
Méditerranée, BP80, 13545 Aix-en-Provence, France.
10
bourles@cerege.fr
11
* Corresponding author:
12
E-mail address: oumar-telly.bah@irsn.fr
13
IRSN
14
Cherbourg-Octeville Radioecology Laboratory (LRC)
15
Rue Max Pol Fouchet
16
BP10- 50130 Cherbourg-Octeville
17
Tel: +33 (0)2 33 01 41 16
18
19
Abstract
20
Assessing the impact of radioactive iodine on humans subsequent to a nuclear accident requires a better understanding of its
21
behaviour in the environment. An original approach aimed at developing a model constrained by data collected during
22
experimental campaigns has been developed. These experimental campaigns, named MIOSEC 2 and MIOSEC 3
23
respectively, were conducted in the middle of grassland. They are based on emissions of gaseous elemental iodine (I2) into
24
the atmosphere above the grassland to determine the dry deposition velocities of iodine on the grass and to model these
25
velocities as a function of the environmental conditions, particularly wind friction velocity, sensible heat flux, and stomatal
26
resistance. The measured dry deposition velocities were between 0.02 and 0.49 cm.s-1 during MIOSEC 2, varying by more
27
than one order of magnitude, and between 0.48 and 1.25 cm.s-1 during MIOSEC 3. The dry deposition model for iodine
28
developed as a result of these experiments relies on the micrometeorological characteristics of the atmospheric surface
29
layer, the pertinent physical and chemical properties of the iodine and the surface properties of the grass; all the se
30
parameters were measured at the time of the experiments. Given the experimental conditions, the modelled dry deposition
31
velocities varied between 0.11 and 0.51 cm.s-1 during MIOSEC 2 and between 0.31 and 1.6 cm.s-1 during MIOSEC 3. The
32
dry deposition model for iodine indicates that the variations in deposition velocity are induced by the mechanical
33
turbulence, since there is significant correlation between the dry deposition velocities of iodine and the wind friction
34
velocities on grass. The model also s hows that the higher deposition velocity values during MIOSEC 3 are due to the fact
that the stomata were more open during the experiments. There is also significant correlation between the experimental
36
results and modelled values both for MIOSEC 2 (R2 = 0.61) and for MIOSEC 3 (R2 = 0.71).
37
38
Keywords: Elemental iodine, environment, emission, grass, dry deposition velocity.
39
1. Introduction
40
Iodine is a trace element in the halogen family. It is essential for thyroid function in animals. Iodine has 37 isotopes
41
with mass numbers ranging from 108 to 144. Iodine-127 is the only stable isotope of iodine. All the other isotopes of iodine
42
are radioactive. Thirteen are fission products, including iodine-129 which has the longest half-life (15.7 million years) and
43
iodine-131 which has a half-life of 8.02 days. Most iodine is found in the marine environment (˃70%), in dissolved forms at
44
concentrations of between 45 and 60 µg.L-1 (Fuge, 1996; Wong, 1991). It can also be found on land at concentrations
45
influenced, among other parameters, by proximity to oceans, by the organic composition of the environment, by ground
46
topography and by the bioavailability of molecules containing iodine. The mechanisms of iodine transfer into the
47
atmosphere from marine and terrestrial environments are not known, but the most likely is volatilization. In acid condition,
48
the iodine present in seawater in ionic form is liable to volatilize as I2, whereas in neutral or alkaline condition,
49
volatilization is unlikely (Fuge, 1996; Hou et al., 2009). In addition, iodine can volatilize in the form of organic compounds,
50
e.g. ICH3, due to the oxidation of residues of plants such as seaweed (Fuge, 1996; Whitehead, 1984). The iodine (127I)
51
concentrations measured in the atmosphere are between 10 and 100 ng.m-3, taking account of all physico-chemical forms
52
(Truesdale et al., 2012). Other sources of atmospheric iodine (129I and/or 131I) are spontaneous uranium (238U) fission,
53
nuclear testing, releases from spent fuel reprocessing plants and emissions from nuclear power plants in normal or accident
54
operating conditions.
55
During a nuclear accident, radioactive iodine (131I) is released into the environment (Parache et al., 2011; Zhou,
56
1995). In the atmosphere, radioactive iodine diffuses in the same way as any other gas (Chamberlain and Chadwick, 1966).
57
With oxidation states ranging from -1 to +5, the overall biogeochemical cycle of iodine is quite complex and involves
58
various processes (Carpenter, 2003; Saiz-Lopez et al., 2012). Its high reactivity means that iodine, including radioactive
59
iodine, changes rapidly in the environment through photolysis and reacts with other atmospheric compounds includin g
60
ozone and nitrogen compounds (Carpenter, 2003; Hou et al., 2009; Noguchi and Murata, 1988). Because of this, radioactive
61
iodine is present in the atmosphere in several physico-chemical forms: particulate (associated with atmospheric aerosol
62
particles) and gaseous. The gaseous forms are inorganic: I2, HI, HIO, and organic: CHI3, CH2I2, CH3CH2CH2I. Radioactive
63
iodine concentrations can vary not only according to distance from the discharge stack (Thakur et al., 2013), but also
64
according to season and climate when the radioactive half-life allows (Hou et al., 2009).
65
Subsequent to an accident, particular attention should be paid to the deposition mechanism of the iodine, which can
66
be found in cows' milk via grazing, then in humans by milk drinking or by direct ingestion of fresh vegetables, where it can
67
cause thyroid cancer. Deposition can occur in dry weather (dry deposition) or wet weather (wet deposition), and is
68
quantified by velocity. Numerous studies have shown that the dry deposition velocities of iodine are highly dependent on
69
the one hand on the state of iodine in the atmosphere: gaseous or particulate including in this last case the particle size, and
70
on the other on the chemical species encountered (Nielsen, 1981; Noguchi and Murata, 1988). On grass, the dry deposition
velocity of gaseous elemental iodine measured in the environment by Chamberlain and Chadwick (1966) was 1.8 cm.s-1,
72
while Karunakara et al. (2018) measured dry deposition velocities of between 0.5 × 10⁻³ and 3.3 × 10⁻³ cm.s-1 in an
73
environmental chamber. These values differ by several orders of magnitude, since no parameterisation was done for
74
meteorological values or surface properties of the grass.
75
This study aims to quantify and model the dry deposition velocities of gaseous elemental iodine (I2) on grass based
76
on experiments conducted in the environment. The experiments consisted in emitting gaseous elemental iodine into the
77
atmosphere during a limited period of time in the absence of precipitation and quantifying the quantities of iodine deposited
78
on grass test specimens placed downwind of the emission point. In case of rain during I2 emission, I2 can be absorbed by the
79
rain drops, which will lead to modification of global transfer depending on the solubility of iodine and rain intensity (via
80
drops size) and consequently, a modification of the deposition velocity. Because the average iodine concentrations in the
81
atmosphere above the test specimens were known, dry deposition velocities were calculated and parameterised for wind
82
friction velocity, sensible heat flux and stomatal resistance.
83
2. Methodology
84
A. Measurement of iodine dry deposition velocities on grass
85
1. Equations
86
The iodine dry deposition velocities were calculated by dividing the iodine dry deposition fluxes by the atmospheric
87
concentrations of iodine. For this purpose, the iodine dry deposition fluxe s were obtained by dividing the iodine
88
concentrations measured on the grass by the iodine emission time (Eq. (1)). The deposition velocities were then determined
89
by dividing the mean iodine dry deposition fluxes on the 2 squares of grass for each of the experiments by the mean
90
atmospheric iodine concentrations in the corresponding 2 bubbler flasks (Eq. (2)).
91
⁄ (1)
Where F is the iodine dry deposition flux (µg.m-2.s-1); Cd is the iodine concentration deposited on the grass (µg.m-2) and t is
92
the emission time (s).
93
⁄ (2)
Where Vd is the iodine dry deposition velocity (m.s-1) and Ca (z) the atmospheric iodine concentration (µg.m-3) at the height
94
z at which the air is sampled.
95
To obtain the iodine concentrations in the air and on the grass, several experiments based on gaseous elemental
96
iodine emissions were conducted on an experimental site in the middle of grassland.
97
2. Description of the measurement site
98
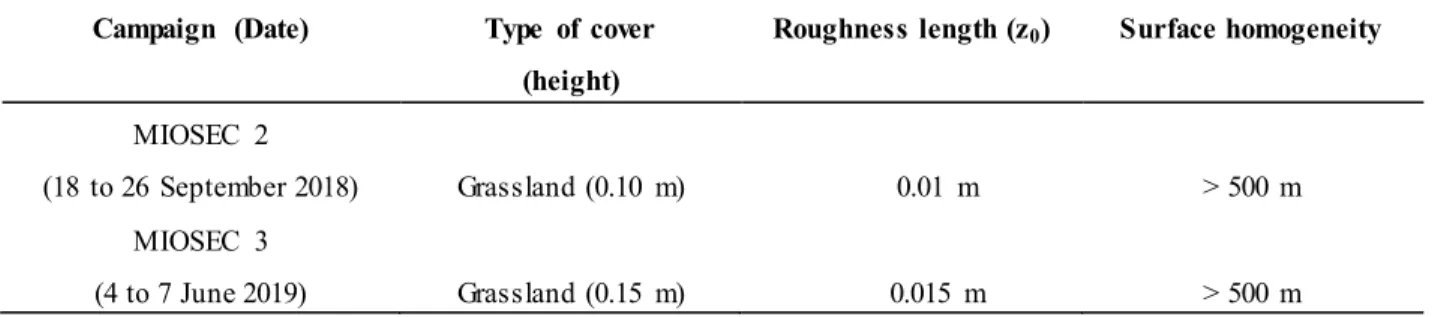
Two experimental campaigns, entitled MIOSEC 2 and MIOSEC 3, were conducted in the middle of grassland on an
99
experimental site of the French National Institute for Agricultural Research (INRA) at Lusignan (France) (46°24, 02’N; 0°7,
04’E). MIOSEC 2 ran from 18 to 26 September 2018 and MIOSEC 3 from 4 to 7 June 2019. During MIOSEC 2, at any
101
point approximately 500 m from the experiment, the grass was 0.10 m high and its mean roughness length (z0) was 0.01 m.
102
During MIOSEC 3, at any point approximately 500 m from the experiment, the grass was 0.15 m high and its mean
103
roughness length (z0) was 0.015 m (Table 1). The roughness lengths given are approximated on the basis of the grass height
104
(z0/z = 0.1) (Pellerin et al., 2017). During the two measurement campaigns, the grass consisted mainly of Lolium perenne
105
and Dactylis.
106
107
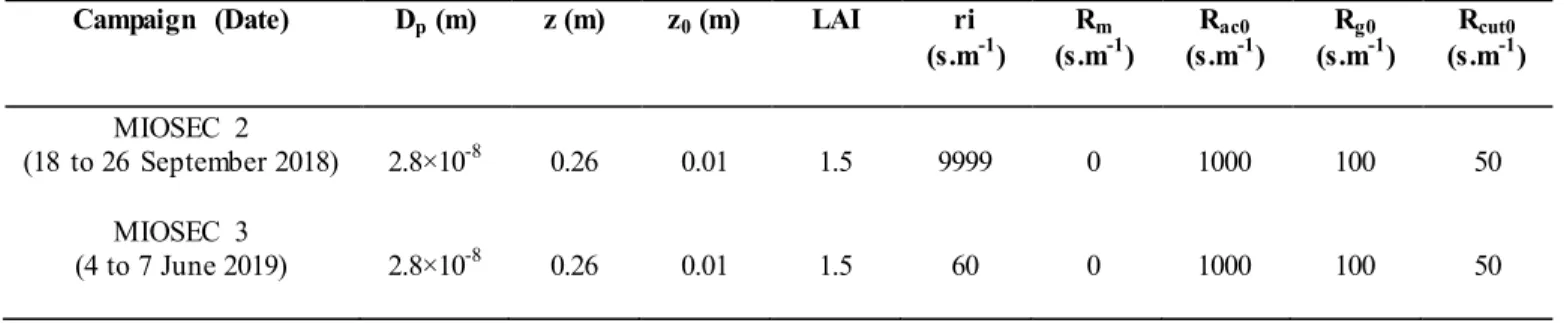
Table 1: Description of the measurement site.
108
Campaign (Date) Type of cover (height)
Roughness length (z0) Surface homogeneity MIOSEC 2 (18 to 26 September 2018) Grassland (0.10 m) 0.01 m > 500 m MIOSEC 3 (4 to 7 June 2019) Grassland (0.15 m) 0.015 m > 500 m
109
110
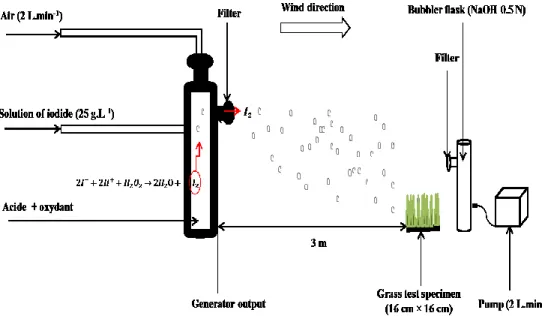
3. Iodine emissions
111
The measurement campaigns use gaseous elemental iodine emissions produced using an iodine generator designed
112
previously. To generate the iodine, 20 ml of a KI solution (25 g.L-1) are added drop by drop to a mixture of 100 ml of H 2SO4
113
(10%) and 100 ml of H2O2 (35%) for 30 minutes. Each iodide (I-) droplet added to the mixture leads to the formation in
114
solution of gaseous elemental iodine (I2). The gaseous form I2 is entrained by a 2 L.min-1 air flow running continuously for
115
the 30-minute emission duration. A filter is placed at the iodine generator output to stop any iodine particles that might form
116
inside the tube connected to the generator output (Fig. 1).
117
The homogeneity of iodine release from generator was validated during the generator design. Two flask each
118
containing 100 ml of NaOH (0.5 N) are directly connected to the output of generator to trap iodine. In the event that the
119
totality of iodine is not trapped in the first flask, the iodine excess is trapped in the second. Each 5 minutes, iodine
120
generation is stopped, and the 2 flasks are replaced by 2 others. This operation is repeated 6 times, corresponding to the to tal
121
duration of iodine emission (30 minutes). The measurement of the total iodine in the first flask validated the protocol for
122
iodine trapping in 100 ml of NaOH (0.5 N). Iodine concentrations measured in the different flasks are the same.
123
Consequently, iodine release from generator is homogeneous during the 30 minutes.
125
Fig. 1. Emission of gaseous elemental iodine, sampling from the atmosphere and grass.
126
127
4. Collection and treatment of the samples (including blanks)
128
Two cellulose filters (0.45 µm) are placed between the emission point and the sampling points to collect any iodine
129
particles that form during emission. Depending on the wind direction, 2 squares of grass (Lolium perenne) measuring 16 cm
130
× 16 cm each are placed 3 m from the generator output to collect the deposited iodine. Each experiment being carried out
131
during 30 minutes and “field loss half-life” for elemental iodine being determined (13 days) on grassland in the growing
132
season (Whitehead, 1984), re-volatilization is therefore very low during 30 minutes and has not been determined.
133
134
Two flasks, each containing 100 mL of NaOH (0.5 N) are placed approximately 5 cm from the squares of grass to
135
collect the atmospheric iodine, by means of sparging at a rate of 2 L.min-1 using a pump connected to the flask output (Fig.
136
1). A filter is placed at the input of each bubbler flask to collect any iodine particles. 14 and 8 experiments were conducted
137
during MIOSEC 2 and MIOSEC 3, respectively. After each experiment, the sample were collected and treated.
138
For each of the experiments, a grass blank and an atmospheric blank were made by placing at 50 m from emission
139
point, a 16 cm x 16 cm square of grass and a bubbler flask containing 100 ml of NaOH (0.5 N), respectively.
140
The particulate iodine fraction was collected by placing each of the filters in 50 ml of NaOH (0.5 N). After vigorous
141
homogenisation, the whole mixture was filtered.
142
To determine the quantities of iodine emitted into the atmosphere, the samples collected from the bubbler flasks were
143
filtered. The atmospheric blank was treated in the same way as the samples from the bubbler flasks.
144
The quantities of iodine deposited were determined from the grass. The squares of grass were cut so as to collect the
145
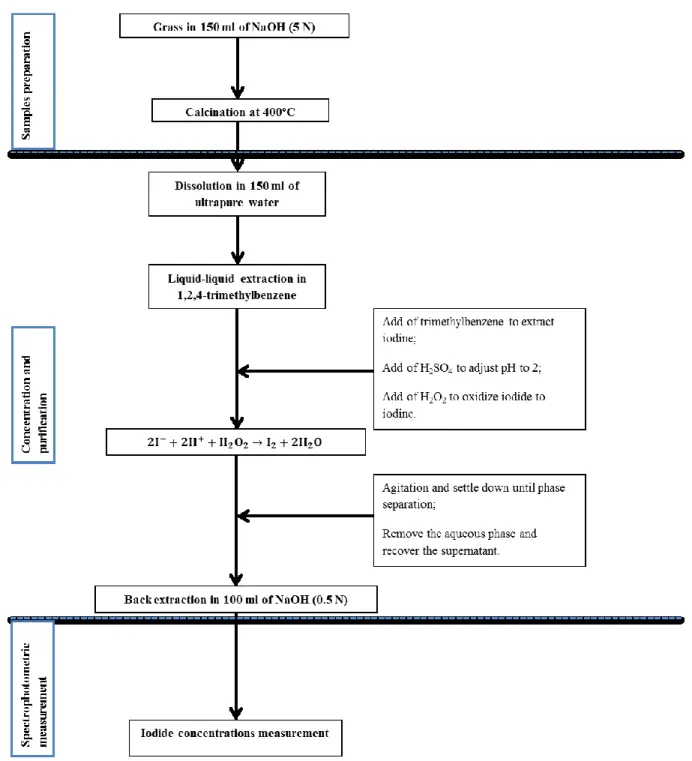
maximum mass. To extract iodine from grass samples, an original methodology was developed. Iodine was separated from
146
grass using calcination at 400 °C (Table 2) followed by liquid-liquid extraction (Fig. 2). Firstly, each square of cut grass
147
was placed in a flask containing 150ml of NaOH (5 N). A physico-chemical treatment was then applied to the samples. The
148
samples were placed in porcelain crucibles and calcined at 400°C to destroy organic matter. After cooling, each samp le was
149
dissolved in 150 ml of ultrapure water (18.2 MΩ cm at 25°C) and then filtered. Iodine is recovered from the filtrate as
150
iodide form. H2SO4 (30%) was added to adjust pH to 2 and H2O2 (35%) to oxidize iodide to iodine. After agitation and
151
settle down until phase separation, iodine in solution is released and trapped by trimethylbenzene as I2 form. The aqueous
152
phase was eliminated and the phase containing the trimethylbenzene was isolated and washed with ultrapure water until its
153
pH was neutral. Then 100 ml of NaOH (0.5 N) was added to extract the iodine in the form I- (back extraction). The grass
154
blank was treated in the same way as the grass samples (Fig. 2).
155
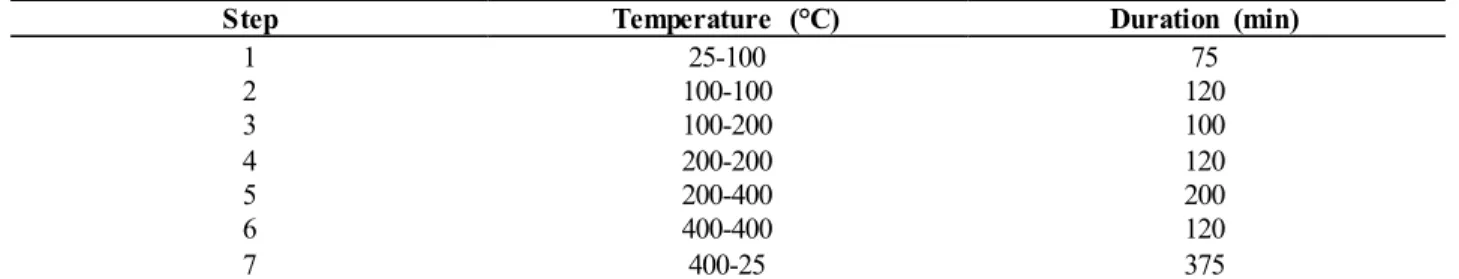
156
Table 2: Calcination cycle to separate the iodine (127I) from the grass.
157
Step Temperature (°C) Duration (min)
1 25-100 75 2 100-100 120 3 100-200 100 4 200-200 120 5 200-400 200 6 400-400 120 7 400-25 375
To determine the extraction efficiency, grass blank and 12 tests were performed. For each test, 5 ml of KI (1g.L-1)
158
were added to 20 g of fresh grass. After adding 150 ml of NaOH (5 N), the whole mixture was treated in accordance with
159
the sample preparation protocol (Fig. 2). The blank was processed in the same way as the tests, replacing the KI with
160
ultrapure water.
162
Fig. 2. Processing of grass samples for spectrophotometric measurement
.
163
164
5. Iodine measurement by colorimetry
165
All the samples were measured by UV-visible spectrophotometry (Safas, UVmc1). The colorimetry technique for
166
iodine measurement is based on the Sandell and Kolthoff (1937) method; the reaction between the cerium ions and the
167
arsenic ions is catalysed by the iodide ions. The absorption measured by spectrophotometry at 415 nm is then inversely
proportional to the iodide concentration. The detection limit is 2.5 µg.L-1. The iodine concentrations measured in the
169
atmosphere are expressed in µg.m-3 and those measured on the grass in µg.m-2.
170
B. Environmental (including meteorological) variable measurements
171
An ultrasonic anemometer (Young 81000V, Inc.) set to a frequency of 10 Hz and installed 50 cm above the ground,
172
and a weather station (Spectrum, Watchdog 2700, Inc.) were used to acquire the meteorological data. The direction (°),
173
velocity (u) and friction velocity (u*) of the wind, sensible heat flux (H), Monin -Obukhov length (L) and atmospheric
174
stability (1/L) were measured by the ultrasonic anemometer, and the temperature (Ts), relative humidity (RH), total solar
175
radiation (SR) and photosynthetically active radiation (PAR) were measured by the weather station.
176
C. Modelling of the dry deposition velocities of iodine
177
1. Model description and identification of the input variables
178
The dry deposition velocity of a gas refers to the transfer of that gas from the air to surfaces (soil, water, vegetation)
179
(Arya, 1999) in the absence of precipitation. It is complex and varies significantly according to:
180
the micrometeorological characteristics of the atmospheric surface layer because of the turbulent transport that can
181
occur in that layer;
182
the physical and chemical properties of the diffusing species;
183
the physical and chemical properties of the surface cover.
184
The dry deposition velocity of a gas has been defined as the inverse of the sum of the three types of resistance to the
185
dry deposition of that gas, namely the aerodynamic resistance, the laminar sublayer resistance and the canopy resistance or
186
surface resistance. The expression used to determine Vd (Eq. (3)) was given by Seinfeld (1985).
187
(3) Where Vd is the dry deposition velocity (m.s-1); Ra is the aerodynamic resistance (s.m-1); Rb is the laminar sublayer
188
resistance (s.m-1) and Rc is the canopy resistance or surface resistance (s.m-1).
189
The input parameters (Table 3) used to model the deposition velocities were the parameters related to the physico-chemical
190
properties of the iodine, the surface properties of the grass and the sampling conditions, i.e.:
191
Reference values: diameter of an iodine molecule (Dp), canopy aerodynamic resistance (Rac0), ground resistance
192
(Rg0), cuticle resistance (Rcut0) and mesophyll resistance (Rm);
193
Variables: leaf area index (LAI), roughness length of the grass (z0), measurement height (z) and minimum stomatal
194
resistance (ri).195
196
197
198
Table 3: Input parameters of the model for dry deposition of iodine.
199
Campaign (Date) Dp (m) z (m) z0 (m) LAI ri
(s.m-1) Rm (s.m-1) Rac0 (s.m-1) Rg0 (s.m-1) Rcut0 (s.m-1) MIOSEC 2 (18 to 26 September 2018) 2.8×10⁻⁸ 0.26 0.01 1.5 9999 0 1000 100 50 MIOSEC 3 (4 to 7 June 2019) 2.8×10⁻⁸ 0.26 0.01 1.5 60 0 1000 100 50
200
2. Determination of the resistances (R
a, R
band R
c) and the input variables of the model
201
Aerodynamic resistance refers to the aerodynamic component of transfer governed by microturbulence. It therefore
202
corresponds to the resistance to vertical transfer to the surfaces in the immediate vicinity of the elements (gas, aerosols)
203
through the atmospheric surface layer. The lower limit of the atmospheric surface layer is the roughness length. Of the
204
micrometeorological parameters that influence aerodynamic resistance, wind friction velocity and atmospheric stability are
205
the most important (Arya, 1999). The expressions for Ra and Rb shown respectively in Eqs. (4) and (5) have been defined by
206
Padro et al. (1991).207
[ ( ) ] With, { * + ( ) (4)Where u* is the wind friction velocity (m.s-1); k is the Von Karman constant (k=0.4); z is the reference height at which the
208
deposition velocity is evaluated, i.e. the height from the ground at which the air is sampled; z0 is the roughness length; ΨH is
209
the stability correction function for heat and L is the Monin-Obukhov length.
210
During the 2 measurement campaigns, the roughness length of the grass and the air sampling height were 0.01 m and
211
0.26 m respectively. Depending of Pasquill stability classes, the experiments were carried out under stable, unstable and
212
neutral atmospheric conditions (see Table 7 and Table 8). Equation (4) was applied according to the stable case and unstable
213
case defined by author. In neutral condition, ΨH =1 (Seinfeld and Pandis, 2016) was used for Ra calculation.
214
Laminar sublayer resistance (Rb) is the resistance to diffusion of the elements through the molecular sublayer in direct
215
contact with the surface. Rb depends on both turbulence and molecular diffusion (Eq. (5)).
216
( )
Where ν is the kinematic viscosity of the air (ν = 1.5 × 10⁻⁵ m2.s-1) and D
i is the molecular diffusivity (Eq. (6)) of a species i
217
in the air (Seinfeld, 1985).
218
With,219
(6) Where KB is the Boltzmann constant (KB = 1.38 x 10⁻²³ K.J-1); T is the temperature (K); Cu is the Cunningham correction220
factor for small particles or molecules with a diameter of less than 1 µm; µ is the dynamic viscosity coefficient of air (1.8 x
221
10-5 kg.m-1.s-1); Dp is the diameter of the gas molecule studied. The diameter of a gaseous iodine molecule (I2) is 2.8 × 10⁻¹⁰
222
m (Forsythe, 1956). The Cunningham correction (Eq. (7)) was given by Seinfeld (1985). λ is the mean free path of a
223
molecule. At ambient pressure and temperature: λ = 6.8 × 10⁻⁸ m.
224
( ) (7)
The overall resistance on the surface of the cover (Rc), called the "surface resistance" or "canopy resistance",
225
includes the stomatal resistance and the non-stomatal resistance. For surfaces with plant cover, the model used most
226
frequently to describe Rc is the model defined by Zhang et al. (2002b). Rc was determined using Eq. (8) as defined in Zhang
227
et al. (2002a).228
(8) Where Rc is the surface resistance (s.m-1); Rst (s.m-1) is the stomatal resistance; Rm (s.m-1) is the mesophyll resistance; Rns229
(s.m-1) is the non-stomatal resistance and Wst is the stomatal blocking fraction (no unit).
230
The stomatal resistance is the resistance to opening of the stomata. In other words, it is the resistance to gas
231
absorption by the blades of grass. It is the result of biological processes on the surface of the plant cover. Consequently, the
232
properties of the grass are very important to the final stage of the deposition process. The parameters influencing stomatal
233
resistance are (Arya, 1999):
234
- the properties of the plant cover, including the water potential, roughness and leaf area index (LAI). The LAI is the
235
area developed by the blades of grass per unit of ground surface area. It is a value that has no physical dimension.
236
It was determined using an LAI-meter (LICOR, LAI-2000);
237
- the physico-chemical properties of the gas, including solubility and molecular diffusivity;
238
- the weather conditions, particularly the vapour-pressure deficit, temperature and solar radiation.
239
The stomatal resistance was calculated using an empirical formula (Eq. (9)) developed by (Wesely, 1989).
240
{ [ ] }{ [ ] } (9)
Where SR is the total solar radiation in (W.m-2); T
S is the air temperature (°C) between 0 and 40°C and ri (s.m-1) is the
241
minimum stomatal resistance for water vapour. The last of these varies according to the type of plant cover, the season but
also the chemical species. The meteorological data used for the parameterisation of Rst were obtained using the weather
243
station and correspond to the experiment periods (Table 7and Table 8). Depending of seasons and landuse type, as urban
244
land, deciduous forest or grassland, Wesely (1989) have defined the values of ri. The values of ri corresponding to grassland
245
are given in Table 4. Given that MIOSEC 2 and MIOSEC 3 ran from 18 to 26 September 2018 and from 4 to 7 June 2019,
246
the values ri = 9999 (s.m-1) and ri = 60 (s.m-1) respectively were selected for the calculation of Rst.
247
248
Table 4: ri (s.m-1) values for grassland according to season (Wesely, 1989).
249
Period of the year ri (s.m-1)
Summer 60
Autumn before harvest 9999
Late autumn with frost but no snow 9999
Winter with snow 9999
Spring 120
250
Equation. (10) corresponds to the expression of the stomatal blocking fraction for a wet canopy (Brook et al., 1999).
251
For dry canopy, Wst always equals 0. Wst is given a value other than 0 only when solar radiation is relatively strong (> 200
252
W.m-2) and the canopy is wet. If rain or dew occurs, the canopy is treated as wet (Zhang et al., 2003b). In this study, as the
253
experiments were carried out outside of dew and rain periods, the value of 0 was assigned to Wst.
254
{ (W.m (W.m (W.m (10)Mesophyll resistance (Rm) is resistance to the diffusion of gas in the mesophyll, preventing it from reaching the
255
chloroplasts (Davi, 2004). Rm depends specifically on the chemical species. For chemical species with very high solubility
256
and/or high oxidative power, Rm is negligible, whereas for chemical species with very low solubility and/or low oxidative
257
power, Rm is assigned a value of 100 s.m-1. For all other chemical species, Rm is 0 (Zhang et al., 2002b). In view of both the
258
very low solubility of iodine (I2) in water (Gottardi, 2001) and its high oxidative power (Carpenter, 2003), a value of 0 has
259
been assigned to Rm.
260
The expression for non-stomatal resistance (Eq. (11)) was the expression determined when parameterising Rns for O3
261
(Zhang et al., 2002a).
262
(11) Where Rns is the non-stomatal resistance (s.m-1); Rac (s.m-1) is the canopy aerodynamic resistance; Rg (s.m-1) is the ground
263
resistance and Rcut (s.m-1) is the cuticle resistance. Rac does not depend on the chemical species whereas Rg and Rcut do
264
depend on it.
265
Rac is affected by the change in canopy structure including LAI and wind friction velocity. Rac expression (Eq. (12)) is given
266
by Zhang et al. (2002b).
⁄ (12)
Where Rac0 (s.m-1) is the reference value for Rac (s.m-1); LAI is leaf area index and u* is the wind friction velocity (m.s-1).
268
Rac0 values are determined and assigned at many type of canopy including grass. The value of Rac0 (50 s.m-1) used in the
269
model corresponds to that defined by Wesely (1989) for grassland.
270
Rg and Rcut were calculated for S02 and O3. For all other gases, a formulation to determine Rg and Rcut (Eq. (13)) was
271
developed by Zhang et al, (2003).
272
(13) Where Rx is the ground resistance (Rg) or cuticular resistance (Rcut); i represent the chemical species; α and β are 2 factors273
based on solubility and semi-redox reactivity of i (Wesely, 1989).
274
Previous studies have suggested that Rc of iodine would be identical to that of SO2 (Brandt et al., 2002). As the parameters α
275
and β for iodine are not known, approximations have been made. Iodine like SO2 has high semi-redox reactivity. Although
276
the solubility in water at 25°C of iodine (0.34 g.L-1) (Hartley and Campbell, 1908) is much lower than that of SO2 (82.4 g.L
-277
1) (Byerley et al., 1980), as long as the quantity of iodine emitted in atmosphere can be dissolved and oxidized on the grass
278
surface, solubility and semi-redox reactivity may be considered as not a limiting factors and, consequently that parameters
279
Rg and Rcut of SO2 can be used for I2.
280
Rg is considered depending of surface type. For different chemical species including I2, Rg would be different depending
281
that canopy is dry or wet (dew or rain).
282
For a dry canopy,
283
⁄
(14) For a wet canopy,
284
⁄
(15) Where Rcutd0 (s.m-1) and Rcutw0 (s.m-1) represent the reference values of Rcut (s.m-1) for dry and wet canopy, respectively; RH
285
is relative humidity (%); LAI is the leaf area index and u* is the wind friction velocity (m.s-1).
286
The reference values Rg0 (100 m.s-1) used in this study is that for SO2 for grass (Zhang et al., 2003a). As the experiments
287
were carried out outside of dew and rain periods, the reference value Rcutd0 (1000 s.m-1) used is that for SO2 for grass in dry
288
conditions (Zhang et al., 2003a).
289
Equations. (16) and (17) are the resultants of the integration of the expressions for Rac, Rg and Rcut in Eq. (11). The
290
expression for Rns becomes:
291
For a dry canopy,
(16) For a wet canopy,
293
(17) A LAI of 1.50 was used as an input parameter to calculate the non -stomatal resistance. This value was set as a result of the
294
measurements made with the LAI-meter. The meteorological parameters used to model the non-stomatal resistance are
295
given in Table 7 and Table 8.
296
3. Results and discussion
297
A. Measurement of iodine dry deposition velocities on grass
298
The iodine concentrations measured in blanks flasks and filters were below the detection limit (see Appendix 1 and
299
2). Consequently, there was no transformation of iodine during emission and iodine measured in samples corresponds to
300
that emitted using iodine generator.
301
To determine the quantity of iodine in grass tests, the quantity of iodine in blank grass is subtracted from the quantity
302
of iodine measured in grass tests. Extraction efficiency is determined by dividing the quantity of iodine measured in grass
303
tests to the quantity of iodine added. This ratio is expressed as a percentage. For the 12 tests performed, the mean extract ion
304
efficiency was 57% with a ratio of standard deviation to mean (RSD) of 6.44%. These results validated the technique for
305
separation of the iodine as I2 form deposited on the grass. The quantity of iodine measured on the grass blank was 0.14 ±
306
0.01 µg.g-1 of fresh grass (mass ± RSD for the extraction efficiency applied to the mass). The application of this technique
307
to the samples resulting from the iodine emissions determined the iodine dry deposition velocities.
308
309
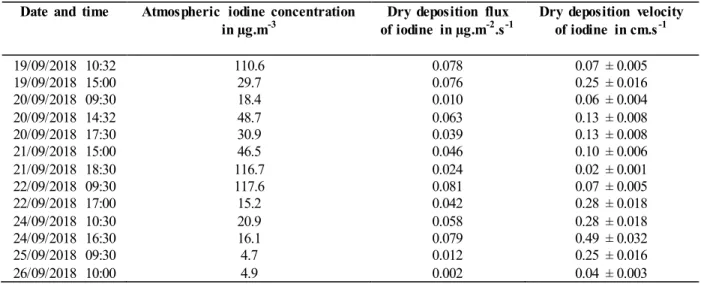
Table 5: Dry deposition velocities of gaseous elemental iodine (127I) on grass during MIOSEC 2.
310
Date and time Atmospheric iodine concentration in µg.m-3
Dry deposition flux of iodine in µg.m-2.s-1
Dry deposition velocity of iodine in cm.s-1 19/09/2018 10:32 110.6 0.078 0.07 ± 0.005 19/09/2018 15:00 29.7 0.076 0.25 ± 0.016 20/09/2018 09:30 18.4 0.010 0.06 ± 0.004 20/09/2018 14:32 48.7 0.063 0.13 ± 0.008 20/09/2018 17:30 30.9 0.039 0.13 ± 0.008 21/09/2018 15:00 46.5 0.046 0.10 ± 0.006 21/09/2018 18:30 116.7 0.024 0.02 ± 0.001 22/09/2018 09:30 117.6 0.081 0.07 ± 0.005 22/09/2018 17:00 15.2 0.042 0.28 ± 0.018 24/09/2018 10:30 20.9 0.058 0.28 ± 0.018 24/09/2018 16:30 16.1 0.079 0.49 ± 0.032 25/09/2018 09:30 4.7 0.012 0.25 ± 0.016 26/09/2018 10:00 4.9 0.002 0.04 ± 0.003
27/09/2018 10:30 132.9 0.399 0.30 ± 0.019
311
The dry deposition velocities measured during MIOSEC 2 (Table 5) are between 0.02 and 0.49 cm.s-1.
312
313
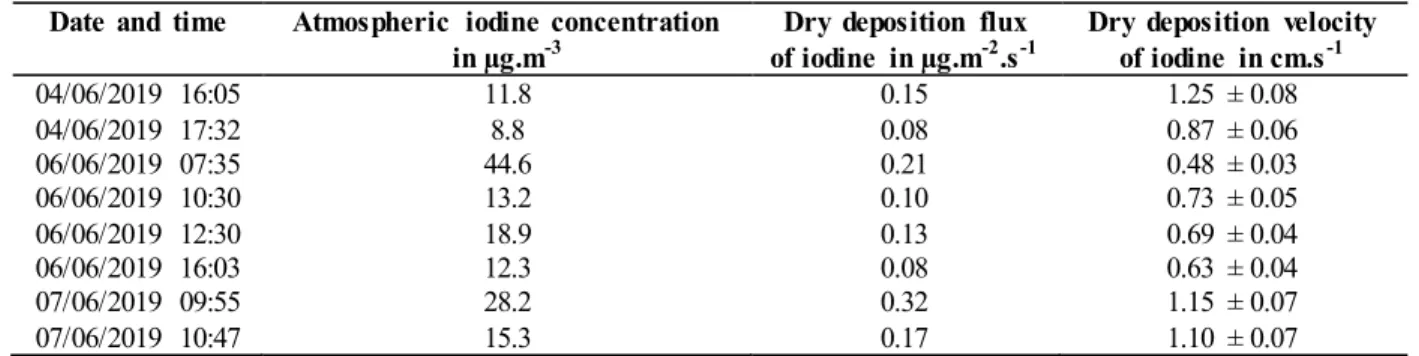
Table 6: Dry deposition velocities of gaseous elemental iodine (127I) on grass during MIOSEC 3.
314
Date and time Atmospheric iodine concentration
in µg.m-3 of iodine in µg.mDry deposition flux -2.s-1 Dry deposition velocity of iodine in cm.s-1
04/06/2019 16:05 11.8 0.15 1.25 ± 0.08 04/06/2019 17:32 8.8 0.08 0.87 ± 0.06 06/06/2019 07:35 44.6 0.21 0.48 ± 0.03 06/06/2019 10:30 13.2 0.10 0.73 ± 0.05 06/06/2019 12:30 18.9 0.13 0.69 ± 0.04 06/06/2019 16:03 12.3 0.08 0.63 ± 0.04 07/06/2019 09:55 28.2 0.32 1.15 ± 0.07 07/06/2019 10:47 15.3 0.17 1.10 ± 0.07
315
During MIOSEC 3, the dry deposition velocities measured (Table 6) are between 0.48 and 1.25 cm.s-1.
316
B. Environmental (including meteorological) variable measurements
317
The meteorological data obtained using the ultrasonic anemometer and the weather station during the experiment
318
periods are presented in Table 7 and Table 8, which correspond to MIOSEC 2 and MIOSEC 3 respectively.
319
320
Table 7: Meteorological data for the 14 experiments conducted during MIOSEC 2.
321
Date and time Ts (°C) S (W.m-2) H (W.m-2) RH (% ) u* (m.s-1) 1/L Stability
19/09/2018 10:32 21 426 75 71 0.16 -0.268 Unstable 19/09/2018 15:00 26 798 211 39 0.37 -0.059 Unstable 20/09/2018 09:30 18 286 14 97 0.07 -0.584 Unstable 20/09/2018 14:32 27 782 181 36 0.26 -0.145 Unstable 20/09/2018 17:30 28 386 84 36 0.24 -0.089 Unstable 21/09/2018 15:00 20 653 169 47 0.33 -0.069 Unstable 21/09/2018 18:30 17 115 9 47 0.22 -0.012 Neutral 22/09/2018 09:30 12 119 9 95 0.05 -0.826 Unstable 22/09/2018 17:00 22 475 83 31 0.35 -0.029 Unstable 24/09/2018 10:30 12 433 71 71 0.36 -0.022 Unstable 24/09/2018 16:30 18 542 165 37 0.53 -0.016 Neutral 25/09/2018 09:30 10 272 27 66 0.36 -0.008 Neutral 26/09/2018 10:00 12 340 38 57 0.15 -0.169 Unstable 27/09/2018 10:30 19 435 45 45 0.26 -0.038 Unstable
322
Table 8: Meteorological data for the 8 experiments conducted during MIOSEC 3.
323
Date and time Ts (°C) S (W.m-2) H (W.m-2) RH (% ) u* (m.s-1) 1/L Stability
04/06/2019 16:05 20 216 47 63 0.47 -0.005 Neutral 04/06/2019 17:32 19 293 39 69 0.31 -0.018 Neutral 06/06/2019 07:35 9 58 6 100 0.12 0.027 Stable 06/06/2019 10:30 13 344 59 84 0.23 -0.068 Unstable 06/06/2019 12:30 16 644 89 60 0.24 -0.090 Unstable 06/06/2019 16:03 19 725 94 46 0.33 -0.038 Unstable
07/06/2019 09:55 12 180 17 95 0.43 -0.001 Neutral
07/06/2019 10:47 14 389 83 86 0.47 -0.011 Neutral
324
C. Modelling of the dry deposition velocities of iodine
325
The iodine dry deposition velocities obtained by the model are between 0.11 cm.s-1 and 0.51 cm.s-1 during
326
MIOSEC 2 (Table 9) and between 0.31 cm.s-1 and 1.60 cm.s-1 during MIOSEC 3 (Table 10).
327
328
Table 9: Dry deposition velocities of iodine produced by the model during MIOSEC 2.
329
Date and time Ra (s.m-1) Rb (s.m-1) Rst (s.m-1) Rc (s.m-1) Vd (cm.s-1)
19/09/2018 10:32 11 2 12219 505 0.19 19/09/2018 15:00 6 1 11734 294 0.33 20/09/2018 09:30 19 6 14988 641 0.15 20/09/2018 14:32 8 1 11953 492 0.20 20/09/2018 17:30 9 2 14923 562 0.17 21/09/2018 15:00 7 1 10937 316 0.31 21/09/2018 18:30 16 2 40963 533 0.18 22/09/2018 09:30 20 7 45588 903 0.11 22/09/2018 17:00 6 1 11844 356 0.28 24/09/2018 10:30 6 1 14803 188 0.51 24/09/2018 16:30 7 1 11519 193 0.50 25/09/2018 09:30 10 1 20977 206 0.46 26/09/2018 10:00 13 3 15917 749 0.13 27/09/2018 10:30 9 1 12169 453 0.22
330
Table 10: Dry deposition velocities of iodine produced by the model during MIOSEC 3.
331
Date and time Ra (s.m-1) Rb (s.m-1) Rst (s.m-1) Rc (s.m-1) Vd (cm.s-1)
04/06/2019 16:05 8 2 111 66 1.32 04/06/2019 17:32 11 3 88 71 1.17 06/06/2019 07:35 51 7 1108 263 0.31 06/06/2019 10:30 10 4 90 76 1.12 06/06/2019 12:30 9 5 68 101 0.87 06/06/2019 16:03 7 4 65 93 0.96 07/06/2019 09:55 8 2 159 59 1.45 07/06/2019 10:47 8 2 84 53 1.60
332
D. Change in the dry deposition velocities of iodine as a function of environmental variables and the
333
physiological properties of the grass
334
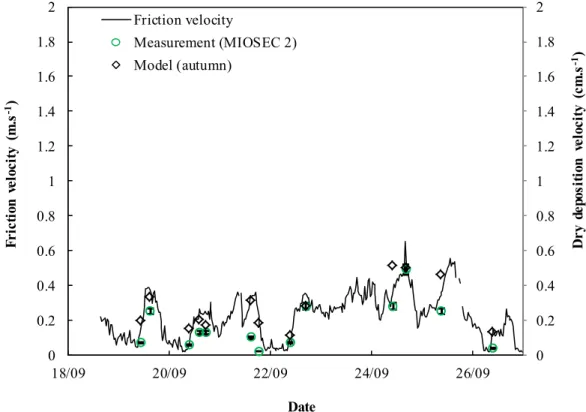
During MIOSEC 2, the deposition velocities varied by more than on order of magnitude and values produced by the
335
model varied as the same of measurements results. Although the data is very limit on statistical significance, the reasons to
336
affect the dry deposition velocity during MIOSEC 2 are the mechanical turbulence and, more specifically, in the wind
337
friction velocity (Fig. 3). These differences are due to the variations existing between the wind frictions velocities
338
(approximately on order of magnitude) measured at the same moment of experiments. Deposition velocities are higher
339
during the periods of strong winds than during periods of light winds. This observation is corroborated by the significance
340
level of the correlation (Fig. 5) of the modelled depos ition velocities (Vdmod) with the wind friction velocities (u*) (Vdmod =
341
1.0 × u*, R2 = 0.7). In other words, the iodine deposition on the grass due to entrainment of iodine onto the surface of the
342
blades of grass by the wind friction velocity is related to surface area. Unlike wind friction velocity, the correlation of
343
deposition velocities with sensible heat flux and stomatal resistance is not significant. Furthermore, in view of the stomata l
344
resistances (Rst) determined during MIOSEC 2, the model shows that the experiments were conducted during a period of the
345
year (autumn) when the stomata were only slightly open. Consequently, the deposition velocities were dependent on the
346
non-stomatal resistance (Rns), which is also dependent on the wind friction velocity.
347
348
Fig. 3. Change in dry deposition velocities of gaseous elemental iodine and wind friction velocities during
349
MIOSEC 2: the bar on the deposition velocities (circles) corresponds to the mean standard deviation divided by the mean as
350
a percentage for the extraction efficiency (RSD = 6.34%).
351
352
0 0.2 0.4 0.6 0.8 1 1.2 1.4 1.6 1.8 2 0 0.2 0.4 0.6 0.8 1 1.2 1.4 1.6 1.8 2 18/09 20/09 22/09 24/09 26/09 D ry d ep os it io n ve lo ci ty ( cm .s -1) Fr ic ti on v el oc it y (m .s -1) Date Friction velocity Measurement (MIOSEC 2) Model (autumn)During MIOSEC 3, the variations in measurements deposition velocities are the same to values given by model. The first
353
reason of variations in deposition velocities is due to the mechanical turbulence. Deposition velocities are higher during
354
periods of strong winds than during periods of light winds. The second reason is due to the stomata opening. For the same
355
values of friction velocities, dry deposition velocities obtained during MIOSEC 3 are 2 to 3 times higher than those obtained
356
during MIOSEC 2. The model shows that the stomatal resistances were smaller during MIOSEC 3 than those obtained
357
during MIOSEC 2. In other words, the experiments were conducted during a period of the year (summe r) when the stomata
358
were more open. Consequently, the dry deposition velocities were higher in this period. The change in deposition velocity
359
during MIOSEC 3 shows that the dry deposition of iodine was favoured not only by the wind friction velocity (Fig. 4) but
360
also by iodine penetration into the blades of grass due to the openness of the stomata. This is reflected in the high
361
significance level of the correlation (Fig. 5) of the modelled deposition velocities with the wind friction velocities (Vdmod =
362
3.0 × u*, R2 = 0.9).
363
364
Fig. 4. Change in dry deposition velocities of gaseous elemental iodine and wind friction velocities during MIOSEC 3: the
365
bar on the deposition velocities (triangles) corresponds to the mean standard deviation divided by the mean as a percentage
366
for the extraction efficiency (RSD = 6.34%).
367
0 0.2 0.4 0.6 0.8 1 1.2 1.4 1.6 1.8 2 0 0.2 0.4 0.6 0.8 1 1.2 1.4 1.6 1.8 2 04/06 05/06 06/06 07/06 08/06 D ry d ep os it io n ve lo ci ty ( cm .s -1) Fr ic ti on v el oc it y (m .s -1) Date Friction velocity Measurement (MIOSEC 3) Model (summer)368
Fig. 5. Change in dry deposition velocities of gaseous elemental iodine during MIOSEC 2 (circles) and MIOSEC 3
369
(triangles) as a function of the wind friction velocities: the bar on the deposition velocities corresponds to the mean standard
370
deviation divided by the mean as a percentage for the extraction efficiency (RSD = 6.34%).
371
372
E. Comparison of the measured dry deposition velocities with the modelled dry deposition velocities
373
The measured dry deposition velocities are comparable with the modelled dry deposition velocities and, when the
374
former are related by a function to the latter for each of the measurement campaigns, they correlate linearly with co rrelation
375
coefficients (R2) of 0.61 and 0.71 for MIOSEC 2 (Fig. 6) and MIOSEC 3 (Fig. 7), respectively. The measured data are
376
generally 15-30% lower than those modelling results during both MIOSEC 2 and 3. The average of the deviations in
377
absolute value compared to the measured values (Mean Absolute Percentage Error, MAPE) is 10% and 5% during MIOSEC
378
2 and 3, respectively. Knowing that the solubility of SO2 is higher than that I2 and Rg0 and Rcut0 being parameters based on
379
solubility and semi-redox reactivity of the gaseous specie, the overestimated results of model could be explained by the fact
380
that approximations consisting to apply values references of Rg0 and Rcut0 from SO2 to I2 were used in the model in place of
381
the reference values specific to I2. The model can be improved as a determining the parameters Rg0 and Rcut0 specific to I2.
382
To conclude, the modelled dry deposition velocities and the measured dry deposition velocities show that the dry
383
deposition of iodine is dependent on surface resistance (Rc), which is depends on stomatal resistance (Rst) and non-stomatal
384
resistance (Rns). The model also shows that stomatal resistance is lower in summer than in autumn, whereas non -stomatal
385
resistance varies very slightly through the seasons and is dependent on the wind friction velocity (u*). Consequently, when
386
stomatal resistance is high, which coincides with closure of the stomata, dry deposition velocities are lower and are
387
Vdmod = 1,0 × u* R² = 0,7 VdmodR² = 0,9 = 3,0 × u* 0 0.2 0.4 0.6 0.8 1 1.2 1.4 1.6 1.8 2 0 0.2 0.4 0.6 M ea su re m en t (c m .s -1) Friction velocity (m.s-1)Measurement (MIOSEC 2) Measurement (MIOSEC 3)
dependent on the wind friction velocities. When stomatal resistance falls , which coincides with opening of the stomata, the
388
deposition velocities increase and depend on both the wind friction velocities and the openness of the stomata.
389
390
Fig. 6. Comparison of measured dry deposition velocities with modelled dry deposition velocities during MIOSEC 2.
391
392
Fig. 7. Comparison of measured dry deposition velocities with modelled dry deposition velocities during MIOSEC 3.
393
R² = 0.61 0 0.2 0.4 0.6 0 0.2 0.4 0.6 M ea su re m en t (c m .s -1) Model (cm.s-1) Measurement (MIOSEC 2)-Model (autumn)R² = 0.71 0 0.2 0.4 0.6 0.8 1 1.2 1.4 1.6 1.8 0 0.2 0.4 0.6 0.8 1 1.2 1.4 1.6 1.8 M ea su re m en t (c m .s -1) Model (cm.s-1) Measurement (MIOSEC 3)-Model (summer)
F. Comparison with the data in the literature
394
Numerous data related to determination of the dry deposition velocities of iodine exist in the literature (Table 11).
395
These values are by no means exhaustive but only examples. The deposition velocities of I2 has been measured to a range of
396
different surfaces both in the outdoor and indoor environment including skin and relate to both stable iodine (127I) and
397
radioactive iodine (129I, 131I) in their elemental or particulate forms.
398
It is mentioned in table 11 that certain dry deposition velocities of iodine correspon ded to those iodine in particulate
399
form, it should be remember here the reasons of the differences in these deposition with those of elementary iodine
400
measured in this study. These differences are due to the fact that the diffusivity of gases is greater than that of particles.
401
For experiments conducted in the environment, the data reported showed that dry deposition velocities for iodine
402
were between 0.001 and 1 cm.s-1 (Handge and Hoffman, 1974), which means that the data were spread across three orders
403
of magnitude. The dry deposition velocities measured in that study are similar to those reported h ere, though the data
404
dispersion is significantly smaller for the data acquired during MIOSEC 3 (0.48-1.25 cm.s-1) and is limited to one order of
405
magnitude in MIOSEC 2 (0.02-0.49 cm.s-1).Concerning the dry deposition velocities of gaseous elemental iodine, the
406
measurements presented by many studies are spread across several orders of magnitude. For example, measurements taken
407
on grass by Chamberlain and Chadwick (1966) led to the conclusion that the dry deposition velocity of elemental iodine
408
(131I) was 1.8 cm.s-1. Most authors suggest taking 1 cm.s-1 as the dry deposition velocity of elemental iodine, though
409
Heinemann and Vogt (1980) suggest 2 cm.s-1. The mean of the deposition velocities measured in this study during
410
MIOSEC 3 (0.86 cm.s-1) is similar to the value suggested in the other studies (1 cm.s-1). For MIOSEC 2, two main reasons
411
could explain the difference between these suggested values and the values obtained.
412
The first reason could be the time of day when the dry deposition velocities were measured and the variations in the
413
meteorological parameters, including wind friction velocity, temperature and solar radiation. During this study, the dry
414
deposition velocities measured during MIOSEC 2 did indeed vary in the course of the experiments, in line with the
415
variations in wind friction velocity.
416
The second possible reason could be the period of the year when the measurements were taken. Measurements of 127I
417
have led to the calculation of dry deposition velocities of 0.16 cm.s-1 (Chamberlain and Chadwick, 1966), similar to the
418
mean of the dry deposition velocities obtained in this s tudy during MIOSEC 2 (0.18 cm.s-1). The results obtained in this
419
study during MIOSEC 2 are also similar to those obtained when determining the dry deposition velocities for O3 on
420
grassland at night , i.e. when the stomata were closed, so when the dry depos ition velocities were strictly linked to surface
421
resistance, which is inversely linked to wind friction velocity (Zhang et al., 2002b). According to the model produced
422
during this study, the dry deposition velocities of iodine depend on the surface resistance (Rc), which is a combination of
423
non-stomatal resistance (Rns) and stomatal resistance (Rst). The model showed that Rns varies only very slightly through the
424
seasons of the year and depends on the wind friction velocity (u*). The model also showed that Rst is higher in autumn,
425
when the stomata are closed, than in summer, when the stomata are open. For example, the deposition velocities measured
426
in this study were higher in summer (MIOSEC 3) than in autumn (MIOSEC 2). The mean surface resistance given by the
427
model was 456 s.m-1 for MIOSEC 2 and 98 s.m-1 for MIOSEC 3. If reference were made to Chamberlain and Chadwick
428
(1966), who suggested taking Rc = 500 s.m-1 when determining the dry deposition velocities of gaseous 131I, then the dry
429
deposition velocities of iodine would be deemed not to change throughout the seasons, which contradicts our observations.
Table 11: Dry deposition velocities of iodine reported in the literature.
431
Dry deposition
velocity (cm.s−1) specimens Test Observations Reference
10−3-1 Grass Review, 131I. (Handge and Hoffman, 1974)
0.1-1.5 Grass Elemental and particulate iodine, 131I. (Eggleton et al., 1963) 0.1-0.5 Grass Fallout from Fukushima measured in
France, 131I. (Parache et al., 2011)
0.54 Grass Calculation of iodine deposits from data reported for distant nuclear explosions in
the British Isles.
(Chamberlain and Chadwick, 1966)
0.5 Grass Calculation of iodine deposits from data
reported for distant nuclear explosions, Brookhaven, Long Island.
(Hull, 1963)
0.58 Grass Air stack at the Karlsruhe reprocessing plant, 129I.
(Wershofen and Aumann, 1989)
0.5 Grass Elemental and particulate iodine, 131I. (Hull, 1963)
0.3 Grass Elemental and particulate iodine, 131I. (Clark and Smith, 1988)
0.8 Grass Elemental iodine, 131I. (Chamberlain, 1959)
1.8 Grass Field experiments, elemental iodine. (Chamberlain and Chadwick, 1966)
2 Grass Elemental iodine, 131I. (Heinemann and Vogt, 1980)
(0.5 _ 3.3) × 10−3 Grass Environmental chamber, 127I. (Karunakara et al., 2018) 5.4 × 10⁻⁵ Bean leaf Environmental chamber, 131I. (Singhal et al., 2004)
432
Finally, based on closed field experiments (environmental chamber), with the emission of gaseous 127I on grass,
433
Karunakara et al. (2018) propose dry deposition velocities of (0.51-3.3) × 10-3 cm.s-1, whereas with the emission of gaseous
434
131I on bean leaves, Singhal et al. (2004) propose 5.4 × 10⁻⁵ cm.s-1. These values differ by several orders of magnitude from
435
those obtained during this study and from data produced during experiments in the environment. These differences are due
436
to the fact that, in an open atmosphere, deposition is controlled by atmospheric turbulence.
437
438
4. Conclusion
439
An experimental methodology based on emissions of gaseous elemental iodine (I2) into the atmosphere in the middle
440
of grassland was developed to determine the dry deposition velocities of iodine. The dry deposition velocities measured
441
during MIOSEC 2 are between 0.02 and 0.50 cm.s-1, a range covering one order of magnitude. The dry deposition velocities
442
measured during the MIOSEC 3 campaign are between 0.48 and 1.25 cm.s-1. As a result of these experiments, a model for
443
the dry deposition of iodine was developed. This model is based on the gas dry deposition principle. The input parameters
444
for the model were the micrometeorological characteristics of the atmospheric surface layer, the physico -chemical
445
properties of the iodine and the surface properties of the grass , all measured at the time of the experiments. The deposition
446
velocities produced by the model are between 0.11 and 0.51 cm.s-1 for the MIOSEC 2 campaign and between 0.31 and 1.60
447
cm.s-1 for the MIOSEC 3 campaign. For both campaigns, the measured dry depos ition velocities are comparable with the
448
modelled dry deposition velocities and when the former are related by a function to the latter, they correlate linearly with
449
significant correlation coefficients. Consequently, this study qualifies the model's input parameters. The model showed that
450
the variations between deposition velocities are due to variations in the wind friction velocities measured at the time of th e
451
experiments. The model also showed that the deposition velocities changed through the differen t seasons of the year. The
deposition velocities are higher in summer, when the openness of the stomata is at its maximum. The deposition velocities
453
measured in summer (MIOSEC 3) depend on both the wind friction velocities and the openness of the stomata. They are
454
lower in autumn when they are mainly dependent on the wind friction velocities because of the closure of the stomata. The
455
data obtained during this study agree with those reported in the literature for experiments conducted under the same
456
conditions. However, they differ from the data obtained during experiments conducted in experimental chambers where
457
there is no atmospheric turbulence. It should be noted that this study consisting of modelling the deposition of I2 and
458
comparing the results of model with values obtained experimentally is original. To improve model, the approximations
459
made must be replaced by the parameters specific to I2. The model is not suitable for atmospheric process for prognostic
460
pollution models, as it requires measurement of a range of parameters. However, it remains applicable to iodine deposition
461
because it predicts I2 dry deposition depending on atmospheric turbulence parameters and surfaces properties of plant cover
462
and may be used to learn about parametric influences. The model developed in this study will be tested on releases of
463
gaseous radioactive iodine (129I) and under different conditions, particularly a longer release time (2 weeks) and a greater
464
distance between the release point and the sampling site (2 km).
465
Acknowledgements
466
We would like to thank the entire INRA team for giving us permission to conduct the experimental campaigns
467
(MIOSEC) on their site and for making their laboratory available to us to carry out the measurements.
468
469
Appendix 1: Atmospheric iodine concentrations on filters, in blank NaOH and in NaOH samples during MIOSEC 2.
470
471
Date and time Atmospheri c iodine concentratio n (µg.L-1) on filters in NaOH 0.5 N Atmospheric iodine concentration (µg.L-1) in blank NaOH 0.5 N Atmospheric iodine concentration(µg. L-1) in samples in NaOH 0.5 N Volume (L) of NaOH 0.5 N in flask for atmospher ic iodine samples Atmosphe ric iodine concentrat ion (µg) Volum e (L) of air sampl ed Atmosphe ric iodine concentrat ion (µg.m -3) 19/09/2018 10:32 < 2.5 < 2.5 66.3 0.1 6.6 60 110.6 19/09/2018 15:00 < 2.5 < 2.5 17.8 0.1 1.8 60 29.7 20/09/2018 09:30 < 2.5 < 2.5 11.0 0.1 1.1 60 18.4 20/09/2018 14:32 < 2.5 < 2.5 29.2 0.1 2.9 60 48.7 20/09/2018 17:30 < 2.5 < 2.5 18.5 0.1 1.9 60 30.9 21/09/2018 15:00 < 2.5 < 2.5 27.9 0.1 2.8 60 46.5 21/09/2018 18:30 < 2.5 < 2.5 70.0 0.1 7.0 60 116.7 22/09/2018 09:30 < 2.5 < 2.5 70.5 0.1 7.1 60 117.6 22/09/2018 17:00 < 2.5 < 2.5 9.1 0.1 0.9 60 15.224/09/2018 10:30 < 2.5 < 2.5 12.5 0.1 1.3 60 20.9 24/09/2018 16:30 < 2.5 < 2.5 9.6 0.1 1.0 60 16.1 25/09/2018 09:30 < 2.5 < 2.5 2.8 0.1 0.3 60 4.7 26/09/2018 10:00 < 2.5 < 2.5 3.0 0.1 0.3 60 4.9 27/09/2018 10:30 < 2.5 < 2.5 79.7 0.1 8.0 60 132.9
472
473
Appendix 2: Atmospheric iodine concentrations on filters, in blank NaOH and in NaOH samples during MIOSEC 3.
474
475
Date and time Atmospheric iodine concentration (µg.L-1) on filters in NaOH 0.5 N Atmospheric iodine concentratio n (µg.L-1) in blank NaOH 0.5 N Atmospheric iodine concentration (µg.L-1) in samples in NaOH 0.5 N Volume (L) of NaOH 0.5 N in flask for atmospheri c iodine samples Atmosphe ric iodine concentrat ion (µg) Volum e (L) of air sampl ed Atmospher ic iodine concentrat ion (µg.m -3) 04/06/2019 16:05 < 2.5 < 2.5 7,1 0,1 0,7 60 11,8 04/06/2019 17:32 < 2.5 < 2.5 5,3 0,1 0,5 60 8,8 06/06/2019 07:35 < 2.5 < 2.5 26,7 0,1 2,7 60 44,6 06/06/2019 10:30 < 2.5 < 2.5 7,9 0,1 0,8 60 13,2 06/06/2019 12:30 < 2.5 < 2.5 11,3 0,1 1,1 60 18,9 06/06/2019 16:03 < 2.5 < 2.5 7,4 0,1 0,7 60 12,3 07/06/2019 09:55 < 2.5 < 2.5 16,9 0,1 1,7 60 28,2 07/06/2019 10:47 < 2.5 < 2.5 9,2 0,1 0,9 60 15,3476
References
477
478
Arya, S.P., 1999. Air pollution meteorology and dispersion. Oxford University Press New York.
479
Brandt, J., Christensen, J.H., Frohn, L.M., 2002. Modelling transport and deposition of caesium and iodine from the
480
Chernobyl accident using the DREAM model. Atmos. Chem. Phys. 2, 397-417.
481
Brook, J.R., Zhang, L., Di-Giovanni, F., Padro, J., 1999. Description and evaluation of a model of deposition velocities for
482
routine estimates of air pollutant dry deposition over North America.: Part I: model development. Atmospheric Environment
483
33, 5037-5051.
484
Byerley, J.J., Rempel, G.L., Le, V.T., 1980. Solubility of sulfur dioxide in water-acetonitrile solutions. Journal of Chemical
485
and Engineering Data 25, 55-56.
486
Carpenter, L.J., 2003. Iodine in the Marine Boundary Layer. Chemical Reviews 103, 4953-4962.