HAL Id: insu-01405155
https://hal-insu.archives-ouvertes.fr/insu-01405155
Submitted on 29 Nov 2016
HAL is a multi-disciplinary open access
archive for the deposit and dissemination of
sci-entific research documents, whether they are
pub-lished or not. The documents may come from
teaching and research institutions in France or
abroad, or from public or private research centers.
L’archive ouverte pluridisciplinaire HAL, est
destinée au dépôt et à la diffusion de documents
scientifiques de niveau recherche, publiés ou non,
émanant des établissements d’enseignement et de
recherche français ou étrangers, des laboratoires
publics ou privés.
Long-term geometry of the geomagnetic field for the last
five million years: An updated secular variation database
Xavier Quidelleur, Jean-Pierre Valet, Vincent Courtillot, Gauthier Hulot
To cite this version:
Xavier Quidelleur, Jean-Pierre Valet, Vincent Courtillot, Gauthier Hulot. Long-term geometry of the
geomagnetic field for the last five million years: An updated secular variation database. Geophysical
Research Letters, American Geophysical Union, 2013, 21 (15), pp.1639-1642. �10.1029/94GL01105�.
�insu-01405155�
GEOPHYSICAL RESEARCH LETTERS, VOL. 21, NO. 15, PAGES 1639-1642, JULY 15, 1994
Long-term geometry of the geomagnetic
field for the last five
million years: An updated secular variation database
Xavier Quidelleur, Jean-Pierre
Valet, Vincent Courtillot and Gauthier Hulot
Institut de Physique du Globe, Pads, France
Abstract. Lee [1983] assembled more than two thousand
paleomagnetic directional data from lava flows in 65 sampling sites with ages spanning the last 5 million years. Constable [ 1992] recently
suggested that the virtual geomagnetic poles (VGP) derived from this
data base have been preferentially located within two antipodal bands
of longitude. We have reanalyzed and updated the Lee data base, yielding a total of 3179 data from 86 distinct sites. Neither the total
data set, nor various subsets of the data unambiguously show any large
and clear maxima in the longitude distribution of VGPs. The shape of
the common site longitude distribution is far more striking with a
pronounced (and robust) minimum close to the common site longitude
and secondary maxima about 120 ø away from it. The former (first
order) feature is equivalent to the far-sided effect discovered by
Wilson [1970] and corresponds to a persistent axial quadrupole
amounting to about 5% of the axial dipole, as previously found by
several authors. The latter (second order) feature could correspond to
the VGP biasing effect described by Egbert [1992] although its observed amplitude appears larger than predicted. Part of this effect
(an asymmetry in the maxima) may also correspond to Wilson's [1971] right-handed effect. Given only a small axial quadrupolar
component and the very uneven actual site distribution, the expected
longitude distribution of VGPs can be calculated: this is found to be in
good agreement with the paleomagnetic observations (i.e. rather flat
with a moderate maximum near 120øE). This study emphasizes
problems related to the unsatisfactory distribution of sites. The amplitude and significance of other terms, beyond the dominant axial
dipole and significant axial quadrupole contribution, remain to be
assessed.
Introduction
Developments in paleomagnetism and plate tectonics, including
attempts to refine a global geomagnetic reversal time scale, have led to
large amounts of paleomagnetic sampling of lava flows, particularly
since the late '60s. In 1983, Lee assembled a base comprising most
directional data covering the last 5 million years and published up to
1977. The data base was not formally published or widely circulated
but it has been at the basis of most statistical analyses of the long-term
time-averaged geomagnetic field, beginning with Merrill and McElhinny [1983]. The same data base has recently led Constable
[1992] to suggest that the virtual geomagnetic poles (VGP) derived
from the individual directional data have been preferentially located
within two antipodal bands of longitude during the last 5 million
years. Constable [1992] linked this observation with a similar observation for the transitional paths of VGPs for the past few
reversals [e.g. Clement, 1991; Tric et al., 1991 ] and concluded that the
time-averaged field contains persistent non-zonal contributions. Valet
et al. [1992] have since challenged the statistical significance of the reversal data (see also Pr6vot and Camps, 1993) and shown that an
equally (or more) significant pattern for transitional paths is that they
Copyright
1994 by the American
Geophysical'Union.
tend to be located 90 ø away from the observation site, a phenomenon
which could in part be due to a statistical biasing effect [Egbert, 1992].
McFadden et al. [ 1993] have since confirmed both the significance of
the preferential bands of longitude and of the "90 ø away from the site"
shift, arguing that the latter feature may be the significant one.
This led us to reanalyse and update the Lee [ 1983] data base to see
if the features uncovered by Constable [ 1992] were indeed robust. The
Lee data base comprised a total of 2244 data (i.e. readings from
individual lava flows) coming from 65 distinct sampling sites. In her
synthesis, Lee rejected data when the pole appeared to be transitional
(VGP latitude between 45øN and 45øS), when the 95% confidence cone had a radius in excess of 20 ø and when individual directions were calculated from a single sample. For each study, there had to be at least 5 flows of a given polarity (normal or reversed) to generate
average data, and finally the latitudes of VGPs for each polarity, once
averaged, had to be at least 60 ø . Because detailed descriptions were
lacking, no criterion based on rock magnetic properties could be
applied. We have reviewed the data base and added 815 data from 14 sites in studies published since 1980, and 120 data from 7 sites corresponding to earlier publications. As a result, the total data base now comprises 3179 data from 86 distinct sites. It is available from
the authors, complete with references, on ftp.
Results
The distribution of sampled sites for which data have been retained
is shown in Figure 1. We note that several areas (the Atlantic Ocean,
South America and the eastern Indian Ocean in the Southern
hemisphere, and Eastern North America, the western Atlantic Ocean
and continental Asia in the Northern hemisphere) are essentially
devoid of data. On the other hand, large amounts of data come from a
restricted number of sites, particularly hot spot volcanoes such as
Hawaii, Iceland, and the south-western Indian Ocean. In what follows,
we have analyzed and displayed for several subsets of the data base
the longitude distribution of sites, of VGPs and also the differences
between VGP and site longitudes, that is the "common site longitude"
first introduced by Wilson [ 1971]. Figure 2 (c, d and e) displays these
three distributions for the total updated database.
'",:¾•-,.,, • e:-'• '"4, '•'., %
Sites with nor•! and reversed dam • Sites with more •an • data
Sites wi• only normal dam • Sites with more •an 2• dam
Sites wi• only rever• dam • Sites with more than 1• dam • Sites wi• l•s •an 1• dam
Paper number 94GL01105
0094-8534/94/94GL-01105503.00
Figure 1: Geographic
cases distinct samplingdistribution
sites are includedof the sampling
within the sameareas.
area.In several
a)
aso ß Site longitude
b) 10O t. ß VGP longitude
14o 12o !oo
c) ß Site longitude
d)
ß VGP
longitude
e
zeo
t ß VGP-site
longitude
•40 240
160 160
! zo 12o
80 80
4O 4O
O. 180 -140 -100 -•0 -ZO ZO i• •0 IO0 140 180 0 -180 o140 -100 -•0 -ZO ZO •0 IO0 140 180
Figure 2: a) and b) Histograms showing respectively the distributions of the site longitudes (20øbins) and VGP
longitudes based on the Lee [1983] database, from Constable [1992]. c), d) and e) Histograms showing the distributions of site, VGP, and VGP-site longitudes, from the total updated database (3179 data), this paper.
Comparing the VGP longitude distribution published by Constable
[1992] based on the original Lee database (Figure 2 b) and the
distribution obtained from our total updated database (Figure 2 d), the
first observation is that the strong clustering of VGPs in preferred
longitude bands does not seem to be confirmed. Although the
distribution of added VGPs seems to be more uniform (though noisy),
maxima and minima do exist but they are somewhat different from those observed in Figure 2 b. We note that a few sites from the Lee database contribute comparatively large numbers of very confined
data. More precisely, the Fisher precision parameter K for individual
sites ranges from about 10 to 650. The distribution of K displays a
bell-like shape, with a very long tail towards the high values and a gap
between 65 and 85. Eleven records from eight distinct sites appear to
be outliers, with K values larger than 85, probably reflecting lack of averaging of secular variation due to a very short time sampling. We
have removed the corresponding 232 data points (12 normal data from
the Indian Ocean, 23 from the Western Pacific, 23 from Yellowstone, 9 from Hawaii, 42 reversed data from Kauai, 26 normal and reversed
data from Ethiopia, 18 from Niihau and 79 from Norfolk Island). The
resulting updated database is that used in the present study; it includes
2947 independent volcanic recordings of the geomagnetic field
direction from 79 sites (Table 1). The corresponding distributions are
displayed in Figure 3 a-c (both polarities), d-f (normal) and g-i
(reversed).
We first observe that the two clear maxima of the VGP longitude distribution found by Constable [1992] near 90øW and 90øE (Figure 2 b), which had already diminished significantly in Figure 2 d are
essentially absent. A moderate maximum is observed near 130øE in
what appears to be a rather uniform distribution. Similar situations are
observed when only normal or reversed flows are included (compare
Figure 3 b, e and h). The overall average VGPs for these three subsets
are within 0.9 to 2.4 ø from the geographic pole although their 95%
confidence intervals fail to include it by 0.3 to 1.3 ø (Table 2).
The shape of the common site longitude distribution (Figure 2 e,
Figure 3 c, f and i) is far more striking with a pronounced minimum
close to the site longitude. This feature appears to be quite robust and
was found in the analyses of all subsets of data (e.g. considering only
data from the Brunhes Chron, or removing Icelandic or Hawaiian data
from the complete database, or even displaying results from very
limited areas such as Iceland or Hawaii alone). We have also tested
Normal & Reversed Normal Reversed a) d) 'so ,, g)
o -140-100 -•0 -zo zo •c) ioo 140 1•c) -ø180-140 .100-80 -zo zo 80 100 140 180
zso I ß
Site
longitude
zoo
.14o -Ioo -$o -zo $o Ioo
b) ,so[
,, VGPlongitude
t
e)
. w;P
longitude
h)
zoo
o ß
Figure 3: a), b) and c) Histograms of the site, VGP and VGP-site longitude distributions for the combined normal and reversed polarity data (2947 data). d), e) and f) same for normal polarity data (1976 data). g), h) and i) same for reversed polarity data (971 data). All data from the edited and updated data base described in this paper.
Table 1. Characteristics of Data Bases
Numbers of Lee database Lee corrected Updated
database database Studies 5 2 4 5 6 6 Sampling sites 65 58 79 Sampling areas (see Figure 1) 3 4 3 3 3 7 All data 2244 2012 2947 Normal data 1454 1328 197 6 Reversed data 790 684 971
Table 2. Mean pole positions
Polarity Lee database Lee corrected Updated
database database
Overall mean poles
Normaland 88.9; 149.1 88.4; 124.4 88.7; 105.5 Reversed 0.6 0.6 0.6 Normal 89.2; 152.9 89.0; 130.8 89.1; 85.0 0.7 0.8 0.6 Reversed 88.4; 145.4 87.2; 119.9 87.6; 120.7 1.1 1.2 1.1
Common site longitude poles
Normaland 86.5; 138.2 86.5; 145.1 87.4; 146.0 Reversed 0.6 0.6 0.6 Normal 87.4; 143.8 87.2 151.0 87.9; 146.3 0.7 0.7 0.6 Reversed 84.9; 133.1 85.0; 138.5 86.3; 145.6 1.1 1.1 1.0
Latitude, longitude and •95 in degrees.
the stability of this observation with a normalization of the site distribution using a random selection of no more than 50 data per band
of site longitudes.
This first-order feature is simply a consequence of the far-sided
effect discovered by Wilson [ 1970, 1971] and further studied by McElhinny [1973], Wilson and McElhinny [1974] and more recently
Merrill and McElhinny [1983]. Following these authors, another
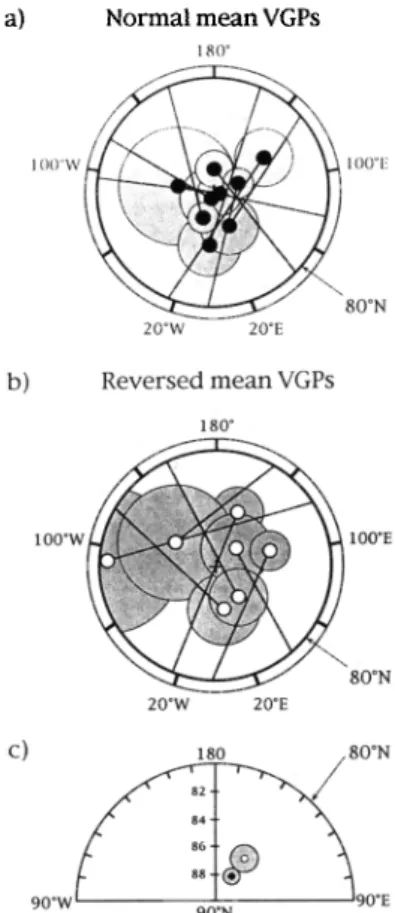
representation of the effect is shown in Figure 4 a and b where average poles are calculated for each of nine sectors of longitude. Figure 4 c displays the mean normal and reversed poles in common site longitude and polar projection (which can be compared to Figure 6.2 of Merrill and McElhinny, 1983). The pole always tends to plot too far from the geographic pole along the site meridian. This effect has been widely discussed and is equivalent to that due to a northward-displaced dipole
g2ø).
or to a geocentric axial quadrupole ( It could be attributed to shallowing of the inclination in the remanence acquisition process, shape anisotropy in lava flows or incomplete magnetic cleaning. The reasons invoked by Merrill and McElhinny [ 1983, p. 185] to discard these still apply. In the same vein, tectonic displacements or
inadequate
dip flow corrections
should
average
out in such
a large
data base. The data displayed in Figures 2 and 3 are therefore in
agreement with previous studies which conclude that there is a small
but significant
axial quadrupole,
on the order
of 5% of &0 [e.g.
Coupland and Van der Voo, 1980; Merrill and McElhinny, 1983;
Constable and Parker, 1988; Schneider and Kent, 1990].
Figure 4 c also confirms the slight but significant polarity asymmetry between the normal and reversed states discussed for instance by Merrill and McElhinny [1983] and observed in deep-sea
sediments
by Schneider
and Kent [ 1990].
To our knowledge
there
is
no generally accepted interpretation for this observation.
A second order feature is the presence of two maxima near 110 ø and -130 ø, hence of a secondary minimum close to 180 ø (Figures 2 e
a) Normal mean VGPs 180 ø 100øW 100øE 20øW 20øE b) Reversed mean VGPs 180 ø 100øW 100øE 80øN 20øW 20øE c)
180 / 80øN
90ow 90øE 90øNFigure 4: a) Polar stereographic projection (latitudes higher than
80øN) of the mean poles averaged within 40ø-wide sectors of site
longitude considering only normal polarity data from the edited and updated data base (1976 data). The intersections of the sphere with the
95% confidence cones are shown in grey. b) Same as a) considering
the reversed polarity data only (971 data). Note that no reversed polarity data have been sampled within two sectors of longitude. c)
Polar stereographic projection of average poles in common site
longitude, with the 95% confidence cone associated, for the normal
and
reversed
polarities
(closed
and
open
circle,
respectively)
from
the
edited and updated data base (see Figure 3 f and i, and values in Table2).
and 3 c, f and i). This could result from the VGP biasing described by
Egbert [ 1992]. In order to test this hypothesis, we have tried to
estimate its effect in conjunction with the very uneven distribution of
sampling sites (with in particular no observations, or almost no
observations, in two 40ø-wide bands of VGP longitudes, see Figures 2
a, c and 3 a, d, g). We have used the statistical geomagnetic field
model of Constable and Parker [1988], assuming an axial quadrupole
amounting to 5% of the axial dipole contribution, to compute a
hundred times 2947 synthetic data for the sites associated with the
2947 real observations. The mean VGP longitude and VGP-site
longitude distributions are shown in Figure 5 a and b, the standard
deviation (o) being given for each band of longitude (light shading).
The VGP longitude distribution (Figure 5a) is rather flat, not unlike
the observed distribution obtained from the database (Figure 3 b, e and
h). The VGP-site longitude distribution also shows the same
characteristics as found from the updated database (Figure 3 c), with a
pronounced minimum around the site longitude induced by the axial quadrupolar term in the model. The Egbert [1992] effect near + 90 ø is present in this figure by construction, although its amplitude is
apparently too small to be seen clearly. Given the calculated standard
deviation on the model and the expected and unavoidable noise in real
data, the distribution of Figure 5 b is compatible with the distribution in Figure 3 c, except possibly for bands located around 70 ø and 110øE: for these two bins, the counts obtained from data (Figure 3 c) are
b)
Calculated VGP longitude distribution
t• VGp
o •.•'. ... , • , ,
-180 -140 -100 -60 -20 20 60 100 140 180
Calculated VGP-site longitude distribution
25O
ZOO
o
-18o -14o -lOO -60 -zo zo 60 lOO 14o 18o
Figure 5: a) Mean VGP longitude distribution and standard deviations
(light shading) obtained from 100 iterations of the statistical model of
Constable and Parker [1988] (with an axial quadrupole amounting to
5% of the axial dipole contribution), sampled by the site distribution of the global edited and updated data base (2947 data). b) Same as a) for VGP-site longitude distribution.
outside of a 3• interval about the mean value. This observation, if
significant, may be related to the right-handed effect, also discovered
by Wilson [1971' 1972] and present in Figure 4.
Conclusions
The above analysis of an updated database of some 3000 paleomagnetic directions from volcanic flows spanning the last 5
million years does not confirm the existence of preferential bands of
longitude for VGPs suggested by Constable [1992]. The VGP distribution is rather uniform although it does vary when various
subsets of data are used because of the very uneven distribution of
observation sites. When displayed in common site longitude, the distributions appear to be much more robust and to display a pronounced minimum centered on the site longitude. This effect
simply corresponds to the well known far-sidedness discovered by
Wilson [1970; 1971]. The statistical geomagnetic field model of Constable and Parker [1988], which includes a significant axial
quadrupole, combined with the uneven site distribution reproduces
this feature. A departure from the model is the presence of secondary
maxima near + 110 ø and - 130 ø away from the site longitude. Such bias cannot be accounted for solely by the mathematical transformation
from paleomagnetic directions to VGPs [Egbert, 1992]. The +110 ø
maximum, which is the most significant (Figure 3 c) probably reflects
the right-handed effect introduced by Wilson [ 1971] and subsequently
noticed
by several
authors
[Wilson, 1971; 1972; Merrill and
McElhinny, 1983; Constable and Parker, 1988]. It could result from the combination of other long-term spherical harmonics with the present site distribution (work in progress). As this paper was in
review C. Johnson and C. Constable (personal communication, 1993)
kindly provided us with a manuscript submitted to the Philosophical
Transactions of the Royal Society of London, presenting another
updated version of the Lee database. Although their data sources and
selection criteria are somewhat different from ours, resulting in a final
data set with less records (2187) from more locations (104), they come
to results which are essentially in agreement with ours, emphasizing
the role of data distribution and quality. In conclusion, largely due to
the uneven (and unsatisfactory) site distribution, it seems that all that
can be extracted (to first order) from the large paleomagnetic database
is the dominant axial dipolar geometry of the long-term average of the
geomagnetic
field (g•0),
with
the addition
of a small
but significant
axial
quadrupole
(g2ø).
There
is as yet no definite
evidence
for first
degree non-zonal contributions in the distribution of VGP longitudes.
Acknowledgments. We thank C. Johnson and C. Constable for providing us with the complete Lee data base and for helpful discussions. The data can be accessed through "anonymous ftp geosp 1 ipgp.jussieu.fr"; use mail address as password and type "cd paleo". IPGP contribution NS 1290.
References
Clement, B.M., Geographical distribution of transitional VGPs: evidence for
non-zonal equatorial symmetry during the Matuyama-Brunhes geomagnetic reversal, Earth planet. Sci. Lett., 104, 48-58, 199i.
Constable, C.G., Link between geomagnetic reversal paths and secular variation of the field over the past 5 Myr, Nature, 358, 230-233, 1992. Constable, C.G. and R.L. Parker, Statistics of the geomagnetic secular variation
for the past 5 m.y., J. Geophys. Res., 93, 11569-11581, 1988.
Coupland, D.H. and R. Van der Voo, Long-term nondipole components in the geomagnetic field during the last 130 M.Y., J. Geophys. Res., 85, 3529-
3548, 1980.
Egbert, G.D., Sampling bias in VGP longitudes, Geophys. Res. Lett., 23, 2353-
2356, 1992.
Lee, S., A Study of the Time-averaged Paleomagnetic Field for the Last 195
Million Years, Ph.D. thesis, Australian Natl. Univ., Canberra, 1983.
McElhinny, M.W., Palaeomagnetism and Plate Tectonics, Cambridge University Press, Cambridge, 358 pp., 1973.
McFadden, P.L., C.E. Barton, and R.T. Merrill, Do virtual geomagnetic poles follow preferred paths during geomagnetic reversals?, Nature, 361, 342-
344, 1993.
Merrill, R.T. and M.W. McElhinny, The Earth's Magnetic Field, Academic Press, London, 401 pp., 1983.
Pr6vot, M. and P. Camps, Absence of longitudinal confinement of poles in volcanic records of geomagnetic reversals, Nature, 366, 53-57, 1993. Schneider, D.A. and D.V. Kent, The time-averaged paleomagnetic field, Rev.
Geophys., 28, 71-96, 1990.
Tric, E., C. Laj, C. Jehanno, J.-P. Valet, C. Kissel, A. Mazaud, and S. Iaccarino, High resolution record of the upper Olduvai transition from Po Valley (Italy) sediments: support for dipolar transition geometry?, Phys. Earth planet. Inter., 65, 319-336, 1991.
Valet, J.-P., P. Tucholka, V. Courtillot, and L. Meynadier, Paleomagnetic constraints on the geometry of the geomagnetic field during reversals,
Nature, 356, 400-407, 1992.
Wilson, R.L., Permanent aspects of the Earth's non-dipole magnetic field over upper Tertiary times, Geophys. J. R. astron. Soc., 19, 417-437, 1970. Wilson, R.L., Dipole offset - the time-averaged palaeomagnetic field over the
past 25 million years, Geophys. J. R. astron. Soc., 22, 491-504, 1971. Wilson, R.L., Palaeomagnetic differences between normal and reversed field
sources, and the problem of far-sided and right-handed pole positions, Geophys. J. R. astron. Soc., 28, 295-304, 1972.
Wilson, R.L. and M.W. McElhinny, Investigation of the large scale palaeomagnetic field over the past 25 million years. Eastward shift of the Icelandic ridge, Geophys. J. R. astron. Soc., 39, 570-586, 1974.
V. Courtillot, Laboratoire de Pa16omagn6tisme, D6partement de G6omagn6tisme et Pa16omagn6tisme, CNRS URA 729, lnstitut de Physique du
Globe de Paris, 4, Place Jussieu, 75252 Paris Cedex 05, France. (e-mail:
courtillot @ ipgp.j ussieu. fr)
G. Hulot, Laboratoire de G6omagn6tisme, D6partement de G6omagn6tisme et Pa16omagn6tisme, CNRS URA 729, lnstitut de Physique du Globe de Paris, 4, Place Jussieu, 75252 Paris Cedex 05, France. (e-mail: [email protected])
X. Quidelleur, Laboratoire de Pa16omagn6tisme, D6partement de G6omagn6tisme et Pa16omagn6tisme, CNRS URA 729, lnstitut de Physique du
Globe de Paris, 4, Place Jussieu, 75252 Paris Cedex 05, France. (e-mail:
quidel @ ipgp.jussieu.fr )
J.-P. Valet, Laboratoire de Pa16omagn6tisme, D6partement de G6omagn6tisme et Pa16omagn6tisme, CNRS URA 729, Institut de Physique du
Globe de Paris, 4, Place Jussieu, 75252 Paris Cedex 05, France. (e-mail:
valet @ipgp .j ussieu. fr)
(Received October 7, 1993' revised December 1, 1993; accepted December 3,
![Figure 2: a) and b) Histograms showing respectively the distributions of the site longitudes (20øbins) and VGP longitudes based on the Lee [1983] database, from Constable [1992]](https://thumb-eu.123doks.com/thumbv2/123doknet/14729409.572516/3.874.103.747.63.322/figure-histograms-respectively-distributions-longitudes-longitudes-database-constable.webp)
![Figure 5: a) Mean VGP longitude distribution and standard deviations (light shading) obtained from 100 iterations of the statistical model of Constable and Parker [1988] (with an axial quadrupole amounting to 5% of the axial dipole contribution](https://thumb-eu.123doks.com/thumbv2/123doknet/14729409.572516/5.874.118.410.67.370/longitude-distribution-deviations-iterations-statistical-constable-quadrupole-contribution.webp)