HAL Id: hal-01236100
https://hal.archives-ouvertes.fr/hal-01236100
Submitted on 16 Dec 2015
HAL is a multi-disciplinary open access
archive for the deposit and dissemination of
sci-entific research documents, whether they are
pub-lished or not. The documents may come from
teaching and research institutions in France or
abroad, or from public or private research centers.
L’archive ouverte pluridisciplinaire HAL, est
destinée au dépôt et à la diffusion de documents
scientifiques de niveau recherche, publiés ou non,
émanant des établissements d’enseignement et de
recherche français ou étrangers, des laboratoires
publics ou privés.
Medial prefrontal aberrations in major depressive
disorder revealed by cytoarchitectonically informed
voxel-based morphometry
Sebastian Bludau, Danilo Bzdok, Oliver Gruber, Nils Kohn, Valentin Riedl,
Christian Sorg, Nicola Palomero-Gallagher, Mueller Veronika, Felix
Hoffstaedter, Katrin Amunts, et al.
To cite this version:
Sebastian Bludau, Danilo Bzdok, Oliver Gruber, Nils Kohn, Valentin Riedl, et al.. Medial prefrontal
aberrations in major depressive disorder revealed by cytoarchitectonically informed voxel-based
mor-phometry. American Journal of Psychiatry, American Psychiatric Publishing, 2015, 173 (3),
pp.291-298. �10.1176/appi.ajp.2015.15030349�. �hal-01236100�
Medial Prefrontal Aberrations in Major Depressive
Disorder Revealed by Cytoarchitectonically Informed
Voxel-Based Morphometry
Sebastian Bludau, Ph.D., Danilo Bzdok, M.D., Oliver Gruber, M.D., Nils Kohn, Ph.D., Valentin Riedl, M.D., Christian Sorg, M.D., Nicola Palomero-Gallagher, Ph.D., Veronika I. Müller, Ph.D., Felix Hoffstaedter, Ph.D., Katrin Amunts, Ph.D.
Simon B. Eickhoff, M.D.
Objective: The heterogeneous human frontal pole has been identified as a node in the dysfunctional network of major depressive disorder. The contribution of the medial (socio-affective) versus lateral (cognitive) frontal pole to major depression pathogenesis is currently unclear. The authors performed morphometric comparison of the micro-structurally informed subdivisions of human frontal pole between depressed patients and comparison subjects using both uni- and multivariate statistics.
Method: Multisite voxel- and region-based morphometric MRI analysis was conducted in 73 depressed patients and 73 matched comparison subjects without psychiatric history. Frontal pole volume wasfirst compared between depressed patients and comparison subjects by subdivision-wise clas-sical morphometric analysis. In a second approach, frontal pole volume was compared by subdivision-naive multivariate searchlight analysis based on support vector machines.
Results: Subdivision-wise morphometric analysis found a significantly smaller medial frontal pole in depressed patients, with a negative correlation of disease severity and duration. Histologically uninformed multivariate voxel-wise statistics provided converging evidence for structural aberrations specific to the microstructurally defined medial area of the frontal pole in depressed patients.
Conclusions: Across disparate methods, subregion specificity in the left medial frontal pole volume in depressed patients was demonstrated. Indeed, the frontal pole was shown to struc-turally and functionally connect to other key regions in major depression pathology, such as the anterior cingulate cortex and the amygdala via the uncinate fasciculus. Present and previousfindings consolidate the left medial portion of the frontal pole as particularly altered in major depression.
AJP in Advance (doi: 10.1176/appi.ajp.2015.15030349)
Major depressive disorder is characterized by affective, cognitive, and vegetative symptoms. These interfere with a person’s ability to work, sleep, eat, and enjoy once pleasurable activities. Major depressive disorder thus critically impairs tasks in every-day life. Given its high prevalence, it also represents one of the biggest health challenges and will probably be one of the worldwide leading causes of disability and burden by 2020 (1).
It has frequently been proposed that the human frontal pole, coinciding with Brodmann’s area (BA) 10 (2), may subserve an integratory role for higher-order social, emo-tional, and cognitive processes (3, 4). The frontal pole seems to contribute to behavioral disturbances in depression related to introspective evaluation (5), self-relevant reflection (6), and rumination occurrence (7). Corroborating the functional considerations, which implicate a close relationship to depression-related behavioral disturbances, there are reports about structural alterations of the human frontal pole in
major depressive disorder. Consistently, variations in the neurophysiological metabolism of receptors with signifi-cance to depression, particularly pronounced in the seroto-ninergic system, have already been described for the human frontal pole (8–10). There is moreover evidence for mor-phological alterations in depression, such as reduced gray matter volume, within the prefrontal cortex, putatively in-cluding BA 10 (11–13). A recent deep brain stimulation study with patients with treatment-resistant depression showed a response to the treatment only in those patients in which the activation volumes affected the uncinate fasciculus (14). Since it is the frontal pole that represents the termination of thisfiber bundle, possible structural changes within that part of the cortex may represent an important pathophysiological aspect of major depressive disorder.
To date, however, depression research has dedicated much attention to the anterior cingulate and orbitofrontal cortices (i.e., regions neighboring the frontal pole). Given
broad consensus within the field that the pathology of de-pression relates to a larger dysfunctional network, this calls for extension to other potentially affected nodes (i.e., regions with evidence for affection, such as the frontal pole).
Importantly, the functional organization of the frontal pole and surrounding regions still remains under-researched. The nomenclature in this part of the brain is inconsistent, and vague labels such as“anteriorprefrontalcortex”arefrequentlyapplied in a nonquantitative fashion. Recent histological examination demonstrated the presence of two distinct cytoarchitectonic areas in the human frontal pole: area frontopolaris 1 (Fp1, lateral) and area frontopolaris 2 (Fp2, medial) (15). These are clearly distinct in function and connectivity (3, 4, 15). The medial frontal pole (area Fp2) plays a central role in limbic processes such as emotional and social cognition (16–19). The lateral frontal pole (area Fp1), in turn, is related to cognitive functions such as working memory and perception (3, 4, 15). This raises the questions whether the frontal pole is altered in major depressive disorder as well as whether any of these two structurally and functionally distinct regions are dif-ferentially affected by this disorder.
To test this, we combined volumetric analysis of structural MRI data with cytoarchitectonic maps of the human frontal pole and statistical learning algorithms. In a multicenter setting, we included 73 depressed patients and 73 well-matched healthy comparison subjects. In a univariate ap-proach, region-based volumetric analysis was based on the microstructural maps of Fp1 and Fp2 in standard space (15) as a reliable neuroanatomical prior. In a multivariate sta-tistical approach, we then tested whether, and where, a searchlight analysis covering the combined extent of areas Fp1 and Fp2 can locate morphological patterns that allow for classification of a previously unseen subject as patient or control. The combination of these approaches thus provides a comprehensive assessment of the involvement of the
cytoarchitectonically defined areas Fp1 and Fp2 in major depressive disorder.
METHOD
Our volume of interest was derived from a recent cyto-architectonic mapping of the human frontal pole in 10 hu-man postmortem brains (15), which yielded the areas Fp1 and Fp2 (Figure 1) as new parts of the JuBrain atlas (20, 21).
Participants
Patients with major depres-sion were recruited from the university clinics in Aachen, Göttingen and Munich, Germany. For all patients, diagnosis was based on clinical examination by the attending psychiatrist in accordance with the ICD-10 supplemented by the Beck Depression Inventory (BDI) as a self-reported measure of symptom severity. Comparison participants were recruited in the respective local communities. All subjects gave written consent to participate in the study as approved by the local ethics committees. Data pooling and joint analysis were approved by the ethics committee of the Heinrich-Heine University of Düsseldorf. In total, 73 patients in a current depressive ep-isode and 73 healthy comparison subjects were included in the present study (Table 1). In the patient group, current substance abuse was not an exclusion criterion but was specifically recorded. Sixteen patients were classified as suffering from substance abuse disorders (3 patients F10.1, 2 patients F12.1, 11 patients F17.1 according to the ICD-10). Importantly, patients and comparison subjects were not only matched at the (overall) group level but also on a site level. That is, each site not only investigated an equal number of patients and comparison subjects, but also within each site patients and comparison subjects were matched with respect to age and gender to avoid potential confounding influences (Table 1). Among the patients, 44 had previous episodes and were hence classified as suffering from “recurrent depressive disorder” (F33 according to the ICD-10). For four patients, there was no information available about their current med-ication. Two patients received no medication at all, and one received lithium. The remaining patients received their regular medication as prescribed by the attending psychiatrist. While most were prescribed selective serotonin reuptake inhibitors or selective serotonin norepinephrine reuptake inhibitors, there was a considerable variability in the administered drugs, and combination therapies were frequently used. We thus did not perform subanalyses between patients with different medication regimens but rather regarded differences in
FIGURE 1. Maps of Area Frontopolaris 1 (Fp1) and Area Frontopolaris 2 (Fp2)a
aMaximum probability maps of the human frontal pole were used as seed regions for microanatomically informed
voxel-based morphometry. Fp1 area is shown in blue; Fp2 area is shown in red.
medication and their potential effects on brain structure as a nonsystematic source of variance in the patient group. We note that variability introduced by heterogeneous medication should make it harder for the statistical analysis to identify consistent differences between patients and comparison subjects (due to increased variance in the patient group). Therefore, our analysis represents a more conservative ap-proach to identifying structural aberrations in depression than a setting of homogeneous medication. In addition, this more natural setting in combination with the multisite ap-proach should better reflect the overall population of patients with major depressive disorder.
All healthy comparison subjects were free of any current or past neurological or psychiatric disorder or substance abuse disorder and psychotropic medication.
Preprocessing: Voxel-Based Morphometry
Whole-brain T1-weighted structural MRI scans were acquired
for all participants on 3.0-T scanners at the respective sites. Similar acquisition protocols and a common voxel resolution of 13131 mm3
were used at all sites (Table 2). Subsequently, all scans were jointly processed with the same pipeline using the VBM 8.0 toolbox (http://dbm.neuro.uni-jena.de/vbm.html).
Here we used the standard setting for all steps, including bias-field correction, segmentation into gray and white matter and cerebrospinalfluid, adjustment for partial volume effects, spatial normalization into Montreal Neurological Institute space, and nonlinear modulation (22). Because we used nonlinearly modulated gray matter maps for further analysis, the voxel values of the ensuing gray matter volume maps reflect the local volume of gray matter (i.e., the absolute amount of tissue corrected for individual brain sizes). Con-sequently, we did not include total brain volume as an ad-ditional covariate in any of the subsequent analyses, since interindividual differences in brain volume were directly accounted for in the preprocessing.
Univariate Morphometric Comparison
For this analysis, the four cytoarchitectonically defined volumes of interest in standard space were used as individual regions of interest. First, for each subject, voxel-wise gray matter volume values were summed up across all voxels of each of the four histolog-ical masks (representing Fp1 and Fp2, separately for each hemisphere). This yielded the volume for each of these areas in every subject (cor-rected for total brain size, as we used nonlinearly modu-lated images). No additional smoothing was performed because we aimed at inte-grating over histologically defined areas rather than to replace each voxel with a weighted mean of its surrounding voxels. Prior to statistical comparison, we removed variance in the data attributable to between-site differences. This was done byfirst regressing out the variance from the confounding factor“site” and using the ensuing residuals for all subsequent analyses. That is, in addition to a close matching between patients and compar-ison subjects within each site, effects that could be explained by the measurement site were removed from the data. Vol-ume differences between the two groups were then assessed for each of the four volumes of interest by a nonparametric label-exchange procedure using Monte-Carlo simulations (p,0.05, false discovery rate corrected for multiple com-parisons). In a subsequent step, we tested for an association between the volumes of the areas and the severity of symp-toms in the patient group as reflected in the BDI summary score, the number of previous episodes, and disease duration using rank correlations.
Multivariate Morphometric Comparison
Besides the“classical” univariate analysis, the gray matter volume maps of the entire frontal pole (i.e., Fp1 and Fp2) were fed into a multivariate pattern classification analysis (23)
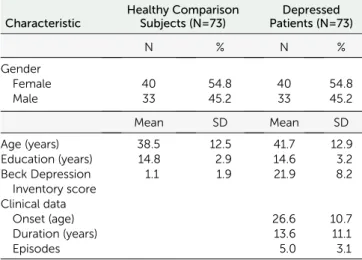
TABLE 1. Data Set of T1-Weighted MRI Scans From Depressed
Patients and Age- and Gender-Matched Comparison Subjects Characteristic Healthy Comparison Subjects (N=73) Depressed Patients (N=73) N % N % Gender Female 40 54.8 40 54.8 Male 33 45.2 33 45.2 Mean SD Mean SD Age (years) 38.5 12.5 41.7 12.9 Education (years) 14.8 2.9 14.6 3.2 Beck Depression Inventory score 1.1 1.9 21.9 8.2 Clinical data Onset (age) 26.6 10.7 Duration (years) 13.6 11.1 Episodes 5.0 3.1
TABLE 2. MRI Acquisition Parameters Used for T1w-TFE [T1-Weighted Turbo Field Echo]/MPRAGE
[Magnetization-Prepared Rapid Gradient-Echo] Sequences Per Site
Site Number of Participants (Depressed Patients/Healthy Comparison Subjects) Echo Time (ms) Repetition Time (ms) Flip Angle Voxel (mm3) University of Aachen, Siemens TrioTim 3T scanner 21/21 2.52 1,900 9° 13131 University of Göttingen, Siemens TrioTim 3T scanner 27/27 3.26 2,250 9° 13131 University of Munich, Achieva, Philips 3T scanner 25/25 4 3,000 8° 13131
using linear support vector machines (24). Prior to this classification, we preprocessed the gray matter volume map by scaling and mean-centering (across the entire sample) for each voxel. We then used support vector machines in a fourfold cross-validation framework. In particular, a linear statistical function wasfirst learned on the training data and subsequently applied to previously unseen test data. Note that structural data from each participant has thus been in the test data only once. This framework is the gold standard to obtain an unbiased estimate of a trained classifier to generalize beyond the subject sample at hand (25).
To apply this procedure in regional neighborhoods, we performed a searchlight analysis (26). For each voxel in the frontal pole mask provided by the combined maps of Fp1 and Fp2, wefirst collected the (preprocessed) gray matter volume values of the immediate neighborhood (radius: 2 to 7 voxels). In each such searchlight, we shrunk the voxel pool to the most varying 33% using an F test (27). We then trained a linear support vector machine per voxel in one part of the voxel-based morphometry images (training set) and subsequently determined the prediction accuracy in the remaining images (test set). Finally, the mean classification accuracy across all permutation folds was mapped to the center of the sphere. We moved the searchlight through the volumes of interest until each seed voxel had once been the center of voxel of the searchlight. This yielded a voxel-wise classification accuracy map for the entire frontal pole. Regarding its software im-plementation, the multivariate searchlight analysis was per-formed using nilearn, a scientific computing Python package for machine learning in neuroimaging data sets. (It is freely accessible online [http://github.com/nilearn/nilearn]).
This type of map of the frontal pole (defined by the combined maps for Fp1 and Fp2) thus identifies the locations where the morphological patterns are most discriminative between depressed patients and comparison subjects. The resulting accuracy maps were transformed into p value maps using the binomial test and corrected for multiple compar-isons using Bonferroni’s method. As a post hoc analysis, we then tested the hypothesis that the significantly discrimi-native voxels correspond to the distinct cytoarchitectonic areas Fp1 and Fp2 by anatomical assignment using the SPM Anatomy toolbox (28).
RESULTS
Univariate Morphometric Comparison
Wefirst tested for gray matter volume differences between patients and comparison subjects within individual left and right Fp1 and Fp2 areas (i.e., four regions). These analyses revealed a significant decrease of volume only for left area Fp2 in depressed patients (p,0.05; false-discovery-rate cor-rected) (Figure 2). The other three regions did not show any significant gray matter volume difference between the two groups.
In the next step, we correlated the individual gray matter volume of left Fp2 with disease severity and chronicity in the
patient group. This analysis revealed a significant negative correlation between left Fp2 gray matter volume and BDI scores (r=20.26, p,0.05). Furthermore, the number of previous episodes (r=20.34, p,0.05), as well as disease duration (r=20.35, p,0.05), correlated negatively with gray matter volume of left Fp2 in the patient group (Figure 3). In an exploratory analysis, we additionally assessed potential correlations between the volumes of right Fp2 and bilateral Fp1 (i.e., those areas that did not show a significant main effect of diagnosis) with the respective clinical information. None of these regions revealed any significant correlation, not even at an uncorrected level. In summary, we found that left Fp2 was not only significantly smaller in patients with major depressive disorder but that this atrophy was also more pronounced in more severely or chronically affected patients.
Multivariate Morphometric Comparison
After (individual) univariate analysis of gray matter volume differences between patients and comparison subjects for each of the histologically defined frontal pole areas, we performed multivariate searchlight analysis for each voxel of the entire frontal pole (that is, naive to either Fp1 or Fp2). This structural pattern recognition using support vector machine-based searchlight analysis congruently revealed the left medial aspects of the human frontal pole to carry the most discriminative morphological features. This was in-dicated by an extended discriminative cluster with disease prediction success between 65% and 73%, depending on the chosen radius. This accuracy clearly exceeded chance level even when correcting for multiple testing across all voxels in the frontal pole (Figure 4). It is noteworthy that the location of the cluster conveying the most diagnostic morphological properties was identical throughout the searchlight analyses with a radius of 2 to 7 voxels, attesting to the robustness of these findings. Across analyses, the medial portion of the left prefrontal cortex demonstrated regional clustering of high prediction accuracies. No other part of the search region exhibited similar prediction suc-cess in accuracy score or regional extent. In a post hoc cytoarchitectonic assessment, the SPM Anatomy toolbox assigned this cluster to the left Fp2. This demonstrates that local volumes in the left medial frontal pole allow a classi-fication of previously unseen subjects as patients and comparison subjects.
DISCUSSION
Recent cytoarchitectonic work has shown that the human frontal pole consists of two distinct areas (15). These feature different functional connectivity and functions, with area Fp2 associated with emotional and social cognition, while Fp1 is associated with working memory and perception (3, 4, 15). In the present study, we investigated structural dif-ferences of the frontal pole between 73 patients and a matched healthy comparison group. We used two different
approaches to assess whether, and where, the frontal pole is structurally altered in depressed patients. We found con-verging evidence pointing to a specific morphological al-teration of only left medial region Fp2 in patients with major depressive disorder. Notably, decreased gray matter volume in this area was not only related to clinical depression se-verity and chronicity but also allowed classification of in-dividual subjects as depressed or healthy at a statistically significant level.
Structural Alterations of the Human Frontal Pole in Major Depressive Disorder
Our results relate well to previously described neurobio-logical alterations in the human frontal pole observed in depressed patients, including differences in serotonin re-ceptor densities (9, 10). Other histological studies demon-strated a marked decrease in the density of glial cells, an enlargement of glial cell sizes, as well as reductions in the neuronal density, predominantly in layer III, of the prefrontal cortex in depressed patients (29).
Additionally, significant gray matter volume reductions in depressed patients were described for the human pre-frontal cortex, including the pre-frontal pole (12, 13). Those former results match well with our results; nevertheless,
reports about bilateral vol-ume reductions might be caused by the usage of different respectively nonprobabilistic atlases. This might lead to a slightly different assignment of region-specific volume al-terations. Encapsulating areas Fp1 and Fp2 in such broader region (12, 30, 31), however, has raised the question whether and where the frontal pole is affected in major depressive disorder. Since the anterior cingulate cortex is described as a key region in the patho-physiologic network of ma-jor depressive disorder (32), most of those results were interpreted in the context of being mainly associated with the cingulate cortex (12). Including cytoarchitectoni-cally specific maps of areas Fp1 and Fp2 in the current analytic framework, how-ever, provided a unique opportunity for assessing the spatial arrangement and the degree of volume loss in the frontal pole and thus a much more specific assess-ment of regional atrophy than possible by macroanatomical definitions.
Region-Specific Contribution of Areas Fp1 and Fp2 to the Pathophysiology of Major Depressive Disorder
We found a depression-related volumetric atrophy spe-cifically associated with medial frontopolar area Fp2. Interestingly, this area is predominantly associated with social-affective processes, whereas the lateral frontal pole (i.e., area Fp1) is predominantly associated with more cognitive functions, including working memory and per-ception (4, 15).
Previous pathophysiological considerations drew atten-tion to the medial part of BA 10, comparable to area Fp2, as being part of the limbic-cortical dysregulation network of major depression (16–18). One important anatomical struc-ture of this dysregulation network is the uncinate fasciculus, which connects the frontal pole with other key regions in the pathophysiology of depression (e.g., with the amygdala) (33, 34). Furthermore, the uncinate fasciculus contributes to frontal-subcortical neuronal circuits, which are involved in emotional and cognitive processing (35, 36), making them particularly relevant to depression. A recent deep brain stimulation study with depressed patients showed that
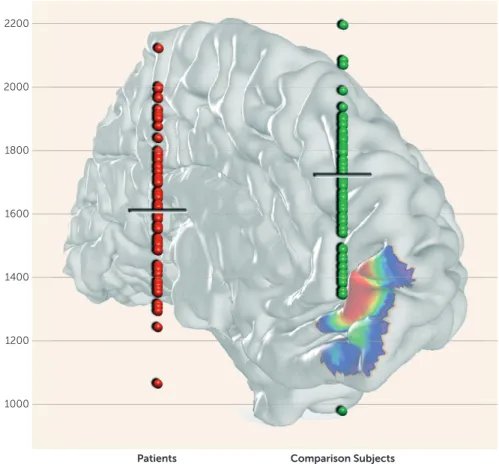
FIGURE 2. Region-Based Gray Matter Volume Analysis in Major Depressive Disorder Using Cytoarchitectonic Maps of the Human Frontal Polea
2200 2000 1800 1600 1400 1200 1000
Patients Comparison Subjects
aValues on the vertical axis represent volume (mm3). Significant decrease of volume was observed only in the left
medial part of the frontal pole (left area Fp2 [frontopolaris 2]) in depressed patients compared with healthy comparison subjects (p,0.05, false discovery rate corrected).
alterations of the uncinate fasciculus provide a good mea-surement to discriminate between responders and nonre-sponders, and the study also postulated that targeting subcallosal cingulate and medial BA 10 cortex might be sufficient for antidepressant treatment (14). This likewise pointed to a potentially heterogeneous contribution of areas Fp1 and Fp2 to depression, which we confirmed in the present study. Additionally, and in line with its association to social-affective processes (4, 15), it should be noted that it is the medial part of the human frontal pole that maintains the strongest functional association with the anterior cingulate cortex (37) and the amygdala (15).
Interestingly, the present study also revealed a correlation with disease severity exclusively in left area Fp2. This is in line with previous studies reporting structural connectivity deficits between limbic structures and frontal areas con-nected through the uncinate fasciculus in depressed patients specifically for the left uncinate fasciculus (38). Taken to-gether, this indicates a possible correlation between an al-tered structural composition, either of the cortex or the white matter of the left medial frontal pole, and the pathophysiology of major depressive disorder.
Limitations
The multisite setting of the present study is challenging, since it required an age and gender matching per site (which was realized in this study in addition to the removal of any var-iance related to the different measurement sites) and might involve possible different standard medication approaches within patient groups. On the other hand, it provides a more realistic representation of patients with major depressive disorder in Germany. Those factors could only be minimized by strict matching and statistical confound adjustment but could not systematically be eliminated.
Secondly, since all but two patients within our study received standard antidepressive medication, we cannot exclude induced effects. Moreover, medication-specific subgroup analyses were not possible due to highly variable medication regimens as prescribed by the attending psychiatrists. While the rating of depression severity using (only) a self-rated measure may be considered a drawback of our study, we would argue that it actually does provide a benefit in the employed multisite setting. In particular, we would like to note that noise variance in BDI scores should be more or less randomly distributed, since it depends on interindividual differences in introspective abilities, repression, honesty, etc. In turn, assessment by an observer-rated inventory should be more susceptible to site- or rater-dependent systematic biases. Because both the uni- and multivariate morphometric analyses congruently detected the morphological properties of only medial area Fp2 as most informative for the disease status, our results can be regarded as being robust. Could they be medi-cation related? We would argue that the specificlomedi-cationtoonly one region in one hemisphere provides evidence to the contrary, as drug-induced gray matter alterations would be expected to affect both hemispheres in a comparable way.
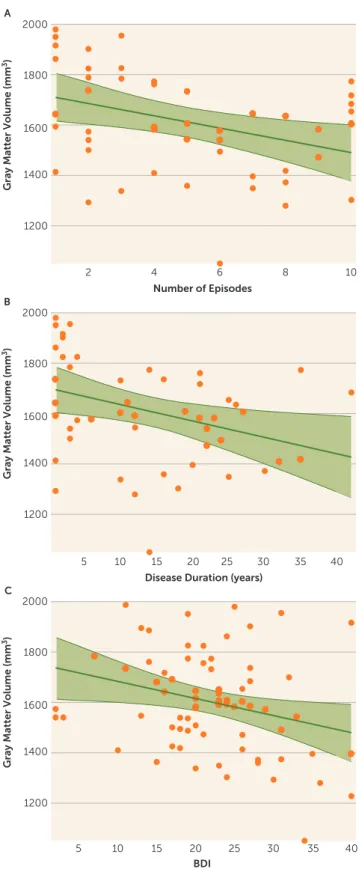
FIGURE 3. Relation Between Left Fp2 Volume and Clinical Parametersa
A
B
C
Gray Matter Volume (mm
3)
Gray Matter Volume (mm
3)
Gray Matter Volume (mm
3)
BDI Disease Duration (years)
Number of Episodes 2000 2 4 6 8 10 10 5 15 20 25 30 35 40 10 5 15 20 25 30 35 40 1800 1600 1400 1200 2000 1800 1600 1400 1200 2000 1800 1600 1400 1200
aThe graphs show a significant negative correlation between the volume
of left Fp2 (frontopolaris 2) and Beck Depression Inventory (BDI) scores (r=20.26), number of previous episodes (r=20.34), and disease duration (r=20.35) in depressed patients.
To our knowledge, there are no reported volumetric effects caused by medication specifically for one hemisphere of one region.
Finally, we note that various structural brain atlases based on different features of regional brain organization, from gyral anatomy to gene-expression and diffusion-weighted imaging, coexist in the field of systems neuroscience (for review see reference 21). The JuBrain histological atlas, however, is currently the only atlas based on microstructural criteria obtained from a group of subjects, yielding a reliable definition of cortical microstructure, which in turn should represent a main constraint to functional organization (20).
CONCLUSIONS
In the presented analyses of multisite voxel-based morpho-metric data, we found converging evidence for structural alterations of the left medial frontal pole area Fp2 in major depressive disorder across both uni- and multivariate sta-tistical approaches. These complementary analyses con-firmed that the volume of left Fp2 was smaller in depressed patients than in healthy comparison subjects. Additionally
this regional atrophy also correlated negatively with disease severity and duration, and it allowed the discrimination between patients and comparison subjects. In line with earlier functional decoding of areas Fp1 and Fp2 (15), this highlights social-affective processes as associated with at-rophy in the left medial frontal pole in depressed patients. This potential implication of socio-emotional processing in the pathophysiology of major depressive disorder is closely related to its clinical hallmarks, including mood disturbances and rumination.
AUTHOR AND ARTICLE INFORMATION
From the Institute of Neuroscience and Medicine (INM-1), Research Center Jülich, Jülich, Germany; the Institute of Clinical Neuroscience and Medical Psychology, Medical Faculty, Heinrich Heine University, Düsseldorf, Germany; the Center for Translational Research in Systems Neuroscience and Psychiatry, Clinic for Psychiatry and Psychotherapy, University Medical Center Göttingen, Göttingen, Germany; the Radboud University Medical Center, Donders Institute for Brain, Cognition and Behaviour, Department of Cognitive Neuroscience, Nijmegen, the Netherlands; the Department of Psychiatry, Psychotherapy and Psychosomatics, RWTH Aachen University, Aachen, Germany; the Neuroimaging Center (TUM-NIC), Klinikum Rechts der Isar, München, Germany; the Department of Neuroradiology, TU München, München, FIGURE 4. Three-Dimensional Reconstruction of Area Frontopolaris 1 (Fp1) and Area Frontopolaris 2 (Fp2) in Montreal Neurological Institute Reference Spacea
A)
C)
x=71
y=169
z=62
aIn images A and B, green voxels located mainly in area Fp2 represent Bonferroni-corrected voxels (p,0.05) conveying the most diagnostic
mor-phological properties (Fp1 is shown in blue; Fp2 is shown in red). In image C, the miniature sagittal slice depicts color-coded regional difference in prediction success (heat map range: 50%–65% accuracy).
Germany; the Department of Psychiatry, TU München, München, Germany; the Cécile and Oskar Vogt Institute for Brain Research, Heinrich Heine University, Düsseldorf, Germany; and the Parietal team, INRIA, Neurospin, Gif-sur-Yvette, France; the Department of Psychiatry, Psychotherapy and Psychosomatics, Medical Faculty, RWTH Aachen University, Aachen, Germany; and JARA-Translational Brain Medicine, Aachen, Germany. Address correspondence to Dr. Bludau ([email protected]). Drs. Bludau and Bzdok contributed equally to this study.
Supported in part by the National Institute of Mental Health (R01-MH074457 [Dr. Eickhoff]), the German Research Foundation (EI 816/4-1 [Dr. Eickhoff], LA 3071/3-1 [Dr. Eickhoff], and EI 816/6-1 [Drs. Bzdok and Eickhoff]), and the European Union Seventh Framework Programme (FP7/2007-2013, grant agreement 604102 [Drs. Amunts and Eickhoff]).
Dr. Gruber has received grant and/or research support from Servier; he has received honoraria and/or consultation fees from Roche; and he has participated in a Servier-sponsored speaker’s bureau. All other authors report nofinancial relationships with commercial interests.
Received March 19, 2015; revisions received June 25 and August 4, 2015; accepted August 14, 2015.
REFERENCES
1. Ferrari AJ, Charlson FJ, Norman RE, et al: Burden of depressive disorders by country, sex, age, and year:findings from the global burden of disease study 2010. PLoS Med 2013; 10:e1001547 2. Brodmann K: Vergleichende Lokalisationslehre der Großhirnrinde
in ihren Prinzipien dargestellt auf Grund des Zellenbaues. Leipzig, Verlag von Johann Ambrosius Barth, 1909
3. Burgess PW, Dumontheil I, Gilbert SJ: The gateway hypothesis of rostral prefrontal cortex (area 10) function. Trends Cogn Sci 2007; 11:290–298 4. Gilbert SJ, Gonen-Yaacovi G, Benoit RG, et al: Distinct functional connectivity associated with lateral versus medial rostral prefrontal cortex: a meta-analysis. Neuroimage 2010; 53:1359–1367
5. Christoff K, Gabrieli JDE: The frontopolar cortex and human cog-nition: evidence for a rostrocaudal heirarchical organisation within the human prefrontal cortex. Psychobiology 2000; 28:168–186
6. Johnson MK, Nolen-Hoeksema S, Mitchell KJ, et al: Medial cortex activity, self-reflection and depression. Soc Cogn Affect Neurosci 2009; 4:313–327
7. Ray RD, Ochsner KN, Cooper JC, et al: Individual differences in trait rumination and the neural systems supporting cognitive reappraisal. Cogn Affect Behav Neurosci 2005; 5:156–168
8. Gibbons AS, Scarr E, McLean C, et al: Decreased muscarinic receptor binding in the frontal cortex of bipolar disorder and major depressive disorder subjects. J Affect Disord 2009; 116:184–191
9. Szewczyk B, Albert PR, Burns AM, et al: Gender-specific decrease in NUDR and 5-HT1A receptor proteins in the prefrontal cortex of subjects with major depressive disorder. Int J Neuropsychopharmacol 2009; 12:155–168
10. Shelton RC, Sanders-Bush E, Manier DH, et al: Elevated 5-HT 2A receptors in postmortem prefrontal cortex in major depression is associated with reduced activity of protein kinase A. Neuroscience 2009; 158:1406–1415
11. Drevets WC, Ongur D, Price JL: Neuroimaging abnormalities in the subgenual prefrontal cortex: implications for the pathophysiology of familial mood disorders. Mol Psychiatry 1998; 3(3):220–226, 190–191 12. Koolschijn PC, van Haren NE, Lensvelt-Mulders GJ, et al: Brain volume abnormalities in major depressive disorder: a meta-analysis of magnetic resonance imaging studies. Hum Brain Mapp 2009; 30:3719–3735 13. Grieve SM, Korgaonkar MS, Koslow SH, et al: Widespread reductions
in gray matter volume in depression. Neuroimage Clin 2013; 3:332–339 14. Riva-Posse P, Choi KS, Holtzheimer PE, et al: Defining critical white matter pathways mediating successful subcallosal cingulate deep
brain stimulation for treatment-resistant depression. Biol Psychiatry 2014; 76:963–969
15. Bludau S, Eickhoff SB, Mohlberg H, et al: Cytoarchitecture, prob-ability maps and functions of the human frontal pole. Neuroimage 2014; 93:260–275
16. Mayberg HS: Modulating dysfunctional limbic-cortical circuits in depression: towards development of brain-based algorithms for diagnosis and optimised treatment. Br Med Bull 2003; 65:193–207 17. Seminowicz DA, Mayberg HS, McIntosh AR, et al: Limbic-frontal
circuitry in major depression: a path modeling metanalysis. Neu-roimage 2004; 22:409–418
18. Drevets WC, Price JL, Furey ML: Brain structural and functional abnormalities in mood disorders: implications for neurocircuitry models of depression. Brain Struct Funct 2008; 213:93–118 19. Bzdok D, Langner R, Schilbach L, et al: Segregation of the human
medial prefrontal cortex in social cognition. Front Hum Neurosci 2013; 7:232
20. Zilles K, Amunts K: Centenary of Brodmann’s map: conception and fate. Nat Rev Neurosci 2010; 11:139–145
21. Amunts K, Hawrylycz MJ, Van Essen DC, et al: Interoperable atlases of the human brain. Neuroimage 2014; 99:525–532
22. Ashburner J: Computational anatomy with the SPM software. Magn Reson Imaging 2009; 27:1163–1174
23. Ashburner J, Klöppel S: Multivariate models of inter-subject ana-tomical variability. Neuroimage 2011; 56:422–439
24. Hanson SJ, Halchenko YO: Brain reading using full brain support vector machines for object recognition: there is no“face” identifi-cation area. Neural Comput 2008; 20:486–503
25. Hastie T, Tibshirani R, Friedman J: The Elements of Statistical Learning. Heidelberg, Germany, Springer Series in Statistics, 2011 26. Kriegeskorte N, Goebel R, Bandettini P: Information-based
functional brain mapping. Proc Natl Acad Sci USA 2006; 103: 3863–3868
27. Saeys Y, Inza I, Larrañaga P: A review of feature selection techniques in bioinformatics. Bioinformatics 2007; 23:2507–2517
28. Eickhoff SB, Heim S, Zilles K, et al: Testing anatomically specified hypotheses in functional imaging using cytoarchitectonic maps. Neuroimage 2006; 32:570–582
29. Rajkowska G: Depression: what we can learn from postmortem studies. Neuroscientist 2003; 9(4):273–284
30. Bremner JD, Narayan M, Anderson ER, et al: Hippocampal volume reduction in major depression. Am J Psychiatry 2000; 157:115–118 31. Frodl T, Schaub A, Banac S, et al: Reduced hippocampal volume
correlates with executive dysfunctioning in major depression. J Psychiatry Neurosci 2006; 31:316–323
32. Drevets WC, Price JL, Simpson JR Jr, et al: Subgenual prefrontal cortex abnormalities in mood disorders. Nature 1997; 386:824–827 33. Thiebaut de Schotten M, Dell’Acqua F, Valabregue R, et al: Monkey to human comparative anatomy of the frontal lobe association tracts. Cortex 2012;48(1):82–96
34. Von Der Heide RJ, Skipper LM, Klobusicky E, et al: Dissecting the uncinate fasciculus: disorders, controversies and a hypothesis. Brain: a journal of neurology 2013; 136(pt 6):1692–1707
35. Cummings JL: Frontal-subcortical circuits and human behavior. Arch Neurol 1993; 50:873–880
36. Marchand WR: Cortico-basal ganglia circuitry: a review of key re-search and implications for functional connectivity studies of mood and anxiety disorders. Brain Struct Funct 2010; 215:73–96 37. Liu H, Qin W, Li W, et al: Connectivity-based parcellation of the
human frontal pole with diffusion tensor imaging. J Neurosci 2013; 33:6782–6790
38. Taylor WD, MacFall JR, Gerig G, et al: Structural integrity of the uncinate fasciculus in geriatric depression: Relationship with age of onset. Neuropsychiatr Dis Treat 2007; 3:669–674