HAL Id: hal-01097674
https://hal.archives-ouvertes.fr/hal-01097674
Submitted on 8 Feb 2019HAL is a multi-disciplinary open access archive for the deposit and dissemination of sci-entific research documents, whether they are pub-lished or not. The documents may come from teaching and research institutions in France or abroad, or from public or private research centers.
L’archive ouverte pluridisciplinaire HAL, est destinée au dépôt et à la diffusion de documents scientifiques de niveau recherche, publiés ou non, émanant des établissements d’enseignement et de recherche français ou étrangers, des laboratoires publics ou privés.
Downsizing the pelagic carbonate factory: Impacts of
calcareous nannoplankton evolution on carbonate burial
over the past 17 million years
Baptiste Suchéras-Marx, Jorijntje Henderiks
To cite this version:
Baptiste Suchéras-Marx, Jorijntje Henderiks. Downsizing the pelagic carbonate factory: Impacts of calcareous nannoplankton evolution on carbonate burial over the past 17 million years. Global and Planetary Change, Elsevier, 2014, 123 (Part A), pp.97-109. �10.1016/j.gloplacha.2014.10.015�. �hal-01097674�
Downsizing the pelagic carbonate factory: Impacts of calcareous
nannoplankton evolution on carbonate burial over the past 17 million years
Baptiste Suchéras-Marx1, 2, 3 * and Jorijntje Henderiks1
Both authors contributed equally to this work
1 Department of Earth Sciences, Paleobiology Program, Uppsala University, Villavägen 16,
SE-75 236 Uppsala, Sweden
2 Université de Lyon, Université Jean Monnet and UMR-CNRS 6524, Laboratoire Magmas et
Volcans, 23 rue du Dr Paul Michelon, 42023 Saint Etienne, France
3 Present address: Aix-Marseille Université, CNRS, IRD, CEREGE UM34, 13545 Aix en
Provence, France
* Corresponding author baptiste.sucheras@gmail.com
Keywords
Neogene, DSDP/ODP sites, pelagic carbonate, nannofossil carbonate mass accumulation, macroevolution
Highlights
1) Nannofossil burial rates quantified at five DSDP/ODP sites over the past 17 Myrs 2) Nannoplankton size decrease impacted global pelagic carbonate burial
3) Foraminifera-derived carbonate burial remained stable over the past 17 Myrs 4) Decreased long-term carbonate pump strength since the Pliocene?
Abstract
Cenozoic deep-sea carbonates (“calcareous oozes”) are predominantly biogenic in origin and offer detailed records of the evolution of calcifying plankton groups, such as coccolithophores and foraminifera. The size and abundance of calcifying plankton determine the strength of the calcium carbonate “pump” in the open ocean, which acts as a short-term source of CO2, while
the burial of pelagic carbonates serves as a long-term sink of carbon. Here, we show how the macroevolutionary size decrease in calcareous nannoplankton (coccoliths and calcareous nannoliths) has affected burial rates of calcareous ooze over the past 17 million years. We quantified nannofossil carbonate burial rates (g CaCO3/m2/yr) at five DSDP/ODP sites in the
Atlantic, Indian, and Western Pacific oceans. The proportion of nannofossil-dominated fine fraction carbonate (<38 µm) and its mass accumulation rates were regionally and temporally variable, but our combined data reveal globally consistent long-term trends. Mean nannofossil carbonate mass decreased about four-fold between 9-4 Ma, but this had little or only minor impact on the burial of pelagic carbonate until ~4 Ma. After ~4 Ma, when small-sized coccolith-bearing species prevailed, nannofossil carbonate burial rates decreased by one order of magnitude to lowest values during the Pleistocene. In contrast, mass accumulation rates of the foraminifera-dominated >38 µm fraction remained stable over the past 17 Myrs. This suggests that changes in the deposition of calcareous ooze were primarily driven by calcareous nannoplankton, and that foraminifera did not compensate for the lower
nannofossil-carbonate accumulation rates since the Pliocene. Despite a deepening of the lysocline over the past 4 Myrs, global pelagic carbonate mass accumulation likely decreased. Whether, or how, this may relate to changes in weathering or other components within the long-term carbonate cycle remains unclear. Explanations for the macroevolutionary size decrease in calcareous nannoplankton focus on the physiological and ecological advantages of small, lightly calcified algal cells in a low-CO2 and more stratified marine environment. 1. Introduction
The production of calcium carbonate by marine organisms is a short-term source of CO2 to
the marine environment, based on the following relationship: Ca2+ (aq) + 2 HCO
3- (aq) ⇔ CO2 (g) + H2O + CaCO3 (s) (1)
However, the burial of biogenic carbonate into marine sediments acts as a long-term sink of carbon. Sedimentary carbonates are the largest reservoir of carbon on Earth, and hence play a vital role in the global carbon cycle (e.g. Milliman, 1993; Falkowski et al., 2000; Feely et al., 2004). Highest carbonate production rates occur in shallow-water environments (reefs, banks, tropical shelves) (Milliman, 1993; Wollast, 1994; Milliman and Droxler, 1996). Although deep-sea carbonates (calcareous oozes or chalks) have production and accumulation rates that are orders of magnitude lower than shallow-water carbonates, they cover a basin area that is orders of magnitude larger – thus representing one of the largest carbon reservoirs (Milliman, 1993).
The appearance of calcifying plankton in the Mesozoic extended the main area of carbonate production and deposition beyond the continental margins to the open ocean environment (Zeebe and Westbroek, 2003; Ridgwell, 2005). The increased planktonic carbonate production changed the ocean’s carbonate chemistry to an overall lower saturation state (Zeebe and Westbroek, 2003), and created an important buffering capacity within the deep-sea through carbonate accumulation above, and carbonate dissolution below, the lysocline (Berger, 1978) and carbonate compensation depths (CCD) (Van Andel, 1974). Changes in pelagic carbonate production, dissolution and deep-sea burial are thus intricately linked to the long-term evolutionary and ecological success of calcifying plankton.
The most important pelagic calcifiers in today’s oceans are coccolithophores (haptophyte algae that surround their cells with µm-scale calcite platelets called coccoliths), planktic foraminifera (protists that form 100µm-scale calcitic tests) and pteropods (planktic gastropods with mm-scale aragonitic shells). Deep-sea sediments are however dominated by coccolith and foraminiferal carbonate, due to the fact that the aragonitic shells of pteropods are highly susceptible to dissolution (Berger, 1978; Schiebel 2002). Today, coccolith carbonate production is estimated to represent 1-10% of total marine carbon fixation (Poulton et al., 2007), while nannofossils (coccoliths and other µm-scale incertae sedis) account for roughly half of the total pelagic biogenic carbonate burial in Holocene sediments; the other half being provided by planktic foraminifera (Baumann et al., 2004; Frenz et al., 2005; Broecker and Clark, 2009).
Nannofossil carbonate mass accumulation rates are determined by the abundance and individual size (mass) of nannofossils, and depend on the environmental conditions favoring nannoplankton growth, dissolution processes in the water column and deep-sea as well as, on
geological timescales, speciation and extinction of species of variable size and carbonate mass. Most modern nannoplankton are much smaller in size (and mass) than their Miocene and older ancestors (e.g. Young, 1990; Henderiks and Pagani, 2008; Aubry 2009). The amounts, and respective proportions of nannofossil and foraminiferal carbonate burial may therefore have been very different in the geological past.
It is important to distinguish between these major pelagic carbonate producers because they represent both primary and secondary producers (phyto- vs. zooplankton) and have different physiological requirements and ecological responses to environmental perturbations. If we want to better understand large-scale and long-term changes in pelagic carbonate accumulation (e.g. Atlantic: Bohrmann et al., 1990; Rühlemann et al., 1996; Thiede et al., 1998; Indian Ocean: Davies et al., 1995; Pacific: Lyle, 2003; Pälike et al., 2012), we need to also consider long-term evolutionary change and/or paleoecological shifts within marine calcifiers. Here, we investigate how the macroevolutionary size decrease in calcareous nannoplankton has impacted global pelagic carbonate burial rates during the past 17 million years.
We have quantified fine fraction carbonate content and absolute nannofossil abundance in samples from five DSDP/ODP sites situated in the North and South Atlantic Ocean, Western and Eastern Indian Ocean and Western Pacific Ocean (Fig. 1). When considering carbonate burial rates, it is difficult to separate between the effects of changes in production and those of carbonate dissolution in the deep-sea, unless regional transects along a depth-gradient are investigated (Lyle, 2003). It is estimated that 65-80% of all pelagic carbonate production dissolves either in the water column or within surface sediments (e.g. Archer, 1996; Milliman et al., 1999). Hence, carbonate burial rates reflect only a small portion of the carbonate production that takes part in the long-term carbon cycle, by removing carbon from the superficial (atmosphere and ocean) to the sedimentary reservoirs (the long-term carbonate pump).
In our widely distributed selection of sites, we therefore primarily focus on the relationships between nannofossil-derived carbonate burial, the abundance of nannofossils (concentration and fluxes) and their individual mass (based on assemblage counts and species-specific mass estimates) to test the following hypotheses:
The long-term carbonate pump remained unaffected by nannoplankton size evolution, if the macroevolutionary size decrease in calcareous nannoplankton was paired with an increase in nannofossil abundance in the sediments, so that nannofossil-derived carbonate accumulation remained relatively stable over the past 17 Myrs. In other words, the same amount of carbonate could have been supplied by fewer and heavier, or more and light-weighted nannofossils. Higher nannofossil abundance could be due to increased nannoplankton biomass and/or export production, less carbonate dissolution (better preservation), or a combination of both (Hypothesis 1).
In the case that nannofossil fluxes remained stable over time (or decreased), smaller-sized nannoplankton would have led to lower nannofossil-derived carbonate burial. This may have resulted in a decrease in total pelagic carbonate accumulation rates (and decreased the strength of the long-term carbonate pump), unless the loss in nannofossil-derived carbonate was compensated by higher burial rates of other types of biogenic carbonate (e.g.
Alternatively, on the time scales considered here (>100 kyrs – 1 Myr), a decrease in nannofossil-derived and total pelagic carbonate burial rates could also indicate overall increased deep-sea carbonate dissolution; decreased weathering input; and/or increased neritic carbonate burial (e.g. Zeebe and Westbroek, 2003) (Hypothesis 3).
Figure 1: Locations of the studied DSDP/ODP sites (black stars) superimposed on contour map of carbonate concentration (wt.%) in deep-sea surface sediments (modified after Archer, 1996). All sites were positioned well-above the calcite lysocline during the investigated Miocene-Pleistocene time interval and consist of calcareous oozes (see Table 1).
2. Material and methods
2.1. Site locations and sedimentary size fractions
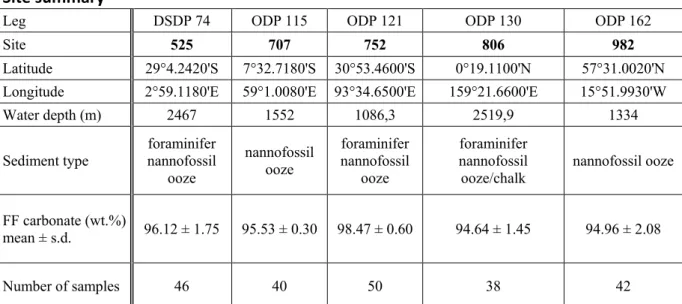
We analyzed a total of 216 discrete core samples of high-carbonate, foraminifer-nannofossil oozes from five DSDP/ODP sites (Fig. 1; Table 1), selected at water-depths well above the lysocline and with age-depth models established by bio- and magneto-stratigraphy in previous studies (Table 2). The interval between 3.5 – 10.5 Ma was sampled at a resolution of about 350 kyrs (Sites 525, 752, 806, 982) and 500 kyrs (Site 707). Sampling resolution was lower between 0 – 3.5 Ma, at roughly one sample per 1 Myr, but higher at Site 707 (250 kyrs). For the time interval between 10.5 – 17 Ma, sampling resolution varied between ~700 kyrs (Sites 525 and 752), ~1.2 Myrs (Sites 982 and 707) and 3.2 Myrs (Site 806).
Samples were freeze-dried and weighed (2.5-8 g) before being wet-sieved with CaCO3
-buffered distilled water into three separate size fractions (<38 µm (= fine fraction, FF), 38-63 µm and >38-63 µm). The FF was collected in suspension and concentrated on cellulose acetate membrane filters (diameter 47 mm, 0.45 µm pore size; Schleicher & Schuell/Whatman) using a Millipore vacuum pump. The separated fractions were oven-dried at 50°C and weighed again to determine their respective weight percent (wt.%) before further analysis. The fine fraction should be dominated by calcareous nannofossils, while the other two fractions mainly contain foraminifera (e.g. Chiu and Broecker, 2008).
Site summary
Leg DSDP 74 ODP 115 ODP 121 ODP 130 ODP 162
Site 525 707 752 806 982
Latitude 29°4.2420'S 7°32.7180'S 30°53.4600'S 0°19.1100'N 57°31.0020'N Longitude 2°59.1180'E 59°1.0080'E 93°34.6500'E 159°21.6600'E 15°51.9930'W Water depth (m) 2467 1552 1086,3 2519,9 1334 Sediment type foraminifer nannofossil
ooze nannofossil ooze foraminifer nannofossil ooze foraminifer nannofossil
ooze/chalk nannofossil ooze FF carbonate (wt.%)
mean ± s.d. 96.12 ± 1.75 95.53 ± 0.30 98.47 ± 0.60 94.64 ± 1.45 94.96 ± 2.08
Number of samples 46 40 50 38 42
Table 1: Summary of the selected DSDP/ODP sites (Moore et al., 1984; Backman et al., 1988; Peirce et al., 1989; Kroenke et al., 1991; Jansen et al., 1996).
2.2. Fine fraction CaCO3 content and mass accumulation rates
Shipboard analyses showed that the selected oozes had very high (>85%) bulk carbonate contents. In this study, the weight percent calcium carbonate (wt.% CaCO3) of the fine
fraction was measured by standard high-precision carbonate coulometry of discrete samples (15-30 mg), except for 11 samples that were analyzed using a Dietrich–Frühling calcimeter. For the latter measurements, 200 mg of powdered sample was mixed with 10 to 15 mL of 1M HCl. Two samples from Site 707 rendered not enough FF material to run the calcimeter; we used the mean wt.% CaCO3 value for that site in order to estimate accumulation rates and
perform other calculations for those specific samples.
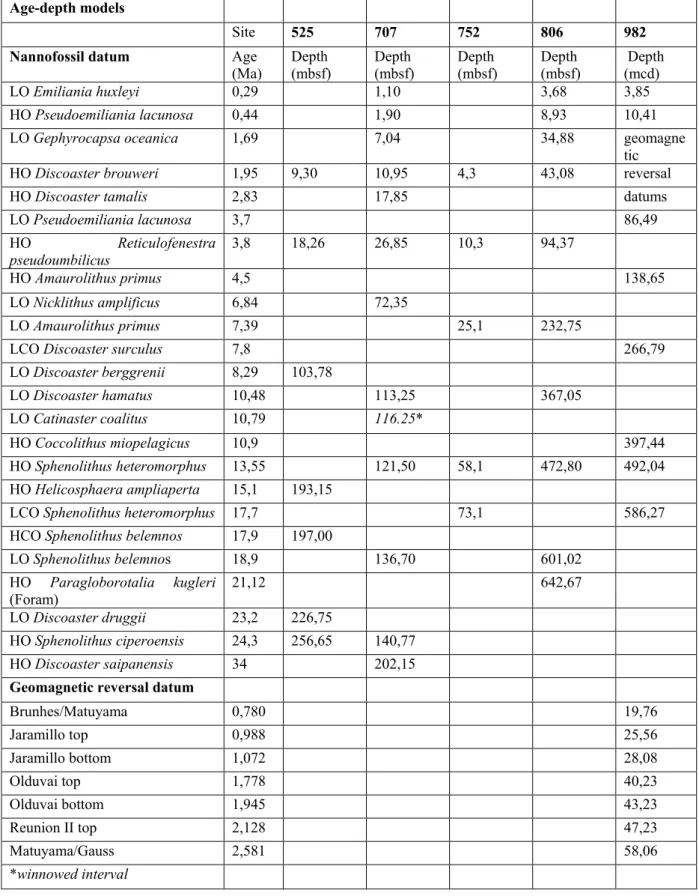
Age-depth models for each DSDP/ODP site are based on nannofossil datums (Raffi et al., 2006) and geomagnetic reversal boundaries (Table 2), calibrated to the Cande and Kent (1995) geomagnetic polarity time scale with updates from the astronomically tuned Neogene time scale (ATNTS2004) of Lourens et al. (2004). Linear sedimentation rates (LSR) between age-depth tie-points (m/My) vary widely between sites and over the past 17 Myrs. Bulk sediment mass accumulation rates (MAR) were estimated by multiplication of LSR and dry bulk density (DBD) as derived from Gaussian-smoothed interpolation of discrete sample measurements (IODP’s online Janus database; Shackleton et al., 1984). Mass accumulation rates (in g/m²/yr) for the fine fraction and fine fraction carbonate were calculated as follows: MARFF(carb) = LSR (m/Myr) × DBD (g/cm3) × FF (carbonate) (wt.%) (2) 2.3. Nannofossil quantification
A sub-set of fifty samples from the five sites was prepared to quantify nannofossil absolute abundance, using the random settling method of Beaufort (1991), which was calibrated by Geisen et al. (1999). Three to six milligrams of dry FF was suspended in 475 mL water and poured in a custom-made container holding a cover slide. After 24 hours, the container was slowly emptied and once the sediment on the slide was dry, the cover slide was fixed on a
microscopy slide using eukitt®. In each sample, a minimum of 500 nannofossils was counted using x1000 magnification, and the total number of fields of view recorded. The uncertainty in absolute abundance estimates is ±10.5% (95% confidence interval), based on reproducibility tests performed by Geisen et al. (1999) (1σ = 5.34%).
Absolute abundance (nannofossils/g FF) = (N × V) / (M × F × A × H) (3)
where
N = Number of nannofossils counted
V = Water volume used for suspension (mL) M = Mass of sediment added (g)
F = Number of fields of view observed A = Surface area of one field of view (cm²) H = Height of water column in the container (cm)
Taxonomy of Cenozoic nannofossils followed Young (1998) and pre-determined size distinctions were made within taxonomic groups to facilitate subsequent estimation of volumetric calcite mass (see below). The results are expressed in total nannofossils per gram of sediment (absolute abundance; nanno/g) and as compositional data, reflecting changes in the sampled nannofossil assemblages (relative abundance of taxonomic and/or size groups in percent). The nannofossil burial flux is represented in nannofossils per square meter per year (nanno/m²/yr):
Nannofossil burial flux = Absolute abundance (nanno/g FF) × MARFF (g/m²/yr) (4) 2.4. Nannofossil calcite volumetric weight estimates
To provide an estimate of the nannofossil carbonate burial rate, nannofossil burial fluxes were converted into carbonate mass fluxes, taking into account changes in the composition and thus variation in calcite mass of the different taxa. For this purpose, the average calcite mass (pg) of each taxonomic group was estimated based on mean length (maximum diameter, µm) and a species-specific shape factor (ks), following Young and Ziveri (2000) and Preiss-Daimler et
al. (2012). For all species and size-determined subgroups, two ranges in mass estimation around a mean value were determined. The first range is coded 'MeanPlus' and 'MeanMinus' and is calculated based on the mean length±0.3-1 µm and an extreme value for ks within the
reported range (lowest value ks for 'MeanMinus' and highest ks value for 'MeanPlus'). The
second and widest range is coded 'Min' and 'Max' and is calculated based on the minimum (or maximum) length of a nannofossil within its size-determined subgroups and the lowest value ks for 'Min' (and highest ks value for 'Max'). This data matrix is provided in Supplementary
Table S1. Each estimate was multiplied by 2.7 pg/µm3, the density of calcite, to derive
nannofossil mass:
Nannofossil MassMean = ks Mean × (nannofossil lengthMean)3 × 2.7 (5a)
Nannofossil MassMeanPlus = ks Max × (nannofossil lengthMean + a)3 × 2.7 (5b)
with a = between 0.3 – 1 µm
These nannofossil mass estimates provide two ways to estimate nannofossil carbonate quantitatively. The first is a proportional measure, the estimated nannofossil CaCO3 within
the fine fraction (g/g FF), corresponding to the sum of each nannofossil species’ absolute abundance multiplied by its respective nannofossil mass (always accounting for its estimated range):
Nannofossil CaCO3 = Σ (Absolute abundancespecies (nanno/g FF) × massspecies (g)) (6)
Figure 2: Selected sedimentological characteristics of the studied sites. (A) Bulk mass accumulation rates (MAR) in g/m²/yr; (B) Weight percentage of the <38 µm fine fraction (wt.%); (C) percentage of the 38-63 µm (wt.%) and (D) percentage of the >63 µm (wt.%).
The second is a burial rate, the nannofossil CaCO3 flux (g/m²/yr) corresponding to the sum of
each nannofossil species flux multiplied by its respective nannofossil mass (again accounting for the estimated ranges):
Nannofossil CaCO3 flux = Σ (Fluxspecies (nanno/m²/yr) × massspecies (g)) (7)
In both nannofossil CaCO3 and nannofossil CaCO3 flux calculations, the 'Min' and 'Max' also
include propagated uncertainty in nannofossil absolute abundance (see section 2.3.).
3. Results
3.1. Mass accumulation rates and fine fraction content
Bulk sediment mass accumulation rates were highest and comparable at Sites 982 (North Atlantic) and 806 (Western Pacific) (Fig. 2A). South Atlantic Site 525 revealed intermediate bulk MARs between ca. 15-4 Ma, before recording overall low MARs that are comparable to values estimated at Indian Ocean Sites 707 and 752 (Fig. 2A). The proportion of fine fraction (wt.%) is variable between sites as well as over time (Fig. 2B). All sites show a decreasing trend in wt.% FF from the Miocene to the Pliocene, with lowest values in Pleistocene samples. Overall, fine fraction proportions are higher at the Atlantic and Western Pacific sites than at the Indian Ocean sites (Fig. 2B). The results for fine fraction carbonate wt.% (not shown) are virtually the same as shown for wt.% FF (Fig. 2B), because the carbonate contents of the fine fractions are on average 94-98 wt.% (Table 1).
At Site 982, most samples contain >90 wt.% FF, with a decrease to 70 wt.% FF between 9-8.5 Ma and then decreasing further to ~65 wt.% FF after 4 Ma. At Site 525, samples range between 90-70 wt.% FF before 5 Ma, and decrease to 70-45 wt.% FF after 5 Ma. Here, the decreasing trend started earlier, around 6 Ma. At Site 806, the investigated samples mostly range between 70-80 wt.% FF. No clear trend could be established due to a lack of samples younger than 4 Ma, but the Pleistocene sample does reveal much lower wt.% FF. At Indian Ocean Site 752, a decreasing trend from 50 to 20 wt.% FF appears to have started at 11 Ma, with a minimum value of 9 wt.% FF measured in the youngest Pleistocene sample. A distinct 10% decrease is recorded between 9 Ma and 8 Ma. Finally, at Site 707, fine fraction content was fluctuating between 15-50 wt.% before 5 Ma, after which contributions crashed to values of ~10 wt.% FF in the Plio-Pleistocene, which could be due to winnowing at this shallow (1552 m) site (Okada, 1990).
The proportion of the 38-63 µm fraction is relatively stable through time in comparison to the other size fractions, varying between 0.3 and 13 wt.% (Fig. 2C). Overall, Atlantic sites have low values, <5 wt.% before 4 Ma and >5-13 wt.% after 4 Ma. Pacific and Indian oceans sites are more stable with values fluctuating between 5-10 wt.% 38-63 µm fraction, without any particular pattern. The coarsest, foraminifera dominated >63 µm fraction mirrors the wt.% FF patterns, becoming more prominent in terms of wt.% after 4 Ma (Fig. 2D).
Figure 3: Relative abundance data (%) of major nannofossil groups and average nannofossil calcite mass calculated for each sample. (A) Small Reticulofenestra spp. (<3 µm), including E. huxleyi and Gephyrocapsa spp. in the Pleistocene samples; (B) Larger Reticulofenestra spp. (>3 µm); (C) Co. pelagicus and Ca. leptoporus; (D) Average nannofossil calcite mass (in pg) with the associated 'Min' and 'Max' errors (see section 2.4). The average nannofossil calcite mass was about 40 pg at 9 Ma and reached <10 pg at 1 Ma.
3.2. Nannofossil species composition and average mass
Important evolutionary turnover within nannofossil assemblages occurred during the past 17 million years (Bown, 2005). This includes the last occurrences of discoasters and sphenoliths during the Pliocene and the first occurrence of Gephyrocapsa spp. and Emiliana huxleyi during the Pleistocene (Raffi et al., 2006). The interval between 3.5 – 10.5 Ma was sampled at a resolution of about 350 kyrs (Sites 525, 752, 806, 982) and 500 kyrs (Site 707). Sampling resolution was lower between 0 – 3.5 Ma, at roughly one sample per 1 Myr, but higher at Site 707 (250 kyrs). For the time interval between 10.5 – 17 Ma, sampling resolution varied between ~700 kyrs (Sites 525 and 752), ~1.2 Myrs (Sites 982 and 707) and 3.2 Myrs (Site 806). Regional differences in species composition are also expected, for example, Coccolithus
pelagicus was more abundant at high latitudes whereas sphenoliths and discoasters were more
abundant at low latitudes. Despite such regional overprints between sites, three time intervals can be distinguished based on the nannofossil assemblages (Fig. 3A-C):
(1) Between 17 – 9 Ma, assemblages contained low abundances (<10%) of small
Reticulofenestra spp. (<3 µm; Fig. 3A) and were dominated by large-sized coccoliths of Reticulofenestra spp. (>3 µm; Fig. 3B), or Coccolithus pelagicus and Calcidiscus leptoporus
(Fig. 3C); (2) The interval between 9 to ~4 Ma interval marks a transition towards increased abundances of small Reticulofenestra spp. (<3 µm; Fig. 3A), with increased contributions by sphenoliths at low-latitude Sites 806 and 707 (not shown, but see Supplementary Table S2); (3) After 4 Ma, assemblages were dominated by small-sized coccoliths with the consecutive dominance of small Reticulofenestra (<3 µm), Gephyrocapsa spp. and Emiliania huxleyi (the latter two are grouped with Reticulofenestra <3 µm in Fig. 3A because of their most recent, Pleistocene first appearance and similar small size).
The average nannofossil mass (Fig. 3D) decreased about four-fold after 9 Ma from ~40 pg to ~10 pg at 4 Ma, and decreased further to <10 pg at 1 Ma. This decrease is a direct consequence of the increased abundance of small nannofossils after 9 Ma.
3.3. Nannofossil absolute abundance and burial flux
The nannofossil absolute abundance within the fine fraction increased from the Miocene to the Pleistocene (Fig. 4A). Absolute abundance estimates ranged between 2 – 6×10⁹
nanno/g FF up to 4×10¹⁰ nanno/g FF. In general, the Atlantic Ocean samples (Sites 525 and
982) contain higher nannofossil abundances than the Indian Ocean samples (Sites 707 and 752), while the Western Pacific samples (Site 806) record the greatest range. Despite such regional differences, each site shows an increase in nanno/g FF through time (Fig. 4A).
The differences between Sites 707 and 752 (low values) and Sites 525, 806 and 982 (higher values) become even more pronounced when calculating the nannofossil burial fluxes (Fig. 4B), due to the low mass accumulation rates at the Indian Ocean sites. As a result, burial fluxes differ by an order of magnitude; the Indian Ocean samples are characterized by burial flux rates <3×10¹⁰ nanno/m²/yr, while the other sites record flux rates 5×10¹⁰ nanno/m²/yr up
to 1.5×10¹² nanno/m²/yr. At each site, the variation in nannofossil fluxes is quite large (about
one order of magnitude between minimum and maximum values), but the combined data set reveals no pronounced long-term trends (Fig. 4B).
Figure 4: Nannofossil quantitative data. (A) Nannofossil absolute abundance (nanno/g FF) ± 95% confidence interval; (B) Nannofossil flux (nanno/m²/yr) ± 95% confidence interval; (C) Nannofossil CaCO3 (g/g FF) with propagated ± 95% confidence interval and shape-factor associated 'Max' and 'Min' estimates (see section 2.4). The grey shading represents impossible values, resulting from error propagation. (D) Nannofossil CaCO3 flux
(g/m²/yr). For each value, associated uncertainties 'Min',
'MeanMinus', 'MeanPlus' and 'Max' are indicated (see section 2.4).
3.4. Nannofossil CaCO3 content and burial fluxes
Nannofossil CaCO3 represents the contribution of nannofossil-derived carbonate to the fine
fraction (in g/g FF; Fig. 4C). Although these estimates are subject to large error because of the indirect nannofossil “weighing” technique (almost 1 order of magnitude range, note the log-scale), the data still show a general offset between the Indian Ocean sites (lower values) and Atlantic Ocean sites (higher values). Over the time interval studied, only Site 806 samples appear relatively stable in their mean nannofossil CaCO3 content. The four other sites show
decreases over the last 4 Myr. Qualitative microscopy observations confirm that the Indian Ocean samples contain more fragments of foraminifera and detrital carbonate particles within the FF than the Atlantic and Pacific samples. It should also be noted that all samples contain variable amounts of small, unidentifiable calcite fragments, that arguably could derive from nannofossils, but which were not included in the nannofossil “weighing” approach. The fragments appeared smaller in size (and in some cases more abundant) in younger samples. Finally, nannofossil CaCO3 burial flux (Fig. 4D) integrates mass accumulation rates
(Fig. 2A), wt.% FF (Fig. 2B), nannofossil mass (Fig. 3D) and nannofossil absolute abundance (nanno/g FF; Fig. 4A). Compared to the nannofossil CaCO3 (Fig. 4C), this estimator of
nannofossil carbonate burial rate reveals a more pronounced pattern. In this analysis, Site 806 groups with the Atlantic Sites 525 and 982, due to high sedimentation rates. The Indian Ocean sites are again clearly separated from other sites with low fluxes due to overall low sedimentation rates (Fig. 4D). The most striking trends reflected by the entire dataset are a 35-80% decrease in bulk MAR (Fig. 2A), an overall 20-30% decline in FF content (70% decline at Site 707; Fig. 2B), and an even greater 80-95% plunge in nannofossil carbonate burial rates after 4 Ma (Fig. 4D).
4. Discussion
4.1. Contribution of calcareous nannofossils to fine fraction carbonate
Despite the time-consuming nature and relatively large uncertainties resulting from the applied methods, our estimations of nannofossil carbonate burial (Figs. 4C-D) provide valuable new results to explore the relationship(s) between nannoplankton size evolution and pelagic carbonate burial over the past 17 Myrs. Nevertheless, to avoid such tedious methodology, the carbonate wt.% within the FF is usually used as a nannofossil carbonate proxy. This approach is based on the observation that most of coccoliths and other calcareous nannofossils have a size ranging from 2 µm to 15 µm. Thus, fine fractions, whether <20 µm (e.g., Chiu and Broecker, 2008; Broecker and Clark, 2009), <32 µm (e.g., Ziveri et al., 2007) or <38 µm (this study), should predominantly contain calcareous nannofossils and exclude larger pelagic carbonate producers such as foraminifera and pteropods which are generally larger than 50 µm. The nannofossil CaCO3 in g/g FF (Fig. 4C) gives a quantitative estimation
of the mass proportion of nannofossils within the FF. Unfortunately, due to the nannofossil mass uncertainties, our results range from 1% to more than 100%. On average, however, we can conclude that the FF carbonate is not only composed of calcareous nannofossils and that there are important variations between sites. This is similar to observations made on <32 µm and <20 µm sediment fractions in a global compilation of oceanic sediment-traps (Ziveri et al., 2007).
Most previous studies point out two major issues in considering fine fraction carbonate as a quantitative estimator for nannofossil carbonate burial rate, which our quantitative and qualitative microscopy analyses also confirm. Firstly, quantitative estimations can be biased due to the presence of small foraminifera, small fragments of large pelagic carbonate producers (foraminifera, pteropods, fish) (Baumann et al., 2004; Perry et al., 2011), fragments of large benthic carbonate producers (foraminifera, echinoderms, bivalves, etc) (Lebrato et al., 2010) and abiotic, detrital carbonates from land. Secondly, the methodology applied here consistently underestimates the contribution of nannofossil fragments that are rarely counted because they are difficult to identify (Ziveri et al., 2007).
Despite substantial quantitative off-sets, the FF wt% (Fig. 2B) and nannofossil CaCO3
(Fig. 4C) have exactly the same trend in our samples; thus confirming that FF remains a useful qualitative estimator of nannofossil carbonate accumulation (e.g. Chiu and Broecker, 2008; Broecker and Clark, 2009). Recent developments in “coccolith weighing techniques” based on calcite birefringence under polarized light microscopy (Beaufort, 2005; Beaufort et al., 2014; Bollmann, 2014) may offer more time-efficient and accurate nannofossil carbonate quantification in future by limiting the mass uncertainties.
4.2. Impacts of downsizing the pelagic carbonate factory
4.2.1. Regional vs. global interpretations
Our dataset reveals long-term and global variations in nannofossil carbonate burial rates (Fig. 4D). Each investigated site clearly has a regional overprint, especially when comparing sedimentological parameters such as bulk MAR and sediment size fractions (Fig. 2). For example, both Indian Ocean sites experienced low bulk MAR (Fig. 2A) and low wt.% FF (Fig. 2B), always lower than the Atlantic and Pacific Ocean sites. Conversely, North Atlantic Ocean Site 982 revealed the highest wt.% FF and bulk MAR. Numerous previous studies have shown clear variations in global carbonate accumulation rate (CAR) between sites, even in the same region (e.g. Dickens and Owen, 1999; Grant and Dickens, 2002; Lyle, 2003; Diester-Haass et al, 2005, 2006; Pälike et al., 2012). These variations are mostly related to the water depth of the site, oceanic settings such as currents, distance to the coast and/or to upwelling regions, etc. Such different physical and chemical settings also strongly influence the biological production and could explain the site-to-site differences in nannofossil assemblages (Fig. 3) and fluxes (Fig. 4B).
However, the similarities between the different oceanic sites are even more striking in our dataset. For example, the distinct decreases in bulk MAR (Fig. 2A), wt.% FF (Fig. 2B) and nannofossil carbonate fluxes (Fig. 4D), observed after 4 Ma, are consistent between sites. A decrease in burial rates is observed at many other oceanic sites, following a period of enhanced biogenic sedimentation during the late Miocene (Farrell et al., 1995; Dickens and Owen, 1999; Grant and Dickens, 2002; Lyle, 2003; Diester-Haass et al., 2005, 2006).
The late Miocene-early Pliocene was characterized by a period of enhanced biogenic carbonate and opal sedimentation rates called the “biogenic bloom” (Farrell et al., 1995). The “biogenic bloom” was originally considered to have occurred in equatorial and tropical regions of the Pacific and Indian oceans from 6.7 Ma to 4.5 Ma (Farrell et al., 1995), but it has also been documented in the Atlantic Ocean (Diester-Haass et al., 2005). The exact timing
definition back to 7.6 Ma (Diester-Haass et al., 2006) and even from 3.5-3.8 Ma to 9 Ma (Dickens and Owen, 1999; Grant and Dickens, 2002). The differences in the duration of the "biogenic bloom" in different parts of the world are related to regional overprints on a global pattern (Diester-Haass et al., 2005, 2006; Zhang et al., 2009). For comparative purpose, we roughly bracket the "biogenic bloom" to have lasted from 4 Ma to 8 Ma. This global increase in pelagic sedimentation rates may have been related to intensified chemical weathering and enhanced oceanic nutrients supply (Pisias et al., 1995; Filippelli, 1997; Hermoyian and Owen, 2001; Gupta et al., 2004) and/or major redistribution of nutrients within the ocean (Farrell et al., 1995; Dickens and Owen, 1999). Such a period of enhanced burial rates, related to increased biological export production, would have been a way to counter-balance the decrease in average nannofossil mass (our Hypothesis 1), which already started around 9 Ma (Fig. 3D), resulting in the relatively stable nannofossil CaCO3 burial rates reconstructed
between 9 Ma and 4 Ma (Fig. 4D). After 4 Ma and the end of the "biogenic bloom" interval, the nannofossil flux appears to have stabilized or decreased (Fig. 4B) while the nannoplankton average mass was small (Fig. 3B), leading to a crash in nannofossil CaCO3
flux (Fig. 4D) (our Hypothesis 2).
Figure 5: Comparison of nannofossil versus planktic foraminifera contribution to pelagic carbonate burial. (A) <38 µm FF MAR (g/m²/yr) is composed mainly of calcareous nannofossils and shows a clear decrease after 4 Ma; (B) >38 µm MAR (g/m²/yr) is composed mainly of planktic foraminifera and remained relatively stable for the past 17 Ma.
4.2.2. Did other pelagic calcifiers make up for the loss in nannofossil carbonate?
The five sites discussed here belong to the pelagic realm and consist of calcareous ooze deposited above the lysocline. We therefore infer that the sediment supply primarily depended on calcareous nannoplankton and planktic foraminifera production exported to the deep sea, and to a lesser extent benthic foraminifera production (Dickens and Owens, 1999; Diester-Haass et al., 2005), balanced by carbonate dissolution in the water column and surface sediments (e.g. Milliman et al., 1999).
Compared to the FF MAR (Fig. 5A) (and related nannofossil CaCO3 flux, Fig. 4D), the MAR
of the larger size fraction (>38 µm; mostly composed of planktic foraminifera) remained surprisingly stable over the past 17 Myrs (Fig. 5B). It follows that the “crash” in bulk and carbonate MAR after 4 Ma (Fig. 2A) is mainly due to greatly diminished nannofossil carbonate burial (Fig. 4D), which we have shown to link in with the macroevolutionary decrease in individual nannofossil mass (Fig. 3D) (Hypothesis 2). Importantly, this “crash” was not compensated by an increase in foraminifera burial rate.
4.2.3. Evolution towards a “modern” pelagic carbonate composition
In modern oceans, pelagic carbonate burial is supported, more or less in equal proportions, by foraminifera and coccolithophores (Schiebel, 2002; Baumann et al., 2004; Broecker and Clark, 2009). It follows from our dataset that this is a geologically recent feature, and that nannofossil-derived carbonate supported the bulk of pelagic carbonate burial at the investigated Atlantic and Pacific sites until the late Miocene – early Pliocene. With the unprecedented turnover leading to their average size reduction since the late Miocene, the nannoplankton reign on the pelagic carbonate accumulation has been greatly diminished. It could even be supposed that calcareous nannoplankton ruled the pelagic carbonate production since their first occurrence in the fossil record in the Late Triassic (Preto et al., 2013) although the pelagic carbonate mass accumulation remained rather low until the Cretaceous (Bornemann et al., 2003; Gréselle et al., 2011; Suchéras-Marx et al., 2012).
Calcareous nannoplankton represented the most prominent marine primary producers (preserved in the fossil record) for most of the Cenozoic. During the Neogene, the diatoms diversified (Lazarus et al., 2014) to become today’s main primary producers (Falkowski et al., 2004). Most importantly, the ecological replacement of coccolithophores (calcifying) by diatoms (silicifying) impacted the marine carbonate cycle because neither diatoms nor planktic foraminifera replaced coccolithophores in terms of pelagic carbonate production. Thus, a combination of the macroevolutionary size decrease and reduced ecological success of calcareous nannoplankton, the increasing ecological prominence of diatoms and the apparent stability of planktic foraminifera-carbonate burial rates during the Neogene, led to a decrease in pelagic carbonate burial and downsizing of the long-term carbonate pump – which, given the many challenges related to current ocean acidification (e.g. Solomon et al., 2007; Fabry, 2008), may continue in future.
Figure 6: Global estimates of pelagic carbonate burial rates (g CaCO3/yr) over the past 17 Myrs.
Total pelagic carbonate (blue curve), fine fraction carbonate (green curve) and nannofossil CaCO3
accumulation (red curve) were calculated based on the total deep-sea surface area above the lysocline, multiplied by weighted and smoothed carbonate MAR (g/m2/yr) results presented in this
study. The blue box corresponds to modern global ocean carbonate flux estimations (see section 4.2.4.) and the green box 50% of the total pelahic carbonate. Changes in the depth of the lysocline were estimated based on modern ocean observations (approximated to Ωcalcite = 0.8 according to
Ridgwell and Zeebe, 2005; GLODAP database, Key et al., 2004) using Ocean Data View software (Schlitzer, 2013) and average lysocline depth variations since 17 Ma (white squares, Tyrrell and Zeebe, 2004). LOESS (LOcal weighted Scatterplot Smoothing; smoothing factor q = 0.5) was performed on carbonate MAR data, averaging all 5 sites and re-sampling at 1-Myr steps using a linear algorithm (PAST software 2.17b; Hammer et al., 2001). The resulting red curve corresponds to global nannofossil CaCO3 accumulation (g/yr) based on mean nannofossil CaCO3 flux, the deep red
interval to the LOESS 95% confidence interval (CI) based on mean nannofossil CaCO3 flux, and the
faded interval to the LOESS 97.5% CI on maximum estimate of nannofossil CaCO3 flux and LOESS
2.5% CI on the minimum estimate of nannofossil CaCO3 flux (see section 2.4.). The same approach
was used for the green curve, FF CAR with the faded interval corresponding to maximum and minimum uncertainties on DBD and carbonate content. The blue curve corresponds to the total pelagic carbonate accumulation, the faded blue interval to the LOESS 95% CI. This analysis suggests that both nannofossil-derived and total carbonate accumulation decreased after 4 Ma, despite the deepening of the lysocline.
4.2.4. Carbon cycle implications
The overall constancy of the CCD and thus saturation state over the past 100 Myrs is evidence for a well-developed carbonate compensation mechanism regulating any imbalance between weathering input and burial output (Zeebe and Westbroek, 2003; Tyrrell and Zeebe, 2004). In the modern ocean, biogenic carbonate is overproduced by about four times the weathering-derived riverine input (Broecker and Peng, 1982; Zeebe and Westbroek, 2003). However, our dataset implies that the efficiency of the long-term carbonate pump has decreased during the Pliocene and has remained at a minimum since the Pleistocene. On time scales larger than 10,000 years, weakened pelagic carbonate burial since the Pliocene may reflect a change in the riverine fluxes (and thus continental weathering rates) and/or a change in the whole-ocean inventories of DIC, TA and Ca2+ (Zeebe and Westbroek, 2003). Tyrrell and Zeebe (2004)
averaged a global ~700 m deepening of the CCD from the middle Miocene, suggesting that a decrease in nannofossil carbonate burial, recorded at five sites located well-above above the lysocline, was not due to intensified carbonate dissolution in the deep-sea (our Hypothesis 3). A decrease in nannofossil carbonate burial could have been compensated by enhanced neritic carbonate deposition, but the extent of carbonate platforms between the late Miocene and the Pliocene is very poorly estimated (Walker et al., 2002; Kiessling et al., 2003) limiting any approximation of platform-derived carbonate mass accumulation.
As the CCD and lysocline deepened, the area accommodating pelagic carbonate burial would have increased. So could it be that the decreased carbonate burial rates that we record at each site reflect this increased spatial accommodation, rather than a decrease in the global budget of pelagic carbonate burial? (Or, could it be a case of “spreading the same amount of butter more thinly over a larger piece of toast”?) We addressed this issue by calculating the modern-day, total deep-sea surface area above the calcite saturation horizon (CSH, Ωcalcite = 1) and
above the lysocline (Ωcalcite = 0.8; Ridgwell and Zeebe, 2005) using the GLODAP database
(Key et al., 2004). From there, we backtracked these depths in 100 m steps to reflect the ~700 m shallower CCD during the middle Miocene (Fig. 6), and estimated the relative change in potential deposition area over the past 17 Myr. A 700 m deepening of the lysocline results in an increase of the deposition area by a factor of ~1.6.
Figure 6 illustrates the estimates of carbonate burial (total in blue, fine fraction in green, and nannofossil in red) above the lysocline (in g CaCO3/yr), taking into account the relative
changes in deposition area as well as 1 Myr-spaced, resampled LOESS average of bulk, FF and nannofossil CaCO3 fluxes (see Fig. 6 legend for further information). With due credit to
the large uncertainties (shadings) and the limitations of interpolating “global average” results based on only five sites, this exercise reveals that total carbonate burial above the lysocline (blue curve) has remained relatively stable between 17-4 Ma (~1 Pg CaCO3/yr) and then
decreased down to 0.6 Pg CaCO3/yr. This decrease after 4 Ma relates to distinct decreases in
FF carbonate (green curve) and nannofossil carbonate burial (red curve), which are clearly not compensated by the lysocline deepening and increased area of carbonate deposition. The total carbonate burial rates (0.6 – 1 Pg CaCO3/yr) resulting from our extrapolation correspond well
to previous quantitative inventories of the global carbonate cycle – with annual flux estimates of 0.1-0.2 Pg C/yr in the pelagic realm (corresponding to 0.8-1.7 Pg CaCO3/yr) and
On the time scales investigated here (hundred of thousands – millions years), we assume that at each point in time the ocean carbonate compensation is in steady state and that CO2
released by volcanoes is balanced by silicate weathering and subsequent carbonate burial in the ocean (e.g. Zeebe, 2012). Silicate weathering rates compensate (or regulate) the rate of loss of carbon through CaCO3 burial (both in the deep-sea and neritic environments). So could
the downsizing of the pelagic carbonate pump reflect decreased weathering rates since the Pliocene?
During the Cenozoic, chemical weathering of silicate rocks is the most likely process by which atmospheric CO2 levels (pCO2) were brought down from >1000 ppmv during the
Eocene, to relatively low values (<500 ppmv) since the Miocene (Berner and Kothavala, 2001; Pagani et al., 2009; Zhang et al., 2013). Given Pliocene-Pleistocene proxy data (Figs. 7C-D), a cool climate, increased continental ice volume (Zachos et al., 2008) and low atmospheric CO2 (Seki et al, 2010; Bartoli et al., 2011) would support less chemical
weathering. However, no proxy data were found in the literature to support a decrease in weathering rates during the past 4 Myrs (Griffith et al., 2008; Misra and Froelich, 2012). This and other scenarios should be explored further using carbon cycle models, in combination with more detailed pelagic and neritic carbonate burial estimates during the Plio-Pleistocene.
4.3. Possible factors influencing size decrease in nannoplankton
4.3.1. Macroevolution and long-term climate
We have documented a substantial change in pelagic carbonate mass accumulation related to the size decrease of calcareous nannoplankton. The decrease in large, heavily calcified nannoplankton taxa cannot be explained by intensified (selective) dissolution. Arguably, the appearance and increased abundance of small and lightly calcified taxa would rather point to overall better preservation potential of nannofossils over the past 17 Myrs. Hence, we conclude that the progressive disappearance of large taxa, and increase in small taxa is a true macroevolutionary trend. The remaining questions are centered on the origin of this macroevolutionary change.
The Miocene-Pliocene transition documents a major evolutionary turnover and decrease in nannofossil diversity (Bown, 2005; Aubry, 2007) characterized by the last occurrences of common Miocene species (e.g. Gibbs et al., 2005; Raffi et al., 2006). This time interval seems to be the culmination of a long-term loss in ecological prominence of calcareous nannoplankton since the Eocene greenhouse world (e.g. Hannisdal et al., 2012). Our data confirm that small and lightly calcified coccolithophores globally increased their relative ecological success since the late Miocene (~9 Ma), an observation documented in previous studies of Pacific Site 806 (Takayama, 1993; Fig. 7A) and several deep-sea sites in the Indian Ocean (Young, 1990). This trend continued with the Pleistocene evolution of today’s most prominent blooming coccolithophore species Emiliania huxleyi and Gephyrocapsa spp. (e.g. Raffi et al., 2006).
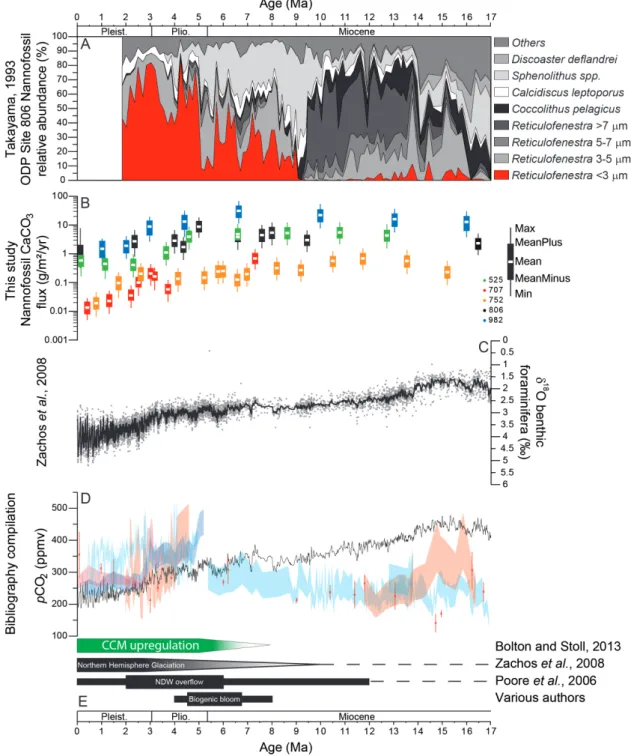
Figure 7: Comparison of various paleo-proxy data and timing of relevant events during the past 17 Myrs. (A) Nannofossil assemblage variations at Western Pacific Site 806 (Takayama, 1993); (B) Nannofossil CaCO3 flux (g/m²/yr) (this study); (C) Global deep-sea δ18O record (Zachos et al., 2008);
(D) Paleo-pCO2 estimates based on boron isotopes (red; Pearson and Palmer, 2000; Seki et al., 2010;
Bartoli et al., 2011; Foster et al., 2012; Badger et al., 2013), alkenones (blue; Pagani et al., 2009; Seki et al., 2010; Badger et al., 2013) and model (black line; van de Wal et al., 2011); (E) Relative timing of upregulation of carbon concentrating mechanisms (CCMs) in coccolithophores, as interpreted from the divergence in carbon and oxygen isotopic signatures between small and large fossil coccoliths (Bolton and Stoll, 2013); Northern Hemisphere Glaciation (Zachos et al., 2008); NDW overflow (Poore et al., 2006); and average duration of the 'biogenic bloom' interval (Farrell et al., 1995; Dickens and Owen, 1999; Hermoyian and Owen, 2001; Grant and Dickens, 2002;
Diester-The long-term trends in nannofossil CaCO3 fluxes (Fig. 7B) seem to mirror proxy records of
overall climatic cooling and intensified glacial-interglacial variability (Fig. 7C; Zachos et al., 2008), and, for the Plio-Pleistocene interval, decreasing pCO2 (Fig. 7D; e.g. Seki et al., 2010).
However, the shift in nannofossil assemblages at ~9 Ma (Figs. 3A-B and 7A) is not characterized by any distinct global changes in ocean temperature (Fig. 7C; Zachos et al., 2008), circulation (Poore et al., 2006), or paleo-pCO2 proxy records (Fig. 7D; Pagani et al.,
2009; Badger et al., 2013).
What were the ecological advantages for small, lightly calcified nannoplankton taxa? For many species, coccolith size is a good estimator for cell size (Henderiks, 2008; Gibbs et al., 2013). Small cells, with faster resource uptake rates, tend to grow faster than large cells under similar environmental conditions (e.g. Finkel et al., 2010). Changes in nutrient availability, as inferred for the late Miocene – early Pliocene “biogenic bloom” period (section 4.2.1), may have triggered the rise of small opportunistic species (where nutrients were high), or the persistence of small species able to outcompete larger taxa under nutrient limitation as the oceans were cooling and becoming more stratified (cf. Falkowski and Oliver, 2007) since the Pliocene. The observation that smaller-sized nannoplankton became globally more prominent and were able to outcompete larger taxa during the late Miocene – early Pliocene, may also relate to selective pressures on both photosynthesis and calcification in a low-CO2 world, as
we will discuss in more detail below.
4.3.2. Selective pressure and adaptation: CO2 limitation?
Calcareous nannoplankton use carbon for photosynthesis and calcification, both processes operating within the single haptophyte cell (e.g. Rost et al., 2003). Diffusive uptake of CO2
consumes the least energy, but most modern unicellular eukaryotic algae are CO2-limited and
need active transport of HCO3- (carbon concentration mechanisms; CCMs) for
photosynthesis; and calcification, in the case of coccolithophores (Giordano et al., 2005). Large cells, with larger volume to surface area ratios that slow down diffusive uptake rates, may be more sensitive to CO2(aq)-limitation. Culture experiments under ambient, CO2-limiting
conditions reveal that large-celled coccolithophores (namely Coccolithus pelagicus spp.
braarudii) increase active HCO3- transport to sustain photosynthesis at the expense of active
HCO3- transport for calcification, which leads to a distinct lowering of the δ13C and δ18O
signatures in coccolith calcite in comparison to small-celled species Gephyrocapsa oceanica and Emiliania huxleyi (Rickaby et al., 2010; Bolton and Stoll, 2013). This species-specific isotopic fractionation, and the differences between large- and small species, disappears when the same modern coccolithophores are grown at increased dissolved inorganic carbon concentrations at constant pH (Rickaby et al., 2010). Bolton and Stoll (2013) demonstrated that this divergence in stable isotopic signatures between small and large fossil coccoliths started during the late Miocene, which they interpreted as proof for the upregulation of CCMs as a consequence of a CO2 decrease below a critical threshold-value starting around 7 Ma at
low latitudes.
Our nannofossil assemblage and size data indicate that small species already started replacing larger Miocene species about two million years earlier, which could be interpreted as an ecological adaptive response to the same environmental pressures that eventually led to the changes in carbon acquisition strategies in coccolithophores further down the evolutionary
path. Alternatively, the time discrepancy between the fossil assemblage record and the geochemical record from Bolton and Stoll (2013) may result from the relatively coarse sampling resolution in the latter, combined with small isotopic differences between large and small coccoliths before 7 Ma. Additional paired biogeochemical and calcareous nannofossil proxy records should allow constraining this hypothesis further.
On a final note, the macroevolutionary size decrease should not be interpreted as the result of stressful conditions for the whole nannoplankton community as often proposed (Gibbs et al., 2005; Erba et al., 2010). Lineages of small coccolithophores (i.e. Noelaerhabdaceae and Syracosphaeraceae) have flourished exhibiting high diversity and remarkable specialization (Aubry, 2007; 2009) partly in relation to the invasion of the ecological niches left behind by larger “pre-Miocene world” taxa.
5. Conclusions
This study offers a first quantitative exploration of how macroevolutionary changes in pelagic calcifiers may have affected the marine carbonate cycle during the Neogene. Modern pelagic carbonate burial is supported in relative equal proportions by planktic foraminifera and calcareous nannoplankton (mainly coccolithophores), but until the early Pliocene (~4 Ma) pelagic carbonate burial was dominated by calcareous nannoplankton. We focused our analyses on the late Miocene-early Pliocene interval because that is when the most distinct macroevolutionary changes in nannofossil size were expected (and found). Our data show that small, lightly calcified coccolithophores gradually increased their ecological success and out-competed large, more heavily calcified species since the late Miocene (~9 Ma). The macroevolutionary decrease in average nannoplankton size (and mass) had, however, little impact on nannofossil-derived carbonate burial rates until they decreased after 4 Ma. This was most likely because of overall enhanced bio-sedimentation during the late Miocene “biogenic bloom” interval.
The long-term trends in nannofossil carbonate burial were consistent between globally distributed sites, and a global extrapolation highlights that the loss in nannofossil carbonate since 4 Ma was not compensated by either an increase in accumulation of foraminifera, nor a deepening of the lysocline and increased area for pelagic carbonate sedimentation. Whether a decrease in total pelagic carbonate accumulation reflects a decrease in silicate weathering since the Pliocene (during which proxy records suggest decreasing pCO2 levels) would need
to be explored with more sophisticated global carbon models in combination with extended empirical data on pelagic and neritic carbonate burial rates during the Plio-Pleistocene.
Acknowledgements
The groundwork for this research was supported by an EC Marie Curie Individual fellowship to JH (HPMF-CT-2002-01556). The presented synthesis benefited from continued financial support by the Swedish Research Council (VR 621-2003-3614) and the Royal Swedish Academy of Sciences through a grant from the Knut and Alice Wallenberg Foundation (KAW 2009.0287). BSM acknowledges financial support from the Palaeobiology Group, Uppsala University. We are grateful to Emanuela Mattioli for laboratory access, Pascal Allemand who provided the deep-sea surface map model for carbonate mass accumulation reconstruction and
References
Archer, D.E., 1996. An atlas of the distribution of calcium carbonate in sediments of the deep sea. Global Biogeochem. Cy. 10(1), 159-174.
Aubry, M.-P., 2007. A major Pliocene coccolithophore turnover: Change in morphological strategy in the photic zone. In: S. Monechi, Coccioni, Rampino, R.M. (Eds.), Large Ecosystem Perturbations: Causes and Consequences. Geological Society of America Special Paper, pp. 21-51.
Aubry, M.-P., 2009. A sea of Lilliputians. Palaeogeogr., Palaeocl., Palaeoeco. 284(1-2), 88-113.
Backman, J., Duncan, R.A., et al., 1988. Proceedings of the Ocean Drilling Program, Initial Reports, 115. College Station, TX.
Badger, M.P.S., Lear, C.H., Pancost, R.D., Foster, G.L., Bailey, T.R., Leng, M.J., Abels, H.A., 2013. CO2 drawdown following the middle Miocene expansion of the Antarctic Ice
Sheet. Paleoceanography 28(1), 42-53.
Bartoli, G., Hönisch, B., Zeebe, R.E., 2011. Atmospheric CO2 decline during the Pliocene
intensification of Northern Hemisphere glaciations. Paleoceanography 26(4), PA4213. Baumann, K.-H., Böckel, B., Frenz, M., 2004. Coccolith contribution to South Atlantic
carbonate sedimentation. In: Thierstein, H.R., Young, J.R. (Eds.), Coccolithophores: From molecular processes to global impact. Springer-Verlag, Berlin Heidelberg, pp. 367-402. Beaufort, L., 1991. Adaptation of the random settling method for quantitative studies of
calcareous nannofossils. Micropaleontol. 37, 415-418.
Beaufort, L., 2005. Weight estimates of coccoliths using the optical properties (birefringence) of calcite. Micropaleontol. 51(4), 289-298.
Beaufort, L., Barbarin, N., Gally, Y., 2014. Optical measurements to determine the thickness of calcite crystals and the mass of thin carbonate particles such as coccoliths. Nat. Protoc. 9, 633-642.
Berger, W.H., 1978. Deep-sea carbonate: pteropod distribution and the aragonite compensation depth. Deep-Sea Res. 25, 447-452.
Berner, R.A., 2004. A model for calcium, magnesium and sulfate in seawater over Phanerozoic time. Am. J. Sci. 304, 438-453.
Berner, R.A., Kothavala, Z., 2001. GEOCARB III: A revised model of atmospheric CO2 over Phanerozoic time. Am. J. Sci. 301(2), 182-204.
Bohrmann, G., Heinrich, R., Thiede, J., 1990. Miocene to Quaternary paleoceanography in the northern North Atlantic: variability in changes in carbonates and biogenic opal accumulation. In: Bleil, U., Thiede, J. (Eds.), Geological History of the Polar Oceans: Arctic versus Antarctic. NATO ASI Series C, pp. 647-675.
Bollmann, J., 2014. Technical Note: Weight approximation of coccoliths using a circular polarizer and interference colour derived retardation estimates – (The CPR Method). Biogeosciences 11, 1899-1910.
Bolton, C.T., Stoll, H.M., 2013. Late Miocene threshold response of marine algae to carbon dioxide limitation. Nature 500(7464), 558-562.
Bornemann, A., Aschwer, U., Mutterlose, J., 2003. The impact of calcareous nannofossils on the pelagic carbonate accumulation across the Jurassic-Cretaceous boundary. Palaeogeogr., Palaeocl., Palaeoeco. 199, 187-228.
Bown, P. R., 2005. Calcareous nannoplankton evolution: a tale of two oceans Micropaleontol. 51(4), 299-308.
Broecker, W.S., Peng, T.-H., 1982. Tracers in the Sea, Lamont-Doherty Earth Observatory, Palisades, New York, 690 pp.
Broecker, W., Clark, E., 2009. Ratio of coccolith CaCO3 to foraminifera CaCO3 in late
Holocene deep sea sediments. Paleoceanography 24(3), PA3205.
doi:10.1029/2009PA001731.
Cande, S.C., Kent, D.V., 1995. Revised calibration of the geomagnetic polarity timescale for the Late Cretaceous and Cenozoic. J. Geophys. Res.-Sol. Ea. 100(B4), 6093-6095.
Chiu, T.-C., Broecker, W.S., 2008. Toward better paleocarbonate ion reconstructions: New insights regarding the CaCO3 size index. Paleoceanography 23(2), PA2216. doi:10.1029/2008PA001599
Davies, T.A., Kidd, R.B., Ramsay, A.T.S., 1995. A time-slice approach to the history of Cenozoic sedimentation in the Indian Ocean. Sediment. Geol. 96(1-2), 157-179.
Dickens, G.R., Owen, R.M., 1999. The Latest Miocene–Early Pliocene biogenic bloom: a revised Indian Ocean perspective. Mar. Geol. 161(1), 75-91..
Diester-Haass, L., Billups, K., Emeis, K.C., 2005. In search of the late Miocene–early Pliocene “biogenic bloom” in the Atlantic Ocean (Ocean Drilling Program Sites 982, 925, and 1088). Paleoceanography 20(4), PA4001. doi:10.1029/2005PA001139.
Diester-Haass, L., Billups, K., Emeis, K.C., 2006. Late Miocene carbon isotope records and marine biological productivity: Was there a (dusty) link?. Paleoceanography, 21(4), PA4216. doi:10.1029/2006PA001267.
Erba, E., Bottini, C., Weissert, H., Keller, C.E., 2010. Calcareous nannoplankton response to surface-water acidification around Oceanic Anoxic Event 1a. Science 329, 428-432.
Fabry, V.J., 2008. Marine calcifiers in a high-CO2 ocean. Science 320, 1020-1022.
Falkowski, P.G., Scholes, R.J., Boyle, E., Canadell, J., Canfield, D., Elser, J., Gruber, N., Hibbard, K., Högberg, P., Linder, S., Mackenzie, F.T., Moore III, B., Pedersen, T., Rosenthal, Y., Seitzinger, S., Smetacek, V., Steffen, W., 2000. The global carbon cycle: A test of our knowledge of Earth as a system. Science 290, 291-296.
Falkowski, P.G., Katz, M.E., Knoll, A.H., Quigg, A., Raven, J.A., Schofield, O., Taylor, F.J.R., 2004. The Evolution of Modern Eukaryotic Phytoplankton. Science 305, 354-360. Falkowski, P. G., Oliver, M. J., 2007. Mix and match: how climate selects phytoplankton.
Nature Rev. Microbiol. 5, 813-819.
Farrell, J. W., Raffi, I., Janecek, T.R., Murray, D.W., Levitan, M., Dadey, K.A., Emeis, K.-C., Lyle, M., Flores, J.-A., Hovan, S., 1995. Late Neogene sedimentation patterns in the eastern equatorial Pacific Ocean. In: Pisias, N.G., Mayer, L.A., Janecek, T.R., et al. (Eds.), Proceedings ODP, Scientific Results. College Station, Texas (Ocean Drilling Program), v. 138, pp. 717-756.
Feely, R.A., Sabine, C.L., Lee, K., Berelson, W., Kleypas, J., Fabry, V.J., Millero, F.J., 2004. Impact of anthropogenic CO2 on the CaCO3 system in the Oceans. Science 305, 362-366.
Filippelli, G.M., 1997. Intensification of the Asian monsoon and a chemical weathering event in the late Miocene–early Pliocene: Implications for late Neogene climate change. Geology 25, 27-30.
Finkel, Z. V., Beardall, J., Flynn, K. J., Quigg, A., Rees, T. A. V., Raven, J. A., 2010. Phytoplankton in a changing world: cell size and elemental stoichiometry. J. Plankton Res. 32(1), 119-137.
Foster, G.L., Lear, C.H., Rae, J.W.B., 2012. The evolution of pCO2, ice volume and climate
during the middle Miocene. Earth Planet. Sc. Lett. 341-344, 243-254.
Frenz, M., Baumann, K.-H., Böckel, B., Höppner, R., Henrich, R., 2005. Quantification of foraminifer and coccolith carbonate in South Atlantic surface sediments by means of carbonate grain-size distributions. J. Sediment. Res. 75(3), 464-475.
Geisen, M., Bollmann, J., Herrle, J.O., Mutterlose, J., Young, J.R., 1999. Calibration of the random settling technique for calculation of absolute abundances of calcareous nannoplankton. Micropaleontol. 45(4), 437-442.
Gibbs, S. J., Young, J.R., Bralower, T.J., Shackleton, N.J., 2005. Nannofossil evolutionary events in the mid-Pliocene: an assessment of the degree of synchrony in the extinctions of
Reticulofenestra pseudoumbilicus and Sphenolithus abies. Palaeogeogr., Palaeocl.,
Palaeoeco. 217(1–2), 155-172.
Gibbs, S.J., Poulton, A.J., Bown, P.R., Daniels, C.J., Hopkins, J., Young, J.R., Jones, H., L., Thiemann, G.J., O'Dea, S.A., Newsam, C., 2013. Species-specific growth response of coccolithophores to Palaeocene-Eocene environmental change. Nat. Geosci. 6, 218-222. Giordano, M., Beardall, J., Raven, J.A., 2005. CO2 concentrating mechanisms in algae:
mechanisms, environmental modulation, and evolution. Annual Review of Plant Biology 56, 99-131.
Grant, K. M., Dickens, G.R., 2002. Coupled productivity and carbon isotope records in the southwest Pacific Ocean during the late Miocene-early Pliocene biogenic bloom. Palaeogeogr., Palaeocl., Palaeoeco. 187(1-2), 61-82.
Gréselle, B., Pittet, B., Mattioli, E., Joachimski, M., Barbarin, N., Riquier, L., Reboulet, S., Pucéat, E., 2011. The Valanginian isotope event: A complex suite of palaeoenvironmental perturbations. Palaeogeogr., Palaeocl., Palaeoeco.306(1-2), 41-57.
Griffith, E.M., Paytan, A., Caldeira, K., Bullen, T.D., Thomas, E., 2008. A dynamic marine calcium cycle during the past 28 Million years. Science 322, 1671-1674.
Gupta, A.K., Singh, R.K., Joseph, S., Thomas, E., 2004. Indian Ocean high-productivity event (10–8 Ma): Linked to global cooling or to the initiation of the Indian monsoons? Geology 32(9), 753-756.
Hammer, Ø., Harper, D.A.T., Ryan, P.D., 2001. PAST: paleontological statistics software package for education and data analysis. Palaeontol. Electron. 4, 1-9.
Hannisdal, B., Henderiks, J., Liow, L.H., 2012. Long-term evolutionary and ecological responses of calcifying phytoplankton to changes in atmospheric CO2. Glob. Change Biol.
doi: 10.1111/gcb.12007.
Henderiks, J., 2008. Coccolithophore size rules - Reconstructing ancient cell geometry and cellular calcite quota from fossil coccoliths. Mar. Micropaleontol. 67, 143-154.
Henderiks, J., Pagani, M., 2008. Coccolithophore cell size and the Paleogene decline in atmospheric CO2. Earth Planet. Sc. Lett. 269, 575-583.
Hermoyian, C. S., Owen, R.M., 2001. Late Miocene-early Pliocene biogenic bloom: Evidence from low-productivity regions of the Indian and Atlantic Oceans, Paleoceanography 16(1), 95-100.
Jansen, E., Raymo, M.E., Blum, P., et al., 1996. Proceedings of the Ocean Drilling Program, Initial Reports, 162. College Station, TX.
Key, R.M., Kozyr, A., Sabine, C.L., Lee, K., Wanninkhof, R., Bullister, J.L., Feely, R.A., Millero, F.J., Mordy, C., Peng, T.H., 2004. A global ocean carbon climatology: Results from Global Data Analysis Project (GLODAP). Global Biogeochem. Cy. 18(4), GB4031. Kiessling, W., Flügel, E., Golonka, J.A.N., 2003. Patterns of Phanerozoic carbonate platform
sedimentation. Lethaia 36(3), 195-225.
Kroenke, L.W., Berger, W.H., Janecek, T.R., et al., 1991. Proceedings of the Ocean Drilling Program, Initial Reports, 130. College Station, TX.
Lazarus, D., Barron, J., Renaudie, J., Diver, P., Türke, A., 2014. Cenozoic planktonic marine diatom diversity and correlation to climate change. PLoS ONE 9(1), e84857.
Lebrato, M., Iglesias-Rodriguez, D., Feely, R.A., Greeley, D., Jones, D.O.B., Suarez-Bosche, N., Lampitt, R. S., Cartes, J.E., Green, D.R.H., Alker B., 2010. Global contribution of echinoderms to the marine carbon cycle: CaCO3 budget and benthic compartments. Ecol.
Monogr. 80(3), 441-467.
Lourens, L.J., Hilgen, F.J., Laskar, J., Shackleton, N.J., Wilson, D., 2004. The Neogene Period. In: Gradstein, F.M., Ogg, J.G., Smith, A.G. (Eds.), A Geologic Time Scale 2004. Cambridge University Press, Cambridge, p. 409-440
Lyle, M., 2003. Neogene carbonate burial in the Pacific Ocean. Paleoceanography 18(3), 1059. doi:10.1029/2002PA000777.
Milliman, J.D., 1993. Production and accumulation of calcium carbonate in the ocean: Budget of a nonsteady state. Global Biogeochem. Cy. 7(4), 927-957.
Milliman, J.D., Droxler, A.W., 1996. Neritic and pelagic carbonate sedimentation in the marine environment: ignorance is not bliss. Geol. Rundsch. 85, 496-504.
Milliman, J.D., Troy, P.J., Balch, W.M., Adams, A.K., Li, Y.H., Mackenzie, F.T., 1999. Biologically mediated dissolution of calcium carbonate above the chemical lysocline?. Deep-Sea Res. Pt. I 46(10), 1653-1669.
Misra, S., Froelich, P.N., 2012. Lithium isotope history of Cenozoic seawater: change in silicate weathering and reverse weathering. Science 335, 818-823.
Moore Jr., T.C., Rabinowitz, P.D., Borella, P., Boersma, A., Shackleton, N.J., 1984. Initial Reports Deep Sea Drilling Project, 74. US Government Printing Office, Washington.
Okada, H., 1990. 14. Quaternary and Paleogene calcareous nannofossils, Leg 115. In: Duncan, R.A., Backman, J., Peterson, L.C. (Eds.), Proceedings of the Ocean Drilling Program, Scientific Results. College Station, Texas (Ocean Drilling Program), pp. 129-174.
Pagani, M., Caldeira, K., Berner, R.A., Beerling, D.J., 2009. The role of terrestrial plants in limiting atmospheric CO2 decline over the past 24 million years. Nature 460, 85-88.
Pälike, H., Lyle, M.W., Nishi, H., Raffi, I., Ridgwell, A., Gamage, K., Klaus, A., Acton, G., Anderson, L., Backman, J., Baldauf, J., Beltran, C., Bohaty, S.M., Bown, P., Busch, W., Channell, J.E.T., Chun, C.O.J., Delaney, M., Dewangan, P., Dunkley Jones, T., Edgar,
Hayashi, H., Herrle, J.O., Holbourn, A., Hovan, S., Hyeong, K., Iijima, K., Ito, T., Kamikuri, S.-i., Kimoto, K., Kuroda, J., Leon-Rodriguez, L., Malinverno, A., Moore Jr, T.C., Murphy, B.H., Murphy, D.P., Nakamura, H., Ogane, K., Ohneiser, C., Richter, C., Robinson, R., Rohling, E.J., Romero, O., Sawada, K., Scher, H., Schneider, L., Sluijs, A., Takata, H., Tian, J., Tsujimoto, A., Wade, B.S., Westerhold, T., Wilkens, R., Williams, T., Wilson, P.A., Yamamoto, Y., Yamamoto, S., Yamazaki, T., Zeebe, R.E., 2012. A Cenozoic record of the equatorial Pacific carbonate compensation depth. Nature 488(7413), 609-614.
Pearson, P.N., Palmer, M.R., 2000. Atmospheric carbon dioxide concentrations over the past 60 million years. Nature 406(6797), 695-699.
Peirce, J., Weissel, J. et al., 1989. Proceedings of the Ocean Drilling Program, Initial Reports, 121. College Station, TX.
Perry, C. T., Salter, M.A., Harborne, A.R., Crowley, S.F., Jelks, H.L., Wilson, R.W., 2011. Fish as major carbonate mud producers and missing components of the tropical carbonate factory. P. Natl. Acad. Sci. USA 108(10), 3865–3869.
Pisias, N.G., Mayer, L.A., Mix, A.C., 1995. Paleoceanography of the eastern equatorial Pacific during the Neogene: synthesis of Leg 138 drilling results. In: Pisias, N.G., Mayer, L.A., Janecek, T.R. et al. (Eds.), Proceedings ODP, Scientific Results. College Station, Texas (Ocean Drilling Program), pp. 5-21.
Poulton, A. J., Adey, T.R., Balch, W.M., Holligan, P.M., 2007. Relating coccolithophore calcification rates to phytoplankton community dynamics: Regional differences and implications for carbon export. Deep-Sea Res. Pt. II 54, 538-557.
Poore, H.R., Samworth, R., White, N.J., Jones, S.M., McCave, I.N., 2006. Neogene overflow of Northern Component Water at the Greenland-Scotland Ridge. Geochem., Geophy., Geosy. 7(6), Q06010. doi:10.1029/2005GC001085.
Preiss-Daimler, I., Baumann, K.-H., Henrich, R., 2012. Carbonate budget mass estimates for Neogene discoasters from the Equatorial Atlantic (Ceara Rise: ODP Site 927). J. Micropalaeontol. 31(2), 169-178.
Preto, N., Agnini, C., Rigo, M., Sprovieri, M., Westphal, H., 2013. The calcareous nannofossil Prinsiosphaera achieved rock-forming abundances in the latest Triassic of western Tethys: consequences for the δ13C of bulk carbonate. Biogeosciences 10,
6053-6068.
Raffi, I., Backman, J., Fornaciari, E., Pälike, H., Rio, D., Lourens, L., Hilgen, F., 2006. A review of calcareous nannofossil astrobiochronology encompassing the past 25 million years. Quaternary Sci. Rev. 25, 3113-3137.
Rickaby, R.E.M., Henderiks, J., Young, J.R., 2010. Perturbing phytoplankton: response and isotopic fractionation with changing carbonate chemistry in two coccolithophore species. Clim. Past 6, 771-785.
Ridgwell, A., 2005. A Mid Mesozoic Revolution in the regulation of ocean chemistry. Mar. Geol. 217(3-4), 339-357.
Ridgwell, A. J., Zeebe. R. E., 2005. The role of the global carbonate cycle in the regulation and evolution of the Earth system. Earth Planet. Sc. Lett. 234, 299-315.
Rost, B., Riebesell, U., Burkhardt, S., Sültemeyer, D., 2003. Carbon acquisition of bloom-forming marine phytoplankton. Limnol. Oceanogr. 48(1), 55-67.