HAL Id: hal-00295355
https://hal.archives-ouvertes.fr/hal-00295355
Submitted on 31 Oct 2003
HAL is a multi-disciplinary open access
archive for the deposit and dissemination of
sci-entific research documents, whether they are
pub-lished or not. The documents may come from
teaching and research institutions in France or
abroad, or from public or private research centers.
L’archive ouverte pluridisciplinaire HAL, est
destinée au dépôt et à la diffusion de documents
scientifiques de niveau recherche, publiés ou non,
émanant des établissements d’enseignement et de
recherche français ou étrangers, des laboratoires
publics ou privés.
during the MINOS campaign: comparision of GOME, in
situ aircraft measurements and MATCH-MPIC-data
A. Ladstätter-Weißenmayer, J. Heland, R. Kormann, R. von Kuhlmann, M. G.
Lawrence, J. Meyer-Arnek, A. Richter, F. Wittrock, H. Ziereis, J. P. Burrows
To cite this version:
A. Ladstätter-Weißenmayer, J. Heland, R. Kormann, R. von Kuhlmann, M. G. Lawrence, et al..
Transport and build-up of tropospheric trace gases during the MINOS campaign: comparision of
GOME, in situ aircraft measurements and MATCH-MPIC-data. Atmospheric Chemistry and Physics,
European Geosciences Union, 2003, 3 (5), pp.1887-1902. �hal-00295355�
www.atmos-chem-phys.org/acp/3/1887/
Chemistry
and Physics
Transport and build-up of tropospheric trace gases during the
MINOS campaign: comparision of GOME, in situ aircraft
measurements and MATCH-MPIC-data
A. Ladst¨atter-Weißenmayer1, J. Heland2, R. Kormann3, R. von Kuhlmann3, M. G. Lawrence3, J. Meyer-Arnek1,
A. Richter1, F. Wittrock1, H. Ziereis3, and J. P. Burrows1
1Institute of Environmental Physics, University of Bremen, P.O. Box 330440, D-28334 Bremen, Germany 2Institute of Atmospheric Physic, DLR, Oberpfaffenhofen, D-82234 Wessling, Germany
3Max-Planck-Institute for Chemistry, P.O. Box 3060, D-55020 Mainz, Germany
Received: 4 March 2003 – Published in Atmos. Chem. Phys. Discuss.: 5 June 2003 Revised: 7 October 2003 – Accepted: 13 October 2003 – Published: 31 October 2003
Abstract. The MINOS (Mediterranean INtensive Oxidant
Study) campaign was an international, multi-platform field campaign to measure long-range transport of air-pollution and aerosols from South East Asia and Europe towards the Mediterranean basin during August 2001. High pollution events were observed during this campaign. For the Mediter-ranean region enhanced tropospheric nitrogen dioxide (NO2)
and formaldehyde (HCHO), which are precursors of tro-pospheric ozone (O3), were detected by the satellite based
GOME (Global Ozone Monitoring Experiment) instrument and compared with airborne in situ measurements as well as with the output from the global 3D photochemistry-transport model MATCH-MPIC (Model of Atmospheric Transport and CHemistry – Max Planck Institute for Chemistry). The in-crease of pollution in that region leads to severe air quality degradation with regional and global implications.
1 Introduction
The rapid growth of human population and industrial devel-opment in South-East Asia and Europe is accompanied by an increase of air pollution. The consequence is increasing trace gas production and release into the atmosphere by hu-man activities which are significantly disturbing the compo-sition and chemistry of the global atmosphere and increasing the concentration of atmospheric greenhouse gases that con-trol the climate of our planet (Levine, 1991). Combustion processes lead to emissions of trace gases like carbondiox-ide (CO2), carbon monoxide (CO), nitrogen oxides (NOx)
[NOx=NO+NO2], methane (CH4), nonmethane
hydrocar-Correspondence to: A. Ladst¨atter-Weißenmayer
(lad@iup.physik.uni-bremen.de)
bons (NMHC) and especially formaldehyde (HCHO), which is also produced by photochemical reactions (Ladst¨atter-Weissenmayer et al., 1998). These reactive gases strongly influence the local and downwind concentrations of the ma-jor oxidant ozone (O3).
In this paper, we evaluate measurements of the Mediter-ranean INtensive Oxidant Study (MINOS) 2001 campaign to characterize the atmospheric chemical composition of SE-Asian and European outflow from July and August 2001 over the Mediterranean basin. This time period was selected be-cause northeasterly winds are persistent during this period and convection over the continental source regions is sup-pressed by large-scale subsidence, thus limiting the upward dispersion of pollution. As part of this MINOS campaign the Department of Environmental Physics and Remote Sens-ing (IUP), University of Bremen, Germany, analysed satel-lite based GOME data to compare the results to in-situ air-craft profile measurements of NO2 (performed by the
In-stitute of Atmospheric Physics, DLR (Deutsches Zentrum f¨ur Luft- und Raumfahrt), Oberpfaffenhofen) and of HCHO (provided by the Max Planck Institute for Chemistry, Mainz). While for NO2 a similar study based on on aircraft
pro-file has already been presented by Heland et al. (2002), this is the first time that GOME HCHO measurements are also compared to airborne in-situ measurements. The same data are also compared to output from the MATCH-MPIC-model, operated by the Max Planck Institute for Chemistry, Mainz (Von Kuhlmann, 2001; Von Kuhlmann et al., 2003; Lawrence et al., 1999) as a further validation of this model.
In addition, the GOME NO2 and HCHO measurements
are also used to investigate transport and build-up of tropo-spheric pollution over the Mediterranean basin on a regional scale using a trajectory model.
2 Experimental setup
2.1 GOME measurements
The Global Ozone Monitoring Experiment GOME was launched in April 1995 onboard the European Research Satellite (ERS)-2 into a near-sun-synchronous orbit at a mean altitude of 795 km. The descending mode crosses the equa-tor every 2800 km at 10:30 am local time. GOME is a nadir-scanning double-monochromator measuring the sun-light scattered from Earth’s atmosphere and/or reflected by the surface in the wavelength region of 240 to 790 nm at a moderate spectral resolution of 0.17 to 0.33 nm. Once per day the extraterrestrial solar irradiance is measured and can be used as an absorption free background in the data analy-sis. The spectrum is subdivided into four spectral channels, each recorded quasi-simultaneously by a 1024-pixel reticon photodiode-array. With 14 orbits per day, total ground cov-erage is obtained within 3 days at the equator by a 960 km across-track swath (4.5 s forward scan, 1.5 s back scan, the size of one GOME ground pixel is 40 × 320 km2). GOME measurements are available for the time period from July 1995 to June 2003. The main scientific objective of GOME is to measure the global distribution of O3and several other
trace gases which play an important role in the ozone chem-istry of the Earth’s stratosphere and troposphere, e.g. NO2,
BrO, OClO, SO2, H2O, and HCHO. Details of the
over-all scientific results are reported elsewhere (Burrows et al., 1999, 2000). In addition, a number of studies has been pub-lished focusing on the retrieval of NO2 (Leue et al., 2001;
Richter and Burrows, 2002; Martin et al., 2002) and HCHO (Ladst¨atter-Weissenmayer et al., 1998; Chance et al., 2000; Palmer et al., 2002) from GOME data.
During the summer in the boundary layer (BL) over the Mediterranean region the mixing ratios for NO2 are
usu-ally in a range of 0.2–0.7 ppb (measured by M. Vrekous-sis with a long-path DOAS (Differential Optical Absorp-tion Spectroscopy)-system during the MINOS campaign) near the surface. For HCHO a mixing ratio of 200±70 ppt was measured during the INDOEX-campaign (Wagner et al., 2002) in the marine boundary layer over the Indian Ocean, whereas an average value of 1.6 ppb was observed during the MINOS campaign (Kormann et al., 2003). GOME is able to measure both trace gases with a detection limit of 5·1014molec/cm2 (∼100 ppt, assuming a 2 km thick
atmo-spheric layer at 1000 hPa) for NO2and 2.5·1015molec/cm2
(∼500 ppt, assuming a 2 km atmospheric layer at 1000 hPa) for HCHO.
Since GOME is measuring the sunlight backscattered from the earth surface, the presence of clouds influences the re-sults of the data analysis. For this study only GOME mea-surements under clear sky conditions were used for the com-parisons with in-situ measurements and modeled MATCH-MPIC results (Lawrence et al., 2003). Here we define cloud free as a cloud-cover of less than 10% as determined with
the operational GOME ICFA algorithm (see Figs. 1a and b where white gaps reflect pixels with cloud cover higher than 10% or errors above a threshold value; for NO2of 50% and
for HCHO of 100%).
The number of overflights of GOME over this region dur-ing the MINOS campaign and the restriction to cloud-free scenes are the limiting factor for the number of comparisons. 2.2 Airborne in situ measurements
In-situ measurements of nitrogen monoxide (NO), O3,
HCHO, the photolysis frequency of NO2 (J(NO2)) and
me-teorological parameters were performed with the Falcon re-search aircraft of DLR. NO was measured by means of a well characterized chemiluminescence detector (CLD) with a de-tection limit of about 5 pptV for NO. The nominal accuracy of the measurements during the MINOS campaign was 5% of the measured value (Ziereis et al., 1999). Before every flight a calibration of this instrument was performed using a diluted mixture of 2.97 ppmV NO ±1% in N2(Messer Griesheim)
with purified air.
O3was measured by UV-absorption with a modified TE 49
instrument (Thermo Environmental) calibrated with an O3
41M ozone generator (ANSYCO) which is frequently cali-brated against a GAW (Global Atmosphere Watch) standard device. The accuracy of the ozone measurements is esti-mated to be within 5%.
The photolysis frequency of NO2 was obtained from
the sum of two filter radiometers (Meteo Consult GmbH) (Junkermann et al., 1989; Volz-Thomas, 1996) with 2π view-ing geometry and an overall uncertainty of 17%. One of the radiometers was installed on top of the aircraft, the second on the downward facing side of the aircraft body. The de-tectors were optimized for flight applications (Volz-Thomas, 1996) and have recently been characterized in the laboratory (Hauser, 2002).
HCHO measurements during MINOS were based on the Hantzsch reaction technique (Nash, 1953) and carried out with an Aero Laser (AL4021, Aero Laser GmbH, Garmisch-Partenkirchen, Germany) modified for airborne operation. The detection limit of the instrument was 42 pptv at a time resolution of 180 s (10–90%). The total uncertainty of HCHO for the measurements during the MINOS campaign is estimated to be 30% at a mixing ratio of 300 pptv (Kor-mann et al., 2003). Similar measurement techniques are de-scribed elsewhere in the literature (Kelly and Fortune, 1994; Macdonald et al., 1999).
2.3 MATCH-MPIC-model
The MATCH-MPIC model (Lawrence et al., 1999) has been developed and applied towards the investigation of global tropospheric chemistry. It is an “offline” model which can be driven with gridded time-dependent values from dif-ferent meteorological datasets. Here, the National Center
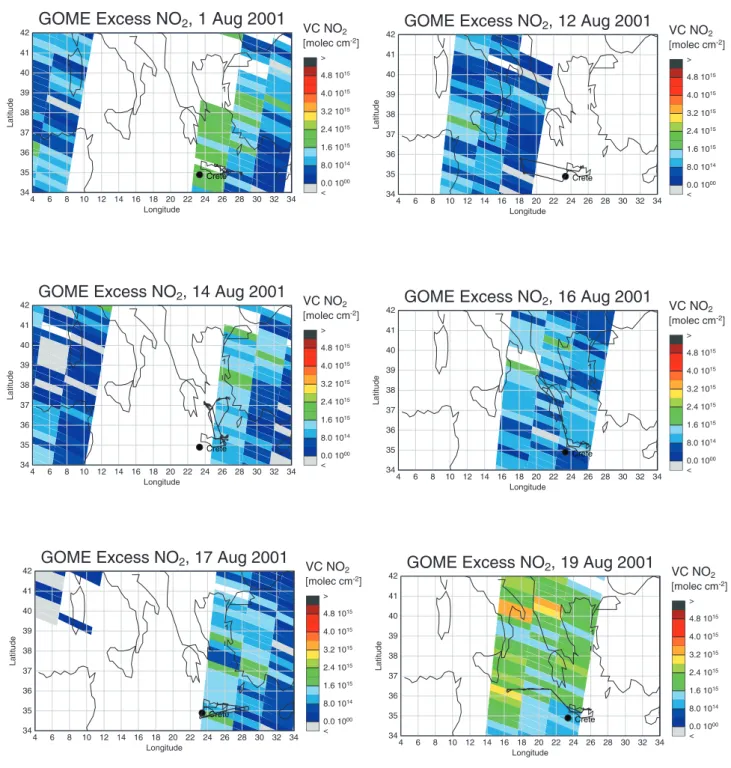
Fig. 1a. Vertical tropospheric columns of NO2derived from GOME measurements and Falcon flight tracks on the days of overflights of
GOME during the MINOS campaign.
for Environmental Prediction (NCEP), GFS (Global Fore-cast/Analysis System), – formerly known as “AVN” – data at a horizontal resolution of about 2.8◦×2.8◦with 42 levels are used for the period of the MINOS campaign (Lawrence et al., 2003). Emissions of 16 species from industrial activi-ties (based on the EDGAR database, Olivier et al. (1996)), biomass burning, the terrestrial biosphere itself and the ocean were taken into account. The chemical scheme of
the model includes CH4-CO-HOx-NOx“background”
chem-istry, as well as representations of isoprene, ethane (C2H6),
propane (C3H8), ethylene (C2H4), propylene (C3H6) and
higher alkanes. A complete description of the model can be found in Lawrence et al. (1999); Von Kuhlmann (2001); Von Kuhlmann et al. (2003).
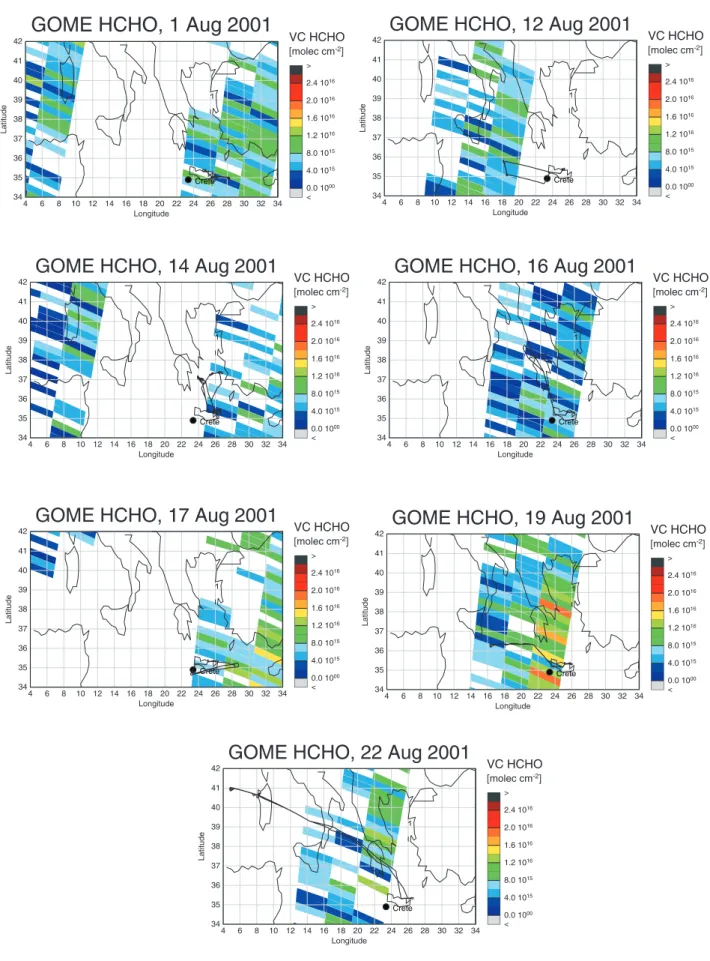
Fig. 1b. Vertical tropospheric columns of HCHO derived from GOME measurements and Falcon flight tracks on the days of overflights of
3 Data analysis
3.1 GOME data analysis
For the comparisons with the airborne in-situ measurements, GOME data, more precisely those pixels along the flight track of the Falcon, were extracted and analysed (see Figs. 1a and b) for the trace gases HCHO and NO2. GOME
spec-tra were analysed using the IUP Bremen Differential Optical Absorption (DOAS) algorithm (Burrows et al., 1999; Richter and Burrows, 2002) to derive slant columns of HCHO and NO2. Slant columns are the total amount of the absorber
integrated along all contributing light paths through the at-mosphere. To convert this quantity into vertical columns which are independent of the viewing geometry, airmass fac-tors (AMFs) were computed with the radiative transfer model GOMETRAN (Rozanov et al., 1997). The AMF are the ra-tio between slant column and vertical column determined for a model atmosphere and depend critically on assumptions made for surface albedo, aerosol loading and the vertical dis-tribution of the absorber of interest. Details on the spectral analysis are given elsewhere (Ladst¨atter-Weissenmayer et al., 1998; Richter and Burrows, 2002) and are not repeated here. As GOME is a nadir viewing instrument, both tropo-spheric and stratotropo-spheric absorptions contribute to the mea-sured signal. While this is not critical for HCHO which has a very small stratospheric column, the stratospheric NO2
col-umn can not be neglected in the analysis. Therefore, the Tro-pospheric Excess Method (TEM) (Fishman et al., 1990; Leue et al., 2001; Richter and Burrows, 2002) was used to derive the tropospheric columns of NO2. This method is based on
the assumption that stratospheric NO2does not vary zonally,
and therefore the total columns measured on the same day at the same latitude over a clean air region can be used as an approximation of the stratospheric column over the region of interest. Here, data from Atlantic region (315–325◦), which at these latitudes can be considered to be relatively clean, were used as the clean atmospheric background. The overall analysis then consists of three steps: (a) determination of the total slant column, (b) subtraction of the stratospheric con-tribution yielding the tropospheric slant column and (c) divi-sion by the airmass factor to obtain the vertical tropospheric column.
The TEM works under the assumption that the variations in the NO2vertical columns detected by GOME can be
at-tributed to variations in tropospheric NO2columns. There
are general limitations using this method which introduce some uncertainty into the results. Also, a number of assump-tions has to be made for the calculation of the airmass factors, and they also contribute to the overall error of the GOME measurements. A detailed discussion of the error budget is given in Richter and Burrows (2002). The main error sources are the inhomogeneities in the stratospheric NO2field,
uncer-tainties in cloud cover, the assumed vertical profile of NO2,
the surface albedo and the aerosol loading which are required
0 2 4 6 8 10 12 14 16 0,0 0,5 1,0 1,5 2,0 2,5 Change in NO2 and HCHO SC [molec/cm2]/molec/cm3/cm
Height
[km]
Sensitivity to HCHO at 346.5 nm, SZA 25° Aug. 2001 Sensitivity to NO2at 437.5 nm, SZA 25° Aug. 2001
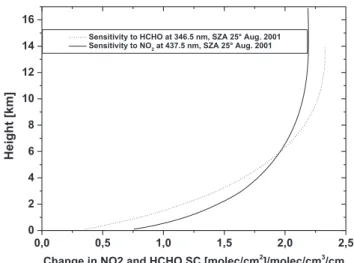
Fig. 2. Weighting function for NO2at 437.5 nm, 25◦SZA. Shown is the sensitivity of the measured slant column to a change in NO2
and HCHO concentration at a given height. For an optically thin atmosphere, the figure is identical to a vertical AMF distribution (block airmass factor). The weighting function has no units as it gives the change in slant column (units molec/cm2) for a change in concentration (units molec/cm3) in a layer of 1 cm thickness.
in calculating the AMF. The overall error of the analysis is estimated to be on the order of 1.5×10¹⁵molec/cm2(see Ta-ble 1). For HCHO, the stratosphere is no concern, but fitting errors are larger and in contrast to NO2 contribute
signifi-cantly to the overall error.
One major concern in the analysis of tropospheric columns derived from spaceborne UV/visible measurements is the question of how sensitive the measurement is to contributions from different altitudes. This can be evaluated using the well known concept of weighting functions, which are a measure of the change in measured quantity (here the slant columns) for a change of the target quantity (here the concentration of NO2or HCHO) as a function of altitude. It should be noted,
that for an optically thin atmosphere, the weighting functions are identical to block airmass factors which give the AMF for thin layers of absorbers at different altitudes (see also the discussion of Eskes and Boersma (2003)). Weighting func-tions were calculated for both NO2 and HCHO for a
typi-cal scenario during the MINOS campaign (SZA=25◦) using the radiative transport model GOMETRAN. The results are shown in Fig. 2. The two curves differ as HCHO is retrieved at shorter wavelengths and therefore Rayleigh scattering is more important. As can be seen from the plot, the sensitivity of the satellite measurements decreases towards the surface, in particular for HCHO. This has to be accounted for in the analysis by use of an adequate vertical profile in the AMF calculation, and potentially can introduce large errors in the satellite data.
In this study, for the comparison with in-situ measure-ments, various AMF based on different vertical profiles
Table 1. Contribution of possible error sources in the GOME analysis to the uncertainty of the retrieved tropospheric columns of NO2and
HCHO
Error source Uncertainty (NO2) Uncertainty (HCHO)
Fitting error 5% 50%
Stratospheric subtraction 0.5×10¹⁵molec/cm2 –
NO2– HCHO vertical profile assumption (AMF) 50% 50%
Aerosol assumption (AMF) 35% 35%
Surface albedo assumption (AMF) max. 50% max. 50%
Cloud effects 30% 30%
Overall error of the analysis 1.5×10¹⁵molec/cm2 –
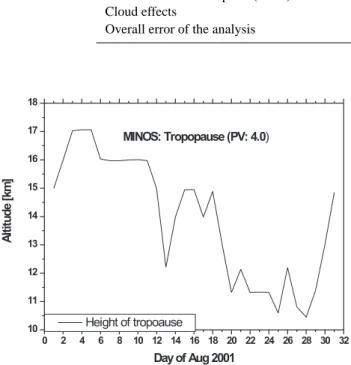
0 2 4 6 8 10 12 14 16 18 20 22 24 26 28 30 32 10 11 12 13 14 15 16 17 18 Al titu de [k m ] Dayof Aug 2001 Height of tropoause MINOS: Tropopause (PV: 4.0)
Fig. 3. Tropopause height (defined to be at the altitude of 4
PV-Units) over Crete during the MINOS campaign in August 2001.
(the individual and the averaged profiles) were used for the GOME analyses to determine the tropospheric vertical columns. This is discussed in detail in Sect. 4.1.
For the comparison between GOME, in-situ measure-ments, and model data, the latter have to be converted to vertical columns, usually by integrating all values from the surface up to the tropopause. Unfortunately, the Mediter-ranean region exhibits a large variability in tropopause height (Shimizu and Tsuda, 2000) which needs to be taken into account. In the vertical profiles of O3 measured by the
in-situ instruments up to a height of 13 km, an increase of the concentration was observed at 12 km height most likely originating from an influence of stratospheric air masses at this altitude e.g. on 22 August 2001. In order to deter-mine tropopause heights above the highest flight level, the height of the tropopause was defined to be at the altitude of 4 PV-Units for the MINOS campaign (see Fig. 3). Using the ECMWF-operational analysis data at a 1.5×1.5◦ reso-lution based on 60 layers of the analysis-model, tropopause heights were determined based on the above definition and
used throughout the analysis. Fortunately, variations in tropopause height in this altitude range have almost no influ-ence on the tropospheric vertical columns of NO2and HCHO
which is in contrast to the situation for O3. The reason
for this behaviour is the vertical profile of these trace gases which usually shows small values around the tropopause re-gion.
3.2 In-situ airborne data analysis 3.2.1 NO2
The profiles of the airborne measurements like NO, O3,
HCHO and in addition J(NO2) were analysed in
combina-tion with meteorological data. To obtain the NO2
concen-trations, we assumed a simple photochemical equilibrium between NO, NO2 O3 and J(NO2) (e.g. Atkinson (2000)),
where the temperature-dependent rate constant k(NO + O3)
is calculated from the data given in Sander et al. (2000). For the purpose of data reduction, the airborne NO2and O3data
(1 Hz values) were averaged in 100 m altitude bins for each profile as well as for an averaged NO2-profile. The error bars
were evaluated from the spread of the experimental data in the bins (1σ ) and the uncertainties for the NO2and O3data,
respectively. One of the uncertainties for NO2is the use of
simple photochemical equilibrium between NO, NO2O3and
J(NO2) and the assumption that O3dominates the conversion
of NO to NO2 (Calvert and Stockwell, 1983). In polluted
regions, reactions involving peroxy radicals may also con-stitute potentially important conversion channels of NO to NO2 (Crawford et al., 1996). In addition, the
temperature-dependent rate constant k(NO + O3), which is a function of
non-linear pressure and temperature, can be considered as an uncertainty in the calculation of NO2. In case of
miss-ing data in intermediate altitude bins, a mean mixmiss-ing ratio was defined within these bins and conservative assumptions about the uncertainties were made.
Since the in-situ data were collected up to altitudes of about 10–13 km, the analysis of tropospheric vertical columns of NO2can be carried out up to the height of 12 km
height of the tropopause (which according to ECMWF data was in the range of 12.0 to 17.0 km altitude during the MI-NOS campaign; see Fig. 3) was above the top flight altitude on many days, and therefore data had to be extrapolated. A linear extrapolation of the NO2mixing ratios was used
start-ing from the value at the highest aircraft altitude and endstart-ing at the tropopause, with the highest value of NO2measured in
the free troposphere. The error bars for the extrapolated NO2
mixing ratios were set to be ±100%.
In order to obtain tropospheric columns of NO2, the
num-ber densities of this trace gas in the defined altitude bins were summed up and multiplied with the thickness of the bins, (i.e. 100 m) and finally converted to molec/cm3, taking into account the nonlinearity of pressure and temperature. The column uncertainties were calculated using the differences of the minimum or maximum values of the columns – as derived from the error bars – and the mean columns. The overall uncertainty of the nitrogen dioxide mixing ratios de-pends on the experimental uncertainties of the other gases, J(NO2), the reaction constant k, and on the unknown amount
of NO2produced by molecules other than O3(e.g. RO2), and
is estimated to be ∼25%. 3.2.2 HCHO
A detailed description of the HCHO data sampling procedure during the MINOS campaign and a discussion of the data quality is given in Kormann et al. (2003). Data in the lower and middle troposphere (heights of 600 m up to 13 km) were obtained during some profile measurements. These profile measurements contained rapid ascents and descents of the Falcon as well as flights at a constant altitude. For the com-parison with satellite based data and the model, calculated profiles from individual flights with a height resolution of 1 km as well as an averaged profile for the campaign were used. Before averaging the data of the HCHO-profiles in bins of 1 km the mixing ratios of HCHO were calculated in molec/cm3accounting for the non-linearity of pressure and temperature.
3.3 MATCH-MPIC-model-data analysis
The output of the MATCH-MPIC-model is based on data which are interpolated in space and time along the Falcon track (Lawrence et al., 2003). This was done rather than profiles only over Crete, so that the corresponding meteo-rological conditions for given temporal and spatial domains were used. The profiles of NOx, NO, O3, HCHO and in
ad-dition J(NO2) based on MATCH-MPIC-model-output were
analysed. To obtain the NO2concentrations and eventually
the tropospheric vertical columns, the same photochemical equilibrium as described above, as well as the NO2
calcu-lated from the difference between NOxand NO were used,
whereas the HCHO mixing ratios could directly be retrieved from the MATCH-MPIC output. In order to reduce the size
0 2 4 6 8 10 12 14 16 18 0,0 2,0x10⁹ 4,0x10⁹ 6,0x10⁹ 8,0x10⁹ NO2-Profile-Falcon Minos NO2[molec/cm3] Al titu de [k m ] NO201.08.01 NO212.08.01 NO214.08.01 NO216.08.01 NO217.08.01 NO219.08.01
Averaged NO2 Profile
Fig. 4. Vertical profiles of NO2and the calculated averaged
pro-file based on in situ-measurements performed from the DLR-Falcon during the MINOS campaign in July and August 2001.
of the dataset for NO2, the values were averaged in 100 m
and the output of HCHO in 1 km altitude bins, to be consis-tent with the in-situ measurements.
4 Results and discussion
As described above, the objectives of this study were to cal-culate the tropospheric amount of the satellite based GOME measurements for NO2and HCHO and to compare these
re-sults with in-situ aircraft measurements as well as with the output of MATCH-MPIC during the MINOS campaign. The second aim was to interpret these data with the results of the regional GOME data with respect to transport and formation of tropospheric constituents during this campaign.
4.1 Comparison of GOME, in-situ aircraft measurements and MATCH-MPIC-data over the Mediterranean re-gion
Figure 4 shows the measured values of NO2-concentrations
(molec/cm3) and the calculated averaged profile including the extrapolation of these data up to a height of 18 km with an error of ±100%. For HCHO no extrapolation for the mea-sured and the calculated mean value was carried out and the results up to the maximum flight altitude of about 13 km are shown (see Fig. 5).
Due to the limited temporal and spatial overlap of GOME and aircraft data (e. g. on the 22nd of August 2001 when HCHO data are available but no NO2 measurements were
performed), only the data of 6 days for NO2(one flight on the
1st, 12th, 16th, 17th and two flights per day on the 14th and 19th of August 2001) and 7 days (one flight on the 1st, 12th, 16th, 17th, 19th and two flights per day on the 14th and 22nd
0 2 4 6 8 10 12 14 0,0 5,0x10⁹ 1,0x10¹⁰ 1,5x10¹⁰ 2,0x10¹⁰ 2,5x10¹⁰ 3,0x10¹⁰ 3,5x10¹⁰ HCHO-Profile-Falcon Minos HCHO[molec/cm3] Al titu de [k m ] HCHO 01.08.01HCHO 16.08.01 HCHO 17.08.01 HCHO 19.08.01 HCHO 22.08.01a HCHO 22.08.01b Averaged HCHO Profile
Fig. 5. Vertical profiles of HCHO and the calculated averaged
pro-file based on in situ-measurements performed from the DLR-Falcon during the MINOS campaign in July and August 2001.
Table 2. Impact of using individual or averaged profiles for the
calculation of the AMF on the tropospheric columns of NO2and
HCHO.
Mean value of NO2 Mean value of HCHO
[molec/cm2] [molec/cm2]
Individual profiles 1.2×10¹⁵ 6.3×10¹⁵
Averaged profile 8.7×10¹⁴ 6.4×10¹⁵
for the campaign
of August 2001) for HCHO during the MINOS campaign could be analysed and compared (see Figs. 6 and 7).
For the GOME data, two different AMFs were calculated to determine the vertical columns from the slant columns of the GOME-data: (a) one set using all individual in-situ mea-sured profiles for NO2and HCHO and (b) another set using
the averaged profile for the campaign for both trace gases. The results for NO2 are shown in Fig. 6. The two
dif-ferent sets of AMFs result in differences of up to 25% (2.6×10¹⁴molec/cm2) in the tropospheric vertical column of NO2, demonstrating the impact of profile variability on
the retrieval of the satellite data. While this uncertainty can not be neglected, it still is smaller than the overall uncertainties of the GOME retrievals of tropospheric NO2
(4.5×10¹⁴molec/cm2) (see Table 2).
A similar comparison using different AMFs as described for NO2was also carried out for the retrieval of the
tropo-spheric vertical columns of HCHO (see Fig. 7). However, in contrast to NO2, the impact of HCHO profile changes during
the campaign was small (difference of 1.3×10¹³molec/cm2;
∼0.5%) (see Table 2).
For the intercomparison of GOME and in-situ-measurements as well as MATCH-MPIC-model outputs,
NO2 values averaged over 100 m bins were compared.
Within the combined uncertainties, the GOME and in-situ measurements agree with each other and with the calculated model results during the whole campaign period. Taking into account the error bars of both, the aircraft and the satellite based data, the two instruments also agree within their accuracy limits in most cases (see Fig. 6). This means that the discrepancy between GOME and the in-situ-data is in the range of the standard deviation of the in-situ-measurements and the model.
When the mean campaign values of NO2 from GOME
(using the individual profiles) and in-situ measurements are compared, the difference is 3.6×10¹⁴molec/cm2 when assuming a tropopause height of 17 km and 4.6×10¹⁴molec/cm2for a tropopause height of 12 km.
The comparison between GOME and MATCH-MPIC shows a difference of 2.7×10¹⁴ molec/cm2 for the simple photochemical equilibrium between NO, NO2O3and JNO2.
When using the NO2 derived from the difference between
NOx and NO for a tropopause height of 12 km a deviation
of 1.9×10¹⁴molec/cm2is obtained. The main difference be-tween the two approaches is, that the additional conversion of NO to NO2by peroxy radicals was taken into account in the
MATCH-MPIC-simulation to calculate the output of NOx.
Thus, accounting for the influence of hydrocarbons in pho-tochemical reactions to produce NO2reduces the difference
between GOME and the output of model data to ∼30%. The average NO2-profile (see Fig. 4), taking into account
the vertical distribution between 0–17 km altitude reflects that the main part of the tropospheric amount (7.1×10¹⁴ molec/cm2) is observed in the BL. The partition of the ver-tical NO2-profile in the different atmospheric layers 0–1 km,
1–2 km, 2–3 km, 3–4 km reflects that 68% of tropospheric NO2 were observed in the lowest atmospheric layer, 11.5%
in an altitude between 1–2 km, 5.6% between 2–3 km and 3.3% at a height of 3–4 km of the total column. Thus the rest of 11.6% of the tropospheric vertical column amount was de-tected above 4 km. The good agreement between GOME and in-situ measurements for this situation demonstrates, that the satellite retrieval is able to provide accurate information even for situations where most of the NO2is situated in the
low-est atmospheric layers if this is accounted for in the AMF calculations.
In Fig. 7 the comparison of measured and modeled data is shown for the trace gas HCHO. For this case study the in-situ as well as the MATCH-MPIC-data were averaged in 1 km bins. For the first time a comparison between satellite based GOME and in-situ airborne measurements was car-ried out for the trace gas HCHO. During the MINOS cam-paign the results of both measurement systems agree well for the tropospheric vertical columns of HCHO. The differ-ence between GOME and in-situ measurements is between 1.2×10¹⁵molec/cm2 and 5.6×10¹⁵molec/cm2 (<25%) for all comparisons when using the individual HCHO-profiles for the AMF calculation. The discrepancy between the
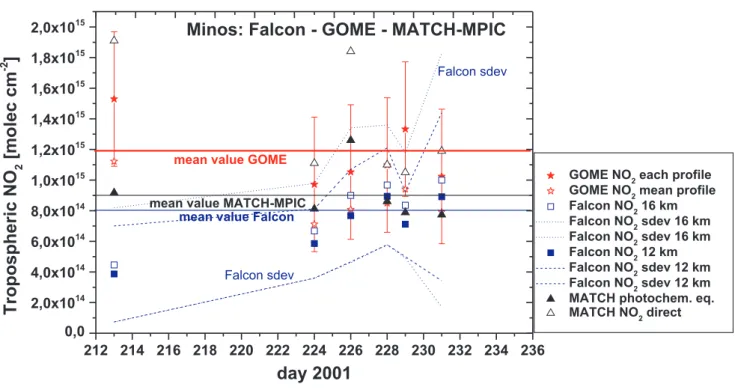
212 214 216 218 220 222 224 226 228 230 232 234 236 0,0 2,0x10¹⁴ 4,0x10¹⁴ 6,0x10¹⁴ 8,0x10¹⁴ 1,0x10¹⁵ 1,2x10¹⁵ 1,4x10¹⁵ 1,6x10¹⁵ 1,8x10¹⁵ 2,0x10¹⁵ Falcon sdev Falcon sdev
mean value MATCH-MPIC
mean value Falcon mean value GOME
Minos: Falcon - GOME - MATCH-MPIC
Tr
opospher
ic
N
O
2[molec
cm
-2]
day 2001
GOME NO2each profile
GOME NO2mean profile
Falcon NO216 km Falcon NO2sdev 16 km Falcon NO2sdev 16 km Falcon NO212 km Falcon NO2sdev 12 km Falcon NO2sdev 12 km
MATCH photochem. eq. MATCH NO2direct
Fig. 6. Comparison of measurements of tropospheric vertical column densities of NO2 derived from in-situ-measurements and GOME
data acquired during the MINOS campaign in July and August 2001. In addition MATCH-MPIC-model data determined using the same bin-averaging as for the in-situ measurements are also shown. See text for details.
212 214 216 218 220 222 224 226 228 230 232 234 236 2,0x10¹⁵ 4,0x10¹⁵ 6,0x10¹⁵ 8,0x10¹⁵ 1,0x10¹⁶ 1,2x10¹⁶ 1,4x10¹⁶ Falcon sdev
mean value MATCH-MPIC
Falcon sdev
mean value GOMEmean value Falcon
Minos: Falcon - GOME - MATCH-MPIC
Tr
opos
phe
ric
HCHO
[m
ol
ec
/c
m
²]
day 2001
GOME HCHO (each profile) GOME HCHO (mean profile) Falcon HCHO
Falcon HCHO sdev Falcon HCHO sdev MATCH-MPIC HCHO
Fig. 7. Comparison of measurements of tropospheric vertical column densities of HCHO from in-situ-measurements (for HCHO 1 km bins)
and GOME data acquired during the MINOS campaign in July and August 2001. In addition MATCH-MPIC-model data determined using the same bin-averaging as for the in-situ measurements are also shown. See text for details.
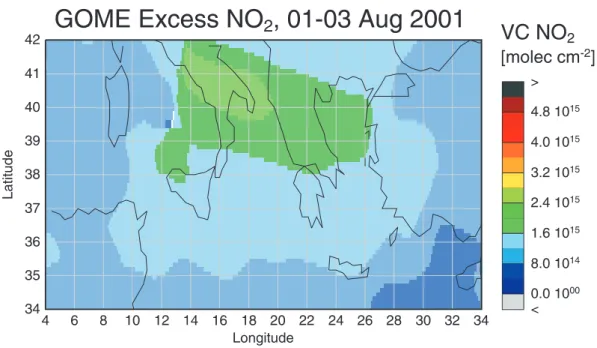
Fig. 8a. Averaged GOME measurements of tropospheric NO2amounts in the time period of 1 to 3 August 2001 analysed for the
Mediter-ranean region during the MINOS campaign.
Fig. 8b. Averaged GOME measurements of tropospheric HCHO amounts in the time period of 1 to 3 August 2001 analysed for the
Mediter-ranean region during the MINOS campaign.
output of the MATCH-MPIC-model and the in-situ measure-ments is ∼30%, and the comparison between GOME and the results of the MATCH-MPIC-data shows a mean devi-ation of ∼17%. In most cases the output of the MATCH-MPIC-model shows lower values for the tropospheric verti-cal columns of HCHO compared to the measured data (Ko-rmann et al., 2003). The reason for this discrepancy can be
an underestimation of the emission of NMHCs (non methane hydro carbons) or the fact that reactions of terpenes are not explicitly included in the scheme, which implies that the pre-cursors of HCHO in photochemical reactions are underesti-mated in the MATCH-MPIC-model. The emission of addi-tional CO and acetone, which is used to compensate for the lack of terpene in the MATCH-MPIC-model in this case does
Table 3. Calculation of the t-distribution with a degree of freedom of 10 for the trace gases NO2and a degree of freedom of 8 for HCHO
T (with k = 10 for NO2and k = 8 for HCHO) Significance level
NO2 GOME – in-situ 3.23 >0.5% NO2 GOME – MATCH-MPIC 4.05 >0.5% HCHO GOME – in-situ 0.75 <0.1% HCHO GOME – MATCH-MPIC 0.65 <0.1%
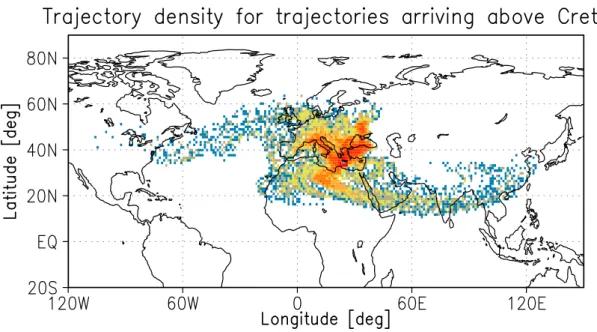
Fig. 9. Trajectory density for trajectories arriving at Crete between 1 and 3 August 2001. The trajectory density is derived by projecting all
trajectories overpassing a certain location at any given height to the ground. Trajectories on all height levels are weighted equally. Therefore, this figure reveals no height information. The trajectory density is given in an arbitrary colour scale. As can be seen, air masses arriving at Crete overpass mainly southern central Europe, south eastern Europe and northern Africa.
not lead to HCHO columns as large as those observed. The same applies to some higher industrial hydrocarbons: e.g. aromatics and alkenes >C3(von Kuhlmann, private
commu-nication).
The HCHO profiles derived from in situ measurements show that typically about 60% of the total tropospheric ver-tical column, or 5.3×10¹⁵molec/cm2, are observed in the lower troposphere (0–4 km). 28.9% were detected in the lowest atmospheric layer (0–1 km), 17.1% at a height of 1– 2 km, 11.5% between 2 and 3 km and 7.5% at 3–4 km alti-tude. The calculated mean GOME HCHO column (6.4×10¹⁵ molec/cm2) is about 20% lower than the averaged value of in-situ data during the MINOS campaign. Still the agreement between both measurement systems is good and demon-strates the ability of GOME to measure HCHO under these conditions.
In order to compare the results of the two measuring systems (GOME and in-situ) more quantitatively, the t-distribution was used to asses the probability of measuring the observed values at the given standard deviation, consid-ering that the physical quantity (tropospheric column of NO2
or HCHO) is the same. Using the t-distribution, significance levels for the appropriate degrees of freedom can be deter-mined (Sachs, 2000) (see Table 3). On the condition that both measurement systems (GOME – in-situ – measurements) are observing the same air masses, the significance level has a value of >0.5% for the trace gas NO2, but <0.1% for HCHO.
This implies that the results of the two measuring systems are consistent for NO2, but that they are less significant for
Table 4. Classification of weather phenomena based on the Total Totals Index
Total Totals Index Weather phenomenon
44–45 Isolated moderate thunderstorms
46–47 Scattered moderate/few heavy thunderstorms
48–49 Scattered moderate/few heavy/isolated severe thunderstorms
50–51 Scattered heavy/few severe thunderstorms and isolated tornadoes
52–55 Scattered to numerous heavy/few to scattered severe thunderstorms/few tornadoes
>55 Numerous heavy/scattered severe thunderstorms and scattered tornadoes
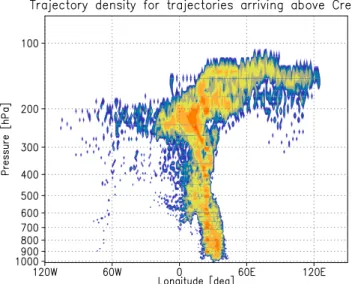
Fig. 10. Longitude-pressure projection of the trajectory density
of all trajectories arriving over Crete from 1 to 3 August 2001. This projection reveals that trajectories originating above south-east-Asia are hardly influenced by anthropogenic pollution. For this graph an arbitrary colour scale is used.
4.2 Transport and build-up of tropospheric trace gases dur-ing the MINOS campaign
The measurements using the GOME instrument reveal en-hanced tropospheric columns of NO2 and HCHO (see
Figs. 8a and b) during the MINOS campaign in the Eastern Mediterranean region. For the episode from 1 to 3 August 2001, this study shows an increase of the amount of NO2to
up to 2.6·1015molec/cm2 and of up to 1.1·1016 molec/cm2 for the HCHO over this region.
From this we conclude that polluted air masses were present that were either transported towards this region or emitted locally. In order to answer this question, backtrajec-tories were calculated.
A very detailed analysis of the meteorology and the ori-gin of airmasses arriving in the Mediteranian region is per-formed by (Lelieveld et al., 2002) and (Traub et al., 2003).
In contrast to the analysis performed by Traub our trajectory analysis was focussed explicitly on the 1st to 3rd of August when GOME measurements over the Eastern Mediteranian took place.
For our analysis backtrajectories are started over Crete at different heights (at 900, 800, 700, 600, 500, 400, 300, and 200 hPa) and travel backwards in time for 5 days. Every 6 h (at 00:00, 06:00, 12:00, and 18:00 UT) from 1 to 3 Au-gust a new set of backtrajectories was released from the same starting point over Crete. One set contains trajectories be-ing released at 900 to 200 hPa on a 100 hPa altitude grid. Altogether 800 trajectories were computed using T raj.x, a trajectory model developed at IUP-Bremen (Meyer-Arnek, 2002). For this study, the meteorological data from the ECMWF analysis model were used which are available on 60 height levels every 6 h (at 00:00, 06:00, 12:00, and 18:00 UT) and a spatial resolution of T511. Although the meteorologi-cal data have a high spatial and a very high vertimeteorologi-cal resolution within the planetary boundary layer, no trajectories arriving above Crete below 900 hPa were considered. The reason is that turbulence on spatial and temporal scales smaller than the resolution of the meteorological data dominate the trans-port within the planetary boundary layer.
Figure 9 shows the trajectory density of all trajectories ar-riving over Crete. The trajectory density is derived by pro-jecting all trajectories onto a latitude-longitude grid indepen-dent of their current height. Every occurrence of a trajectory within the boundaries of each gridpoint is counted. The fig-ure shows that airmasses arriving at Crete overpass mainly southern central Europe, south eastern Europe and northern Africa. However, the trajectory density in this projection re-veals no height information. Figure 11 shows where the tra-jectories on their way to Crete were at a given date (given in day of year; DoY). The day of year 208 refers to 27 July and DoY 213 refers to 1 August 2001.
In order to determine if anthropogenic pollution could have been transported to Crete, contacts of the trajectories with the planetary boundary layer were evaluated. It gives evidence that air masses being probed over Crete had ground contact mainly in the Black Sea region, and potentially could have brought pollution from this area. The longitude-pressure-projection of the trajectory density suggests that air
Fig. 11. Averaged date of the trajectories’ occurrence at a distinct location (given as day of the year (DoY)). DoY 208 refers to 27 July 2001,
DoY 213 refers to 1 August 2001 and DoY 215 refers to 3 August 2001. Trajectories started around DoY 208 and 209 above south east Asia, northern Atlantic, north western Europe and western Africa in order to arrive above Crete from 1 to 3 August 2001. All times within each column are averaged to get one value per grid cell. Values close the arrival point should not be taken into account.
masses originating above south east Asia are not influenced by anthropogenic pollution (see Fig. 10). However, strong uplifting of air masses from the boundary layer into the free troposphere due to convection can not be excluded in such a trajectory calculation. Convection often takes place on hori-zontal scales of less than 10 km and on time scales of 10 to 20 min. This means that convection has to be regarded as a parameterized subgrid process by a global model (like the ECMWF analysis model) (Tiedke, 1989). In order to find out whether air masses have been uplifted from the bound-ary layer into the major trajectory paths by convection, the Total Totals Index (see Table 4) was calculated for every 6 h in the period from 27 July to 3 August. The Total Totals In-dex is a simple inIn-dex derived from the temperature lapse rate between 850 and 500 hPa and from the moisture content at 850 hPa (Tdew(850)).
T T I = Tdew(850) − T (500) + (T (850) − T (500)) (1)
The likelihood of thunderstorms increases with an increas-ing Total Totals Index. The risk of severe weather due to atmospheric instability in the US is empirically defined as follows: As a rule a thumb a Total Totals Index of more than 44 implies convection. Since the index stayed below 44 over south east Asia around 27 July 2001 it indicates that no strong convection was taking place above this area (see Fig. 12).
In summary, the enhanced trajectory analysis reveals no indication for Asian plumes reaching Crete during 1 to 3 Au-gust 2001. On the other hand it is likely that boundary layer air was uplifted during the overpass of the trajectories above Europe since the Total Totals Index shows convection above Great Britain and Central Europe on 27 July and the Black Sea Region on 31 July 2001 (see Fig. 12).
5 Summary
In this study, GOME satellite measurements of NO2 and
HCHO are compared with in-situ measurements and model results for a number of days during the MINOS campaign in August 2001. Good agreement was found between the GOME and in-situ measurements for both absorbers, demon-strating the ability of GOME measurements to derive accu-rate NO2and HCHO columns under these conditions when
columns were close to the detection limit of GOME. This constitutes the first however limited validation of a GOME HCHO product.
The impact of the vertical distribution of the trace species on the GOME data retrieval has been analysed using weight-ing functions or block airmass factors. Although the sensi-tivity of the satellite instruments towards absorptions in the BL is smaller than for absorptions in the free troposphere, in particular for HCHO, using appropriate vertical profiles in
Fig. 12. Total Totals Index for 27th and 31st of July 2001. On 27th of July some thunderstorm activity above Europe but hardly any activity
above south east Asia is recognizable. On 31st of July thunderstorm activity above the Black Sea region and in the north eastern region of the Mediterranean Sea takes place. This may cause uplifting of anthropogenically polluted air from the boundary layer into the free troposphere.
the airmass factor calculation can account for this effect. The impact of variations in vertical profile as observed during the campaign by the in-situ measurements was also studied and found to be non-negligible for NO2(up to 30%) but small for
HCHO.
Data from the MATCH-MPIC model were also com-pared to in-situ and GOME measurements, and showed good agreement with the measurements. For NO2, two different
methods were used, one relying on simple photostationary state assumptions and the other on deriving the difference
between NOxand NO. The latter method yielded much
bet-ter agreement between model and measurements, highlight-ing the importance of other (ROx) reactions in NO2
forma-tion. For HCHO, the model consistently underestimated the tropospheric columns, probably as a result of neglecting ter-pene chemistry.
The results of both measurement systems were found to agree within their accuracy limits even though the tropo-spheric vertical columns of these trace gases were often near the detection limit of GOME.
A case study of transport processes in combination with analyses of back-trajectories show that most of the polluted air masses came from the European continent during the time period of 1 to 3 August 2001. Air masses from SE Asia were probably not influenced by pollution at that time, but some uplifting of airmasses from the BL took place in Europe.
Acknowledgements. Parts of this work were funded by the
Univer-sity of Bremen, Germany, the DLR/DARA, the European Com-munity, and the European Space Agency (ESA). We especially thank the organizers of the MINOS campaign J. Lelieveld, Max-Planck-Institute for Chemistry, Atmospheric Chemistry Depart-ment, Mainz, Germany and N. Mihalopoulos, Crete University, En-vironmental Chemical Processes Laboratory, Department of Chem-istry, Greece and the helpful assistance of M. de Reus. Meteorolog-ical analysis data were kindly provided by the European Centre for Medium Range Weather Forecast (ECMWF); GOME radiances and irradiances were provided by ESA through DLR/DFD in Oberpfaf-fenhofen.
References
Atkinson, R.: Atmospheric chemistry of VOCs and NOx, Atmos.
Environ., 34, 2063–2101, 2000.
Burrows, J. P., Weber, M., Buchwitz, M., Rozanov, V. V., Ladst¨atter-Weissenmayer, A., Richter, A., de Beek, R., Hoogen, R., Bramstedt, K., Eichmann, K.-U., Eisinger, M., und Perner, D.: The Global Ozone Monitoring Experiment (GOME): Mis-sion Concept and First Scientific Results, J. Atm. Sciences, 56, 151–175, 1999.
Burrows, J. P., Richter, A., Weber, M., Eichmann, K.-U., Bramst-edt, K., Ladst¨atter-Weißenmayer, A., Wittrock, F., Eisinger, M., and Hild, L.: Satellite observations of tropospheric and strato-spheric gases, in: Chemistry and Radiation Changes in the Ozone Layer, edited by Zerefos, C., 301–329, Kluwer Academic Pub-lisher, 2000.
Calvert, J. G. and Stockwell, W. R.: Deviations from the O3 -NO-NO2photostationary state in tropospheric chemistry, Can.
J. Chem., 61, 983–992, 1983.
Chance, K., Palmer, P., Spurr, R. J. D., Martin, R. V., Kurosu, T. P., and Jacob, D. J.: Satellite observations of formaldehyde over North America from GOME, Geophys. Res. Lett., 27, 3461– 3464, 2000.
Crawford, J., Davis, D., Chen, G., Bradshaw, J., Sandholm, S., Gre-gory, G., Sachse, G., Anderson, B., Collins, J., Blake, D., Singh, H., Heikes, B., Talbot, R., and Rodriguez, J.: Photostationary state analysis of the NO2-NO system based on airborne
obser-vations from the western and central North Pacific, J. Geophys. Res., 101, 2053–2072, 1996.
Eskes, H. J. and Boersma, K. F.: Averaging kernels for DOAS total-column satellite retrievals, Atmos. Chem. Phys., 3, 1285–1291, 2003
Fishman, J., Watson, C. E., Larsen, J. C., and Logan, J. A.: The distribution of tropospheric ozone determined from satellite data, J. Geophys. Res., 95, 3599–3617, 1990.
Hauser, C.: Charakterisierung eines Messsystems zur Bestimmung der NO2-Photolysefrequenz in der Troposph¨are – Labormes-sungen und FlugzeugmesLabormes-sungen, Diplomarbeit, Fachhochschule M¨unchen, DLR, Oberpfaffenhofen, 2002.
Heland, J., Schlager, H., Richter, A., and Burrows, J.: First com-parison of tropospheric NO2 column densities retrieved from
GOME measurements and in situ aircraft profile measurements, Geophys. Res. Lett., 29, 2, 44-1–44-4, 2002.
Junkermann, W., Platt, U., and Volz-Thomas, A.: A Photoelec-tric Detector for the Measurement of Photolysis Frequencies of Ozone and Other Atmospheric Molecules, J. Atmos. Chem., 8, 203–227, 1989.
Kelly, T. J. and Fortune, C. R.: Continuous monitoring of gaseous formaldehyde using an improved fluorescence approach, Int. J. Env. Anal. Chem., 54, 249–263, 1994.
Kormann, R., Fischer, H., de Reus, M., Lawrence, M. G., Br¨uhl, Ch., von Kuhlmann, R., Holzinger, R., Williams, J., Lelieveld, J., Warneke, C., de Gouw, J., Heland, J., Ziereis, H., and Schlager, H.: Formaldehyde over the Eastern Mediterranean during MI-NOS: Comparison of Airborne In-situ Measurements With 3-D-Model Results, Atmos. Chem. Phys., 3, 851–861, 2003 Ladst¨atter-Weissenmayer, A., Burrows, J. P., and Perner, D.:
Biomass burning over Indonesia as observed by GOME, Earth Obs. Quart. 58, 28–29, 1998.
Lawrence, M. G. , Crutzen, P. J., Rasch, P. J., Eaton, B. E., and Mahowald, N. M.: A model for studies of tropospheric photo-chemistry: Description, global distributions and evaluation, J. Geophys. Res., 104, 26 245–26 277, 1999.
Lawrence, M. G., Rasch, P. J., von Kuhlmann, R., Williams, J., Fis-cher, H., de Reus, M., Lelieveld, J., Crutzen, P. J., Schultz, M., Stier, P., Huntrieser, H., Heland, J., Stohl, A., Forster, C., Ebern, H., Jakobs, H., and Dickerson, R. R.: Global chemical weather forcasts for field campaign planning: predictions and observa-tions of larger-scale features during MINOS, CONTRACE, and INDOEX, Atmos. Chem. Phys., 3, 267–289, 2003.
Lelieveld, J., Berresheim, H. Bormann, S. Crutzen, P. J., Dentener, F. J., Fischer, H., Feichter, J., Flateu, P. J., Heland, J., Holzinger, R., Korrmann, R., Lawrence, M. G., Levin, Z., Markowitz, K. M., Mihalopoulos, N., Minikin, A., Ramanathan, V., de Reus, M., Roelofs, G. J., Scheeren, H. A., Sclare, J., Schlager, H., Schultz, M., Siegmund, P., Steil, B., Stephanou, E. G., Stier, P., Traub, M., Warneke, C., Willians, J., and Ziereis, H.: Global air pollution crossroads over the Mediterranean, Science, 298, 794– 799, 2002
Leue, C., Wenig, M., Wagner, T., Platt, U., and J¨ahne, B.: Quan-titative analysis of NOxemissions from GOME satellite image
sequences, J. Geophys. Res., 106, 5493–5505, 2001.
Levine, J. S.: Global biomass burning: Atmospheric, climatic and biospheric implications, Global biomass burning, Atmospheric, climatic, and biospheric implications, edited by Levine, 1991. Macdonald, A. M., Wiebe, H. A., Li, S. M., Dryfhout-Clark, H.,
Asalian, K., Lu, G., Wang, D., Schiller, C. L., Harris, G. W., Sumner, A. L., and Shepson, P. B.: Results of a formaldehyde in-tercomparison study in Ontario, Atmospheric Environment Ser-vice, Ontario, Canada, 1999.
Martin, R. V., Chance, K., Jacob, D. J., Kurosu, T. P., Spurr, R. J. D., Bucsela, E., Gleason, J. F., Palmer, P. I., Bey, I., Fiore, A. M., Li, Q., Yantosca, R. M., and Koelemeijer, R. B. A.: An im-proved retrieval of tropospheric nitrogen dioxide from GOME, J. Geophys. Res., 107(D20), 4437, 10.1029/2001JD001027, 2002. Meyer-Arnek, J., Numerical validation, manual and userguide for
Traj.x, iup-Bremen, 2002.
Nash, T.: The colorimetric estimation of formaldehyde by means of the Hantzsch reaction, Biochemistry, 55, 416–421, 1953. Olivier, J. G. J., Bouwman, A. F., van der Maas, C. W. M.,
Berdowski, J. J. M., Veldt, C., Bloos, J. P. J., Visschededijk, A. J. J., Zandveld, P. Y. J., and Haverlag, J. L.: Description of EDGAR Version 2.0: A set of global inventories of greenhouse gases and ozone-depleting substances for all anthropogenic and most natu-ral sources on a per country 1◦×1◦grid. RIVM Rep, 771060002, Rijksinstituut, Bilthoven, The Netherlands, 1996.
Palmer, P. I., Jacob, D. J., Fiore, A. M., Martin, R. V., Chance, K., and Kurosu, T. P.: Mapping isoprene emissions over North America using formaldehyde columns observations from space, J. Geophys. Res., 101, 2053–2072, 2002.
Richter, A. and Burrows, J. P.: Retrieval of tropospheric NO2from
GOME measurements, Adv. Space Res., 29, 11, 1673–1683, 2002.
Rozanov, V., Diebel, D., Spurr, R. J., and Burrows, J. P.: GOME-TRAN: A radiative transfer model for the satellite project GOME – the plane parallel version, J. Geophys. Res., 102, 16 683– 16 695, 1997.
Sachs, L.: Angewandte Statistik, Springer-Verlag, 2000.
Sander, S. P., Friedl, R. R., DeMore, W. B., Golden, D. M., Kolb, C. E., Kurylo, M. J., Hampson, R. F., Huie, R. E., Molina, M. J., and Moortgat, G. K.: Chemical Kinetics and Photochemical Data for Use in Stratospheric Modeling, Supplement to Evaluation 12: Update of Key Reactions, JPL Publication 00-3, NASA Panel for Data Evaluation, Evaluation Number 13, 8 March 2000, Jet Propulsion Laboratory, Pasadena, California, 2000.
Shimizu, A. and Tsuda, T.: Variations in tropical tropopause ob-served with radiosondes in Indonesia, Geophys. Res. Lett, 27, 16, 2541–2544, 2000.
Tiedke, M.: A Comprehensive Mass Flux Scheme for Cumulus Pa-rameterization in Large Scale Models, Monthly Weather Review, August 1989.
Traub, M., Fischer, H., de Reus, M., Korrmann, R., Heland, J., Ziereis, H., Schlager, H., Holzinger, R., Williams, J., Warneke, C., de Grouw, J., and Lelieveld, J.: Chemical characteristics as-signed to trajectory clusters during the MINOS campaign, J., At-mos. Chem. Phys., 3, 459–468, 2003
Volz-Thomas, A., Lerner, A., P¨atz, H. W., Schulz, M., McKenna, D. S., Schmitt, R., Madronich, S., and R¨oth, E. P.: Airborne measurements of the photolysis frequency of NO2, J. Geophys.
Res., 101, 18 613–18 627, 1996.
von Kuhlmann, R.: Tropospheric photochemistry of O3, its
precur-sors and the hydroxyl radical: A 3D modeling study considering Non-Methane hydrocarbons, PhD Thesis, University of Mainz, Germany, 2001.
von Kuhlmann, R., Lawrence, M. G., Crutzen, P. J., and Rasch, P. J.: A Model for Studies of Tropospheric Ozone and Non-Methane Hydrocarbons: Model Description and Ozone Results, J. Geo-phys. Res., 108, D9, DOI10.1029/2002JD002893, 2003. Wagner, V., v. Glasow, R., Fischer, H., and Crutzen, P. J.: Are CH2O
measurements in the Marine boundary layer suitable for test-ing the current understandtest-ing of CH4photooxidation?, A model study, J. Geophys. Res., 107, 10 1029–10 1043, 2002.
Ziereis, H, Schlager, H., Schulte, P., K¨ohler, I., Marquardt, R., and Feigl, C.: In situ measurements of the NOxdistribution and
vari-ability over the eastern North Atlantic, J. Geophys. Res., 104, 16 021–16 032, 1999.