HAL Id: hal-03025464
https://hal.archives-ouvertes.fr/hal-03025464
Submitted on 26 Nov 2020HAL is a multi-disciplinary open access archive for the deposit and dissemination of sci-entific research documents, whether they are pub-lished or not. The documents may come from teaching and research institutions in France or abroad, or from public or private research centers.
L’archive ouverte pluridisciplinaire HAL, est destinée au dépôt et à la diffusion de documents scientifiques de niveau recherche, publiés ou non, émanant des établissements d’enseignement et de recherche français ou étrangers, des laboratoires publics ou privés.
The smart intuitor: Cognitive capacity predicts intuitive
rather than deliberate thinking
Matthieu Raoelison, Valerie Thompson, Wim de Neys
To cite this version:
Matthieu Raoelison, Valerie Thompson, Wim de Neys. The smart intuitor: Cognitive capac-ity predicts intuitive rather than deliberate thinking. Cognition, Elsevier, 2020, 204, pp.104381. �10.1016/j.cognition.2020.104381�. �hal-03025464�
The smart intuitor: Cognitive capacity predicts
intuitive rather than deliberate thinking
Matthieu Raoelison
1, Valerie A Thompson
2, Wim De Neys
1June 17, 2020
1Universit´e de Paris, LaPsyD´E, CNRS, F-75005 Paris, France 2University of Saskatchewan
*Corresponding author: Matthieu RAOELISON
LaPsyDE (CNRS & Universit´e de Paris) Sorbonne - Labo A. Binet
46, rue Saint Jacques 75005 Paris
France
-Abstract
Cognitive capacity is commonly assumed to predict performance in classic rea-soning tasks because people higher in cognitive capacity are believed to be better at deliberately correcting biasing erroneous intuitions. However, recent findings sug-gest that there can also be a positive correlation between cognitive capacity and correct intuitive thinking. Here we present results from 2 studies that directly con-trasted whether cognitive capacity is more predictive of having correct intuitions or successful deliberate correction of an incorrect intuition. We used a two-response paradigm in which people were required to give a fast intuitive response under time pressure and cognitive load and afterwards were given the time to deliberate. We used a direction-of-change analysis to check whether correct responses were gener-ated intuitively or whether they resulted from deliberate correction (i.e., an initial incorrect-to-correct final response change). Results showed that although cognitive capacity was associated with the correction tendency (overall r = .13) it primarily predicted correct intuitive responding (overall r = .42). These findings force us to rethink the nature of sound reasoning and the role of cognitive capacity in reason-ing. Rather than being good at deliberately correcting erroneous intuitions, smart reasoners simply seem to have more accurate intuitions.
Keywords: Reasoning; Decision-making; Cognitive capacity; Dual-process theory; Heuristics & biases
Introduction
Although reasoning has been characterized as the essence of our being, we do not always reason correctly. Decades of research show that human reasoners are often biased and easily violate basic logical, mathematical, and probabilistic norms when a task cues an intuitive response that conflicts with these principles (Kahneman, 2011). Take for example, the notorious bat and ball problem (Frederick, 2005):
“A bat and a ball together cost$1.10. The bat costs $1 more than the ball. How much does the ball cost?”
For most people, the answer that intuitively pops up into mind is “10 cents”. Upon some reflection it is clear that this cannot be right. If the ball costs 10 cents, the bat would cost–at a dollar more–$1.10 which gives a total of $1.20. The correct answer is that the ball costs 5 cents (at a dollar more the bat costs $1.05, which gives a total of $1.10). Nevertheless, the majority of participants write down the “10 cents” answer when quizzed about this problem (Frederick, 2005). The intuitive pull of the “10 cents” seems to be such that it leads us astray and biases our thinking.
However, not everyone is biased. Some people do give the correct answer. Individ-ual differences studies have shown that people who score higher on general intelligence and capacity tests are often less likely to be tricked by their intuition (e.g., De Neys, 2006b; Stanovich, 2011; Stanovich & West, 2000, 2008; Toplak, West, & Stanovich, 2011). While this association is fairly well established, its nature is less clear. One dominant view is heavily influenced by the dual process framework that conceives thinking as an interplay between an intuitive reasoning process and a more demanding deliberate one (Evans, 2008; Kahneman, 2011; Sloman, 1996). In general, this “smart deliberator” view entails that people higher in cognitive capacity are better at deliberately correcting erro-neous intuitions (e.g., De Neys, 2006b; De Neys & Verschueren, 2006; Evans & Stanovich, 2013; Kahneman, 2011; Stanovich, 2011; Stanovich & West, 1999, 2000; Toplak, West, & Stanovich, 2011). More specifically, incorrect or “biased” responding is believed to result from the simple fact that –just as in the bat-and-ball problem– many situations cue an erroneous, intuitive response that readily springs to mind. Sound reasoning in these cases will require us to switch to more demanding deliberate thinking and correct the initial intuitive response. A key characteristic of this deliberate thinking is that it is highly
de-manding of our limited cognitive resources (Evans & Stanovich, 2013; Kahneman, 2011; Sloman, 1996). Because human reasoners have a strong tendency to minimize demand-ing computations many reasoners will refrain from engagdemand-ing or completdemand-ing this effortful deliberate processing and stick to the intuitively cued answer. People higher in cognitive capacity will be more likely to have the necessary resources and/or motivation to complete the deliberate process and correct their erroneous intuition.
Although the smart deliberator view is appealing and has been highly influential in the literature (Kahneman, 2011; Stanovich & West, 2000), it is not the only possible explanation for the link between cognitive capacity and reasoning accuracy. In theory, it might also be the case that people higher in cognitive capacity simply have more accurate intuitions (e.g., Peters, 2012; Reyna, 2012; Reyna & Brainerd, 2011; Thompson & Johnson, 2014; Thompson et al., 2018). Consequently, they would not need to deliberate to correct an initial intuition. Their intuitive first hunch would already be correct. Under this “smart intuitor” view, cognitive capacity would predict the ability to have accurate intuitions rather than the ability to deliberately correct one’s intuitions.
It will be clear that deciding between the smart deliberator and intuitor views is critical for our characterization of sound reasoning (i.e., having good intuitions or good correc-tion) and what cognitive capacity tests measure (i.e., an ability to correct our intuitions or the ability to have correct intuitions). Interestingly, although the smart deliberator view has long dominated the field, some recent findings with the two-response paradigm (Thompson, Prowse Turner, & Pennycook, 2011) seem to lend empirical credence to the smart intuitor view too. In the two-response paradigm participants are asked to provide two consecutive responses to a problem. First, they have to respond as fast as possible with the first intuitive response that comes to mind. Immediately afterwards, they can take all the time to reflect on the problem before giving a final response. Results show that reasoners who give the correct response as their final response frequently generate the same response as their initial response (Bago & De Neys, 2017, 2019; Newman, Gibb, & Thompson, 2017; Raoelison & De Neys, 2019; Thompson, Prowse Turner, & Penny-cook, 2011). Hence, sound reasoners do not necessarily need to deliberate to correct their intuition. Critically, individual difference studies further indicate that this initial correct responding is more likely among those higher in cognitive capacity (Thompson & Johnson, 2014; Thompson et al., 2018).
Unfortunately, the available evidence is not conclusive. Although the observed corre-4
lation between cognitive capacity and initial response accuracy might be surprising, the correlation with one’s final accuracy after deliberation is still higher (Thompson & John-son, 2014). Hence, even though there might be a small link between cognitive capacity and having accurate intuitions one can still argue–in line with the smart deliberator view–that the dominant contribution of cognitive capacity lies in its role in the deliberate correction of one’s intuitions. More generally, the problem is that simply contrasting initial and final accuracy does not allow us to draw clear processing conclusions. To illustrate, assume de-liberation plays no role whatsoever in correct responding. High capacity reasoners would have fully accurate intuitions, and do not need any further deliberate correction. However, obviously, once one arrives at the correct response in the initial response stage, one can simply repeat the same answer as one’s final response without any further deliberation. Hence, even if deliberate correction plays no role whatsoever in accurate reasoning, the final accuracy correlation will not be smaller than the initial one.
What is needed to settle the debate is a more fine-grained approach that allows us to track how an individual changed (or didn’t change) their initial response after deliberation. Here we use a two-response paradigm and direction-of-change analysis (Bago & De Neys, 2017) to this end. The basic rationale is simple. On each trial people can give a correct or incorrect response in each of the two response stages. Hence, in theory, this can result in four different types of answer patterns on any single trial (“00 ”, incorrect response in both stages; “11 ”, correct response in both stages; “01 ”, initial incorrect and final correct response; “10 ”, initial correct and final incorrect response). Looking at the direction of change pattern allows us to decide whether the capacity-reasoning association is driven primarily by intuitive or deliberate processing. A successful deliberate override of an initial incorrect response will result in a “01 ” type response. If the traditional view is correct and smarter people are specifically better at this deliberate correction, then we expect that cognitive capacity will be primarily associated with the probability of “01 ” responses. If smarter people have better intuitions, then they should primarily give “11 ” responses in which the final correct response was already generated as initial response. By contrasting whether cognitive capacity primarily predicts “01 ” vs “11 ” responses we can decide between the “smart deliberator” and “smart intuitor” hypotheses. We present two studies that addressed this question.
In addition, we also adopt methodological improvements to make maximally sure that participants’ initial response is intuitive in nature. Note that in previous individual
differ-ences two-response studies (Thompson & Johnson, 2014), participants were instructed– and not forced–to respond intuitively. Hence, participants higher in cognitive capacity might have ended up with a correct first response precisely because they failed to respect the instructions and engaged in deliberate processing. In the present study we adopt strin-gent procedures to minimize this issue. Participants are forced to give their first response within a challenging deadline and while their cognitive resources are burdened with a secondary load task (Bago & De Neys, 2017, 2019). Given that deliberation is assumed to be time and resource demanding (Kahneman, 2011; Kahneman & Frederick, 2005), the time pressure and load will help to prevent possible deliberation during the initial response stage (Bago & De Neys, 2017).
Study 1
1
Methods
1.1
Participants
We recruited 100 online participants (56 female, Mean age = 34.9 years, SD = 12.1 years) on Prolific Academic (www.prolific.ac). They were paid£5 per hour for their partic-ipation. Only native English speakers from Canada, Australia, New Zealand, the United States of America, or the United Kingdom were allowed to take part in the study. Among them, 48 reported high school as their highest level of education, while 51 had a higher education degree, and 1 reported less than high school as their highest educational level. The sample size allowed us to detect medium size correlations with power of .80. Note that the correlation between cognitive capacity and reasoning performance that is observed in traditional (one-response) studies typically lies within the medium-to-strong range (e.g., Stanovich & West, 2000; Toplak, West, & Stanovich, 2011)
1.2
Material
1.2.1 Reasoning tasks
This experiment adopted three classic tasks that have been widely used to study biased reasoning. For each of those, participants had to solve four standard, ”conflict” problems and four control, ”no-conflict” problems (see further). The three tasks were as follows:
Bat-and-ball (BB). Participants solved content modified versions of the bat-and-ball problem taken from Bago and De Neys (2019). The problem content stated varying amounts and objects, but the problems had the same underlying structure as the original bat-and-ball. Four response options were provided for each problem: the correct response (“5 cents” in the original bat-and-ball), the intuitively cued “heuristic” response (“10 cents” in the original bat-and-ball), and two foil options. The two foil options were al-ways the sum of the correct and heuristic answer (e.g., “15 cents” in original bat-and-ball units) and their second greatest common divisor (e.g., “1 cent” in original units1). For each item, the four response options appeared in a randomly determined order. The following illustrates the format of a standard problem version:
A pencil and an eraser cost $1.10 in total. The pencil costs $1 more than the eraser. How much does the eraser cost?
-5 cents -1 cent -10 cents -15 cents
To verify that participants stayed minimally engaged, the task included four control “no-conflict” problem versions in addition to four standard “conflict” items. In the stan-dard bat-and-ball problems the intuitively cued “heuristic” response cues an answer that conflicts with the correct answer. In the “no-conflict” control problems, the heuristic in-tuition is made to cue the correct response option by deleting the critical relational “more than” statement (e.g., “A pencil and an eraser cost $1.10 in total. The pencil costs $1.
1To illustrate, consider the common divisors of 15 and 30. In ascending order these are 1, 3, 5, and
How much does the eraser cost?). In this case the intuitively cued “10 cents” answer is also correct. The same four answer options as for a corresponding standard conflict version were used. Given that everyone should be able to solve the easy “no-conflict” problems correctly on the basis of mere intuitive reasoning, we expect to see ceiled performance on the control items, if participants are paying minimal attention to the task and refrain from mere random responding.
Two sets of items were created in which the conflict status of each item was counterbal-anced: Item content that was used to create conflict problems for half of the participants, was used to create no-conflict problems for the other half (and vice versa).
Problems were presented serially. Each trial started with the presentation of a fixation cross for 1000 ms. After the fixation cross disappeared, the first sentence of the problem, which always stated the two objects and their cost together (e.g., “A pencil and an eraser cost$1.10 in total”), was presented for 2000 ms. Next, the rest of the problem was presented under the first sentence (which stayed on the screen), with the question and the possible answer options. Participants had to indicate their answer by clicking on one of the options with the mouse. The eight items were presented in random order.
Syllogism (SYL). We used the same syllogistic reasoning task as Bago & De Neys (2017). Participants were given eight syllogistic reasoning problems based on Markovits & Nantel (1989). Each problem included a major premise (e.g., “All dogs have four legs”), a minor premise (e.g., “Puppies are dogs”), and a conclusion (e.g., “Puppies have four legs”). The task was to evaluate whether the conclusion follows logically from the premises. In four of the items the believability and the validity of the conclusion conflicted (con-flict items, two problems with an unbelievable–valid conclusion, and two problems with a believable–invalid conclusion). For the other four items the logical validity of the con-clusion was in accordance with its believability (no-conflict items, two problems with a believable–valid conclusion, and two problems with an unbelievable–invalid conclusion). We used the following format:
All dogs have four legs Puppies are dogs Puppies have four legs
Does the conclusion follow logically? -Yes
-No
Two sets of items were used for counterbalancing purposes. The same contents were used but the conflict and no-conflict status was reversed for each of them by switching the minor premise and the conclusion. Each set was used for half the participants.
The premises and conclusion were presented serially. Each trial started with the pre-sentation of a fixation cross for 1000 ms. After the fixation cross disappeared, the first sentence (i.e., the major premise) was presented for 2000 ms. Next, the second sentence (i.e., minor premise) was presented under the first premise for 2000 ms. After this in-terval was over, the conclusion together with the question “Does the conclusion follow logically?” and two response options (yes/no) were presented right under the premises. Once the conclusion and question were presented, participants could give their answer by clicking on it. The eight items were presented in a randomized order.
Base Rate (BR). Participants solved a total of eight base-rate problems taken from Bago & De Neys (2017). Participants always received a description of the composition of a sample (e.g., “This study contained I.T engineers and professional boxers”), base rate information (e.g., “There were 995 engineers and 5 professional boxers”) and a descrip-tion that was designed to cue a stereotypical associadescrip-tion (e.g. “This person is strong”). Participants’ task was to indicate to which group the person most likely belonged. The problem presentation format was based on Pennycook et al. (2014). The base rates and descriptive information were presented serially and the amount of text that was presented on screen was minimized. First, participants received the names of the two groups in the sample (e.g., “This study contains clowns and accountants”). Next, under the first sen-tence (which stayed on the screen) we presented the descriptive information (e.g., Person ‘L’ is funny). The descriptive information specified a neutral name (‘Person L’) and a single word personality trait (e.g., “strong” or “funny”) that was designed to trigger the stereotypical association. Finally, participants received the base rate probabilities. The following illustrates the full problem format:
This study contains clowns and accountants. Person ’L’ is funny.
There are 995 clowns and 5 accountants. Is Person ’L’ more likely to be:
-A clown -An accountant
Half of the presented problems were conflict items and the other half were no-conflict items. In no-conflict items the base rate probabilities and the stereotypical information cued the same response. Two sets of items were used for counterbalancing purposes. The same contents were used but the conflict and no-conflict status of the items in each set was reversed by switching the base rates of the two categories.
Pennycook et al. (2014) pretested the material to make sure that words that were selected to cue a stereotypical association consistently did so but avoided extremely diag-nostic cues. As Bago & De Neys (2017) clarified, the importance of such a non-extreme, moderate association is not trivial. Note that we label the response that is in line with the base rates as the correct response. Critics of the base rate task (e.g., Gigerenzer, Hell, & Blank, 1988; see also Barbey & Sloman, 2007) have long pointed out that if reasoners adopt a Bayesian approach and combine the base rate probabilities with the stereotypical description, this can lead to interpretative complications when the descrip-tion is extremely diagnostic. For example, imagine that we have an item with males and females as the two groups and give the description that Person ‘A’ is ‘pregnant’. Now, in this case, one would always need to conclude that Person ‘A’ is a woman, regardless of the base rates. The more moderate descriptions (such as ‘kind’ or ‘funny’) help to avoid this potential problem. In addition, the extreme base rates that were used in the current study further help to guarantee that even a very approximate Bayesian reasoner would need to pick the response cued by the base-rates (see De Neys, 2014).
Each item started with the presentation of a fixation cross for 1000 ms. After the fixation cross disappeared, the sentence which specified the two groups appeared for 2000 ms. Then the stereotypical information appeared, for another 2000 ms, while the first sentence remained on the screen. Finally, the last sentence specifying the base rates ap-peared together with the question and two response alternatives. Once the base-rates and question were presented participants were able to select their answer by clicking on it. The eight items were presented in random order.
Two-response format. We used the two-response paradigm (Thompson, Prowse Turner, & Pennycook, 2011) to elicit both an initial, intuitive response and a final, deliberate one. Participants had to provide two answers consecutively to each reasoning problem. To minimize the possibility that deliberation was involved in producing the initial response, participants had to provide their initial answer within a strict time limit while performing a concurrent load task (see Bago & De Neys, 2017, 2019; Raoelison & De Neys, 2019). The load task was based on the dot memorization task (Miyake et al., 2001) as it had been successfully used to burden executive resources during reasoning (e.g., De Neys, 2006b; Franssens & Neys, 2009). Participants had to memorize a complex visual pattern (i.e., 4 crosses in a 3x3 grid) presented briefly before each reasoning problem. After answering the reasoning problem the first time (i.e., intuitively), participants were shown four different patterns (i.e., with different cross placings) and had to identify the one presented earlier. Miyake et al. (2001) showed that the dot memorization task taxes executive resources. Previous reasoning studies also indicate that dot memorization load directly hampered reasoning (i.e., it typically decreases reasoning accuracy when solving the classic reason-ing tasks adopted in the present study, e.g., De Neys, 2006b, Franssens & Neys, 2009, Johnson, Tubau, & De Neys, 2016, and this disruption is also observed for those in the top range of the cognitive capacity distribution, e.g., De Neys, 2006b).
The precise initial response deadline for each task was based on the pretesting by Bago & De Neys (2017, 2019). The allotted time corresponded to the time needed to simply read the problem conclusion, question, and answer alternatives (i.e., the last part of the serially presented problem) in each task and move the mouse (bat-and-ball problem: 5 s; syllogisms: 3 s; base-rate task: 3 s). Obviously, the load and deadline were applied only during the initial response stage and not during the subsequent final response stage in which participants were allowed to deliberate (see further).
1.2.2 Cognitive capacity tests
Raven. Raven’s Advanced Progressive Matrices (APM, Raven, Raven, & Court, 1998) have been widely used as a measure of fluid intelligence (Conway et al., 2002; Engle et al., 1999; Kane et al., 2004; Unsworth & Engle, 2005). A Raven problem presents a 3 x 3 matrix of complex visual patterns with a missing element, requiring one to pick the only pattern matching both row- and column-wise among eight alternatives to solve it.
We used the short form of the APM developed by Bors & Stokes (1998) that includes 12 items. Raven score for each participant was defined as the number of correctly solved items, ranging from 0 to 12.
CRT-2. The Cognitive Reflection Test (CRT) developed by Frederick (2005) is a short questionnaire that captures both cognitive capacity and motivational thinking dispositions to engage deliberation (Toplak, West, & Stanovich, 2014). It has proven to be one of the single best predictors of reasoning accuracy (Toplak, West, & Stanovich, 2011). In the present study, we used the CRT-2, an alternative, four-question version of the CRT developed by Thomson & Oppenheimer (2016). The CRT-2 uses verbal word problems (e.g., “If you’re running a race and you pass the person in second place, what place are you in?” (intuitive answer: first; correct answer: second) that rely less on numerical calculation abilities. Note that the bat-and-ball problem does not feature in the CRT-2. As with the original CRT, solving each of its four questions is assumed to require engaging in deliberation to overcome intuitive but erroneous responses. The CRT-2 score we computed was the number of correctly solved questions, ranging from 0 to 4.
1.3
Procedure
The experiment was run online on the Qualtrics platform. Upon starting the experiment, participants were told that the study would take about fifty minutes and demanded their full attention throughout. They were then presented with the three reasoning tasks in a random order. Each task was first introduced by a short transition to indicate the overall progress (e.g., ”You are going to start task 1/5. Please click on Next when you are ready to start task 1.”) before a general presentation of the task. For the first task, this general presentation stated the following:
Please read these instructions carefully!
The following task is composed of 8 questions and a couple of practice ques-tions. It should take about 10 minutes to complete and it demands your full attention.
In this task we’ll present you with a set of reasoning problems. We want to know what your initial, intuitive response to these problems is and how you respond after you have thought about the problem for some more time.
Hence, as soon as the problem is presented, we will ask you to enter your initial response. We want you to respond with the very first answer that comes to mind. You don’t need to think about it. Just give the first answer that intuitively comes to mind as quickly as possible.
Next, the problem will be presented again and you can take all the time you want to actively reflect on it. Once you have made up your mind you enter your final response. You will have as much time as you need to indicate your second response.
After you have entered your first and final answer we will also ask you to indicate your confidence in the correctness of your response.
In sum, keep in mind that it is really crucial that you give your first, initial response as fast as possible. Afterwards, you can take as much time as you want to reflect on the problem and select your final response.
Next, the reasoning task was presented. The presentation format was explained and the deadline for the initial response was introduced (see Supplementary material for full instructions). Participants solved two unrelated practice reasoning problems to familiarize themselves with the deadline and the procedure. Next, they solved two practice matrix recall problems (without concurrent reasoning problem). Finally, at the end of the practice, they had to solve the two earlier practice reasoning problems under cognitive load.
Every task trial started with a fixation cross shown for 1 second. Next, the target pattern for the memorization task was presented for 2 seconds. We then presented the problem preambles (i.e., first sentence of the bat-and-ball problems, group composition for the base rate items, or major premise of the syllogisms, see Material) for 2 seconds. The second sentence (i.e., adjective of the base-rate item, or the minor premise of the syllogisms) was then displayed under the first sentence for 2 seconds as well for the relevant tasks. Afterward the full problem was presented and participants were asked to enter their initial response.
The initial response deadline was 5 seconds for the bat-and-ball task and 3 seconds for the syllogisms and base-rate problems (see Material). One second before the deadline the background of the screen turned yellow to warn participants about the upcoming deadline. If they did not provide an answer before the deadline, they were asked to pay attention to providing an answer within the deadline on subsequent trials. After the
initial response was entered, participants were presented with four matrix patterns from which they had to choose the correct, to-be-memorized pattern. Once they provided their memorization answer, they received feedback as to whether it was correct. If the answer was not correct, they were also asked to pay more attention to memorizing the correct dot pattern on subsequent trials. Finally, the full item was presented again, and participants were asked to provide a final response.
The color of the answer options was green during the first response, and blue during the final response phase, to visually remind participants which question they were answering. Therefore, right under the question we also presented a reminder sentence: “Please indicate your very first, intuitive answer!” and “Please give your final answer.”, respectively, which was also colored as the answer options.
After participants had entered their initial and final answers, they were also always asked to indicate their response confidence on a scale ranging from 0% (completely sure I’m wrong) to 100 % (completely sure I’m right). These confidence ratings were collected for consistency with previous work but were not analyzed.
After completing the eight items of each task, a transition indicated the overall progress (e.g., ”This is the end of task 1. You are going to start task 2/5. Click on Next when you are ready to start task 2.”). Next, the subsequent reasoning task was introduced.
After participants completed the third reasoning task, they were introduced to the Raven matrices:
Please read these instructions carefully!
The following task will assess your observation and reasoning skills. There is no time limit and no memorization task here.
You will see a picture with a missing part and 8 potential fragments. Your task is to pick the correct fragment to complete the picture.
You’ll first be presented with 2 problems to familiarize yourself with the task. Please click on Next to start practice.
Participants were then shown one Raven item along with the solution and basic expla-nations, followed by another example where they had to solve it themselves and received feedback. The twelve Raven items were presented one after the other. Participants had to
provide an answer for each item and could not skip it to progress through the task. There was no time limit to provide an answer.
After completing the Raven task, participants were introduced to the CRT-2: Please read these instructions carefully!
The following task is composed of 4 questions. There is no time limit and no memorization task here.
Click on Next to proceed.
Each item of the CRT-2 was presented separately. No time limit was used either. At the very end of the experiment, participants were shown the standard bat-and-ball problem and were asked whether they had seen it before. We also asked them to enter the solution. Finally, participants completed a page with demographic questions.
1.4
Exclusion criteria
Missed deadline and load task failure. We discarded trials where participants failed to provide a response before the deadline or failed the load memorization task because we could not guarantee that the initial response for these trials did not involve any deliber-ation.
For bat-and-ball items, participants missed the deadline on 48 trials and further failed the load task on 114 trials, leading to 638 remaining trials out of 800 (79.75%). On average each participant contributed 3.1 (SD = 1) standard problem trials and 3.3 (SD = 0.8) control no-conflict trials. For syllogisms, participants missed the deadline on 65 trials and further failed the load task on 107 trials, leading to 628 remaining trials out of 800 (78.5%). On average each participant contributed 3.1 (SD = 1) standard problem trials and 3.2 (SD = 0.9) control no-conflict trials. For the base-rate neglect task, participants missed the deadline on 48 trials and further failed the load task on 115 trials, leading to 637 remaining trials out of 800 (79.63%). On average each participant contributed 3.2 (SD = 1) standard problem trials and 3.2 (SD = 1) control no-conflict trials.
Bat-and-ball familiarity. The bat-and-ball is widely used and has been popularized in the media as well (Hoover & Healy, 2017). If participants already knew the task, they might not need to override a heuristic, incorrect intuition to solve it. In addition, high
IQ people are more likely to have seen it before (Bialek & Pennycook, 2017). This might unduly bias results against the ”smart deliberator” hypothesis. We therefore excluded from our analysis an additional 126 bat-and-ball trials from 20 participants (34 of their bat-ad-ball trials were already excluded because of missed deadline and load task failure) who reported having seen the original problem before and were able to provide the correct ”5 cents” response at the end of the experiment. Their trials for the other tasks were included in the analysis.
1.5
Composite measures
For the reasoning performance and cognitive capacity correlation analyses we computed a composite index of cognitive capacity by averaging the z-scores on each of the individual cognitive capacity tests (i.e., Raven and CRT-2). Likewise, for reasoning performance we created a composite index by averaging the z-scores on each of the individual reasoning tasks (i.e., syllogisms, base-rate, and bat-and-ball). We calculated a separate reasoning performance composite for initial accuracy, final accuracy, and each direction of change category (see further).
2
Results and discussion
2.1
Reasoning performances
Accuracy. Table 1 shows the accuracy results for individual tasks. In line with previous findings, both at the initial and final response stages participants were predominantly biased and showed overall low accuracy on the conflict problems (average initial accuracy: M = 33.8, SD = 29; average final accuracy: M = 41.6, SD = 32.3). However, as expected, they had little trouble solving the control no-conflict problems correctly (average initial accuracy: M = 88.1, SD = 12.1; average final accuracy: M = 89.2, SD = 13.3). These trends were observed on all individual tasks. Note that as in previous two-response studies, accuracy on the conflict problems also slightly increased from the initial to final response stage.
Direction of change. We proceeded to a direction of change analysis (Bago & De Neys, 2017) on conflict trials to pinpoint how precisely participants changed (or didn’t change) their initial answer after deliberation. To recap, since participants were asked to provide two responses on each trial, this resulted in four possible direction of change categories: 00 (both incorrect initial and final responses), 01 (incorrect initial response but correct final responses), 10 (correct initial response but incorrect final response) and 11 (both correct initial and final responses). Table 2 reports the frequency of each direction for individual tasks.2 We observed figures similar to previous studies (Bago & De Neys, 2017,
2019; Raoelison & De Neys, 2019): overall, the majority of trials were 00 (57.5% on average), which reflected the fact that people are typically biased in these tasks and don’t change an initial incorrect response after deliberation. The second most prevalent overall category was 11 (30.9%), followed by 01 (9.5%) and 10 (2.2%). Note that for all tasks we consistently observe a higher proportion of 11 than 01 trials. This implies that in those cases that a reasoner gives a correct final response after deliberation, they typically already generated the correct answer as their initial, intuitive response. Consistent with previous findings (Bago & De Neys, 2017, 2019), this suggests that correct final responders often already have correct intuitions.
2For completeness, the frequency for no-conflict trials can be found in the Supplementary section
Table 1
Percentage of Correct Initial and Final Responses (SD) on Conflict, No-Conflict and Neutral Problems in the Bat-and-Ball, Base-Rate and Syllogistic Reasoning Tasks
Study Task Conflict No-conflict Neutral
Initial Final Initial Final Initial Final Study 1 BB 9.6% (25.5) 13% (31.8) 97.8% (9.9) 96.4% (15.6) BR 38.6% (41.8) 49.4% (45.7) 91.4% (19.7) 95.6% (15.5) SYL 43.9% (34.5) 51% (34.7) 76.8% (24.6) 77% (24.3) Average 33.8% (29) 41.6% (32.3) 88.1% (12.1) 89.2% (13.3) Study 2 BB 12% (26.3) 13.7% (32) 94.1% (17.2) 99.1% (6.6) 62.9% (31.5) 90.6% (22.4) BR 49.3% (43) 56.7% (43.4) 95.9% (13.1) 97.7% (8.9) 84.8% (26.5) 89.6% (23.2) SYL 39.3% (30.9) 46.7% (34) 75.2% (23) 80.7% (22.3) 60.3% (29.9) 68.6% (28.9) Average 36.6% (25.6) 43.2% (30.1) 88.2% (12.2) 92.2% (8.9) 70.5% (19.1) 82.6% (15.7) Combined BB 11.1% (26) 13.5% (31.8) 95.5% (14.9) 98% (11) BR 45.2% (42.8) 53.9% (44.3) 94.2% (16) 96.9% (11.9) SYL 41.1% (32.3) 48.4% (34.3) 75.8% (23.6) 79.2% (23.1) Average 35.5% (26.9) 42.5% (30.9) 88.2% (12.1) 91% (10.9) Note. BB = bat-and-ball; BR = base rate; SYL = syllogism.
Table 2
Percentage of Trials Within Every Direction of Change Category for Conflict and Neutral Items
Study Items Task Direction of change
00 01 10 11 Study 1 Conflict BB 86.5% (218) 3.6% (9) 0% (0) 9.9% (25) BR 44.8% (142) 14.8% (47) 3.8% (12) 36.6% (116) SYL 46.8% (144) 8.8% (27) 2.3% (7) 42.2% (130) Average 57.5% (504) 9.5% (83) 2.2% (19) 30.9% (271) Study 2 Conflict BBB 83.3% (355) 4.9% (21) 2.6% (11) 9.2% (39) BR 36.8% (203) 13.6% (75) 5.4% (30) 44.2% (244) SYL 48.4% (268) 11.4% (63) 3.1% (17) 37.2% (206) Average 53.9% (826) 10.4% (159) 3.8% (58) 31.9% (489) Neutral BB 5.6% (19) 30.4% (104) 3.8% (13) 60.2% (206) BR 6.3% (35) 7.1% (39) 2.7% (15) 83.9% (463) SYL 24.7% (128) 15.4% (80) 6.4% (33) 53.6% (278) Average 12.9% (182) 15.8% (223) 4.3% (61) 67% (947) Combined Conflict BB 84.5% (573) 4.4% (30) 1.6% (11) 9.4% (64) BR 39.7% (345) 14% (122) 4.8% (42) 41.4% (360) SYL 47.8% (412) 10.4% (90) 2.8% (24) 39% (336) Average 55.2% (1330) 10% (242) 3.2% (77) 31.5% (760) Note. BB = bat-and-ball; BR = base rate; SYL = syllogism. The raw number of trials in each category is presented between brackets.
2.2
Cognitive capacity correlation
Cognitive capacity scores. On average, participants scored 4.7 (SD = 2.7) on the Raven task and 2.2 (SD = 1.2) on the CRT-2. Performance on each task was correlated, r (98) = .28, p = .005 (see also Table S2). To get a global measure of cognitive capacity, we computed their respective z-scores and averaged them to create a composite measure of cognitive capacity.3
Accuracy correlations. Similarly, accuracies on the individual reasoning tasks were also correlated (see Tables S3 and S4 for an overview). To have a single comprehensive measure of conflict accuracy for all tasks, we took the average of z-scores from each task, both for initial and final conflict accuracy. Note that for participants familiar with the original bat-and-ball problem (or who missed all trials on a task), this reasoning composite was based on the available z-scores. Correlations observed using these composite measures replicated previous findings (Thompson & Johnson, 2014; Thompson et al., 2018): At the composite level, final conflict accuracy was significantly correlated with cognitive capacity, r (98) = .55, p < .001. This was also the case for initial conflict accuracy, although the correlation was slightly lower, r (98) = .49, p < .001. Table 3 details correlations for the individual tasks and capacity measures.4 As the table indicates, the trend at the general
composite level was robust at the individual task and capacity measure level.
3Given the rather modest correlation between the two capacity measures one might question whether it
is useful to combine them into a composite. We use the composite measure mainly for ease of presentation. Note that in both our studies, the trend at the general composite level was robust at the individual task and capacity measure level (see Table 3 and Table 4)
4For completeness, no-conflict correlations can be found in the Supplementary section (Table S5)
Table 3
Correlations Between Task Accuracy and Cognitive Capacity Measures at the Initial and Final Response Stages for Conflict and Neutral Items
Study Items Task Initial Final df Raven CRT Composite Raven CRT Composite Study 1 Conflict BB .46*** .20 .41*** .44*** .25* .43*** 76 BR .34*** .26* .37*** .37*** .32** .43*** 95 SYL .17 .23* .25* .27** .27** .34*** 97 Reasoning composite .43*** .35*** .49*** .47*** .42*** .55*** 98 Study 2 Conflict BB .23** .18* .26** .36*** .18* .35*** 126 BR .12 .01 .08 .27*** .09 .23** 158 SYL .34*** .21** .35*** .37*** .26** .39*** 157 Reasoning composite .33*** .19* .32*** .44*** .25** .44*** 158 Neutral BB .14 .21* .22* .23* .14 .24** 122 BR .22** .11 .21** .16* .15 .20* 158 SYL .06 .07 .08 .22** -.01 .13 156 Reasoning composite .21** .20* .26*** .33*** .17* .31*** 158 Combined Conflict BB .32*** .18** .32*** .39*** .21** .38*** 204 BR .20** .09 . 18** .31*** .17** .30*** 255 SYL .27*** .23*** .31*** .33*** .27*** .37*** 256 Reasoning composite .37*** .25*** .39*** .45*** .32*** .48*** 158 21
Direction of change correlations. To examine the critical relation between the di-rection of change for conflict trials and cognitive capacity, we calculated the proportion of each direction category in each task for every individual.5 In addition, we computed a composite measure for each direction category by averaging the corresponding z-scores in the individual tasks. Table 4 shows the results. We focus here on the general compos-ite level but as the table shows, the individual tasks and capacity measures showed the same trends. Globally, cognitive capacity was negatively correlated with the probability to generate a 00 trial, r (98) = -.53, p < .001. People lower in cognitive capacity were more likely to be biased at both the initial and final response stages. Cognitive capacity correlated positively with the probability to generate a 01 trial, r (98) = .22, p = .031, but was even more predictive of the probability to generate a 11 trial, r (98) = .52, p < .001, suggesting that cognitive capacity contributes more to intuitive thinking than deliberate correction. The difference between both 01 and 11 correlation coefficients was statisti-cally significant, t (97) = -2.459, p = .016. For the rare 10 trials, we found a negative correlation that failed to reach significance, r (98) = -.17, p = .089.
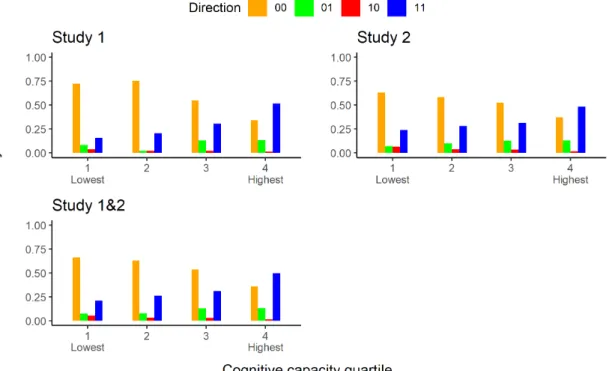
For illustrative purposes, Figure 1 shows the direction of change distribution for each quartile of the composite cognitive capacity measure. As the figure indicates, with in-creasing cognitive capacity the prevalence of 00 responses decreases and this is especially accompanied by a rise in 11 rather than 01 responses.
5This reflects how likely an individual is to show each specific direction of change pattern. Thus, for
any individual, P(00) + P(01) + P(10) + P(11) = 1.
Figure 1. Direction of change distribution for each cognitive capac-ity quartile. Note. The proportion of trials belonging to each direc-tion of change category is represented for each cognitive capacity quartile ranging from 1 (lowest) to 4 (highest).
Table 4
Correlations Between Direction of Change Probability and Cognitive Capacity Measures for Conflict and Neutral Items
Study Items Direction Task Raven CRT Composite df Study 1 Conflict 00 BB -.44*** -.25* -.43*** 76 BR -.36*** -.29** -.41*** 95 SYL -.24* -.26** -.31** 97 Reasoning composite -.45*** -.40*** -.53*** 98 01 BB .21 .27* .30** 76 BR .07 .07 .09 95 SYL .11 .05 .10 97 Reasoning composite .15 .19 .22* 98 10 BB NAa NA NA 76 BR -.09 -.15 -.15 95 SYL -.13 -.04 -.11 97 Reasoning composite -.15 -.13 -.17 98 11 BB .46*** .20 .41*** 76 BR .36*** .30** .41*** 95 SYL .21* .24* .28** 97 Reasoning composite .46*** .37*** .52*** 98 Study 2 Conflict 00 BB -.31*** -.13 -.29** 126 BR -.21** -.06 -.17* 158 SYL -.35*** -.26** -.38*** 157 Reasoning composite -.39*** -.23** -.39*** 158 01 BB .32*** -.01 .20* 126 BR .16* .10 .16* 158 SYL .08 .12 .12 157 Reasoning composite .24** .12 .23** 158 10 BB -.13 -.12 -.16 126 BR -.17* -.07 -.15 158 24
Table 4 (Continued)
Study Items Direction Task Raven CRT Composite df SYL -.07 0 -.04 157 Reasoning composite -.19* -.12 -.19* 158 11 BB .30*** .24** .34*** 126 BR .18* .03 .14 158 SYL .36*** .21** .36*** 157 Reasoning composite .39*** .23** .39*** 158 Neutral 00 BB -.16 -.18* -.22* 122 BR -.15 -.15 -.19* 158 SYL -.05 .03 -.01 156 Reasoning composite -.20* -.17* -.23** 158 01 BB -.05 -.11 -.10 122 BR -.16* .01 -.09 158 SYL -.01 -.14 -.10 156 Reasoning composite -.11 -.12 -.15 158 10 BB -.19* .01 -.12 122 BR -.07 -.04 -.07 158 SYL -.29*** -.03 -.21** 156 Reasoning composite -.30*** -.05 -.23** 158 11 BB .20* .19* .25** 122 BR .23** .11 .22** 158 SYL .22** .10 .20* 156 Reasoning composite .32*** .20* .32*** 158 Combined Conflict 00 BB -.36*** -.17* -.34*** 204 BR -.09 -.08 -.11 255 SYL -.30*** -.26*** -.36*** 256 Reasoning composite -.35*** -.27*** -.39*** 258
Table 4 (Continued)
Study Items Direction Task Raven CRT Composite df 01 BB .28*** .08 .23*** 204 BR -.01 -.05 -.04 255 SYL .09 .08 .11 256 Reasoning composite .14* .06 .13* 258 10 BB -.10 -.10 -.13 204 BR -.09 -.02 -.07 255 SYL -.09 -.02 -.07 256 Reasoning composite -.13* -.08 -.14* 258 11 BB .36*** .20** .37*** 204 BR .13* .11 .15* 255 SYL .29*** .23*** .33*** 256 Reasoning composite .37*** .29*** .42*** 258 Note. BB = bat-and-ball; BR = base rate; SYL = syllogism.a There was no 10 trial for
the bat-and-ball task. *p < .05; **p < .01; ***p < .001
Study 2
Study 1 showed that cognitive capacity primarily predicted the accuracy of intuitive rather than deliberate correction. This lends credence to the smart intuitor hypothesis and suggests that people higher in cognitive capacity reason more accurately because they are especially good at generating correct intuitive responses rather than being good at deliberately overriding erroneous intuitions per se. The main goal of Study 2 was to conduct a second study to test the robustness of our findings. In addition, we also included extra “neutral” items (Frey, Johnson, & De Neys, 2018) to validate the smart intuitor hypothesis further.
Recall that classic conflict items are designed such that they cue an intuitive “heuris-tic” response that conflicts with the correct response. In control no-conflict items the
“heuristic” response is also correct. Neutral items are designed such that they do not cue a “heuristic” response (e.g., “All X are Y. Z is X. Z is Y”). Hence, in contrast with conflict and no-conflict problems heuristic cues cannot bias or help you. Solving them requires simply an application of the basic logico-mathematical principles underlying each task. These items are traditionally used to track people’s knowledge of the underlying principles or “mindware” (Stanovich, 2011). When people are allowed to deliberate, reasoners have little trouble solving them (De Neys & Glumicic, 2008; De Neys, Vartanian, & Goel, 2008; Frey & De Neys, 2017; Frey, Johnson, & De Neys, 2018). However, in the present study we presented neutral items under two-response conditions. Given that neutral problems require the application of the same (or closely related) principles or operations as conflict items, we expected that people who have accurate intuitions when solving the conflict problems should also manage to solve the neutral problems without deliberation. Hence, under the smart intuitor hypothesis, we expected that the tendency to give correct in-tuitive responses in conflict and neutral problems would be correlated and that both of these would be associated with cognitive capacity.
3
Methods
3.1
Participants
We tested 160 participants (119 female, Mean age = 20.3 years, SD = 3.5 years), all registered in a psychology course offered at the University of Saskatchewan and recruited through the Psychology Department Participant Pool. They received 2 bonus marks as compensation towards their overall grade in their participating Psychology course. The majority (149) reported high school as their highest level of education, while 10 had a Bachelor degree degree, and 1 didn’t report their highest educational level. The sample size allowed us to detect small-to-medium size correlations (.22) with power of .80.
3.2
Material
Material was the same as in the first study, with the addition of four neutral items at the end of each of the reasoning tasks. Neutral items were based on the work of Frey & De Neys (2017). Below are examples and rationales for each reasoning task (see
Supplementary material for a full list):
Bat-and-ball. In neutral problems, participants were presented with simple addition and multiplication operations expressed in a verbal manner.
In a town, there are Pepsi drinkers and Coke drinkers.
There are 30 Pepsi drinkers and 10 times as many Coke drinkers.
How many Coke and Pepsi drinkers are there in total? (600/530/110/330)
Syllogisms. Neutral items used the same logical structures as in the the conflict and no-conflict items with abstract, not belief-laden content.
All F are H All Y are F All Y are H
Does the conclusion follow logically? (Yes/No)
Base rate. The description of each neutral problem cued an association that applied equally to both groups.
This study contains saxophone players and trumpet players. Person ’R’ is musical.
There are 995 saxophone players and 5 trumpet players.
Is Person ’R’ more likely to be: (a saxophone player/a trumpet player)
3.3
Procedure
The overall experiment followed the same procedure as in our first study. The four neu-tral items for each task were presented in a random order after the following explanation:
You completed 8 out of the total 12 problems of this task. The remaining 4 problems have a similar structure but slightly different content.
Please stay focused.
Click next when you’re ready to start. 28
Neutral items were always presented after all conflict and no-conflict items so as to avoid interference effects (e.g., possible priming effects of neutral items on conflict prob-lems). The same two-response procedure as with the other items was adopted. We also computed a similar neutral accuracy and direction-of-change composite measure by taking the average of the z-scores on each individual task.
3.4
Exclusion criteria
Missed deadline and load task failure. As in study 1, we discarded trials where par-ticipants failed to provide a response before the deadline or failed the load memorization task. For bat-and-ball items, participants missed the deadline on 193 trials and further failed the load task on 185 trials, leading to 1542 remaining trials out of 1920 (80%). On average each participant contributed 3.3 (SD = 0.8) standard problem trials, 3.6 (SD = 0.7) control no-conflict trials and 2.8 (SD = 1) neutral trials. For syllogisms, participants missed the deadline on 65 trials and further failed the load task on 234 trials, leading to 1621 remaining trials out of 1920 (84%). On average each participant contributed 3.2 (SD = 0.9) standard problem trials, 3.4 (SD = 0.8) control no-conflict trials and 3.3 (SD = 0.8) neutral trials. For the base-rate neglect task, participants missed the deadline on 42 trials and further failed the load task on 205 trials, leading to 1673 remaining trials out of 1920 (87%). On average each participant contributed 3.5 (SD = 0.7) standard problem trials, 3.6 (SD = 0.8) control no-conflict trials, and 3.5 (SD = 0.8) neutral trials.
Bat-and-ball familiarity. The original bat-and-ball problem had been both recognized and correctly solved by 32 participants (out of 160) at the end of the experiment. Con-sistent with our first study, we discarded their 323 remaining bat-and-ball trials (61 of their bat-and-ball trials were already excluded because of missed deadline and load task failure).
3.5
Composite measures
As in Study 1, for the reasoning performance and cognitive capacity correlation analyses we again computed a composite index of cognitive capacity by averaging the z-scores on each of the individual cognitive capacity tests (i.e., Raven and CRT-2). Likewise, for reasoning performance we created a composite index by averaging the z-scores on each of
the individual reasoning tasks (i.e., syllogisms, base-rate, and bat-and-ball). We calculated a separate reasoning performance composite for initial accuracy, final accuracy, and each direction of change category (see further).
4
Results and discussion
4.1
Reasoning performances
Accuracy. As Table 1 shows, consistent with our first study, participants were predom-inantly biased on conflict problems, as indicated by the overall low accuracy both at the initial and final response stages (average initial accuracy: M = 36.6, SD = 25.6; average final accuracy: M = 43.2, SD = 30.1). As expected, no-conflict accuracy was much higher (average initial accuracy: M = 88.2, SD = 12.2; average final accuracy: M = 92.2, SD = 8.9).
Accuracy on neutral items was in-between conflict and no-conflict levels (average initial accuracy: M = 70.5, SD = 19.1; average final accuracy: M = 82.6, SD = 15.7).
Direction of change. The direction of change analysis supported our previous findings: the majority of conflict trials were 00 (53.9% across all tasks), which mirrored the overall low conflict accuracy for both initial and final responses, followed by 11 (31.9%), 01 (10.4%) and 10 (3.8%) trials. As indicated by Table 2, there were always more 11 than 01 trials on each individual task, consistent with our first study.
For neutral items, the majority of trials consistently belonged to the 11 category (67% for all tasks), followed by 01 (15.8%), 00 (12.9%) and 10 (4.3%). This indicates that par-ticipants were typically able to solve the neutral problems correctly without deliberation.
4.2
Cognitive capacity correlation
Cognitive capacity scores. On average, participants scored 4.7 (SD = 2.5) on the Raven task and 1.9 (SD = 1.1) on the CRT-2. Performance on each task was correlated, r (158) = .26, p < .001.
Conflict items. For consistency with the first study, we first report correlations regard-ing conflict items.
Accuracy correlations. Supporting our previous findings, conflict accuracy at the composite level was correlated with cognitive capacity at the initial response stage, r (158) = .32, p < .001, as well as the final response stage, r (158) = .44, p < .001. Higher cognitive capacity led to more accurate responses in general. Table 3 shows that individual tasks and measures generally followed the same trend.
Direction of change correlations. Consistent with Study 1, at the composite level, cognitive capacity was negatively correlated with the probability to generate a 00 trial, r (158) = -.39, p < .001.Further in line with Study 1, cognitive capacity was positively correlated with the probability to generate 01 trials, r (158) = .23, p = .003, but even more so with 11 trials, r (158) = .39, p < .001. However,the difference between correlation coefficients did not reach significance, t (157) = -1.594, p = .113. The 10 trials showed a negative correlation with cognitive capacity, r(158) = -.19, p = .014. As Table 4 indicates, individual tasks and measures generally showed the same trends as the composite measures with the possible exception of the base-rate task. Figure 1 again illustrates the trends graphically. As in Study 1, the decrease in 00 responses with increasing cognitive capacity is specifically accompanied by an increase in 11 rather than 01 responses.
Combined Study 1 and 2 analysis. Since we had two studies with a virtually identical design, we also combined the conflict data from Study 1 and 2 to give us the most general and powerful test. For accuracy and direction of change, Table 1 and Table 2 illustrate that the combined data followed the same trends as each individual study. The cognitive capacity correlations in Table 3 and 4 point to the same conclusions. With respect to the critical direction-of-change correlations, the combined composite analysis indicated that the correlation between cognitive capacity and the probability of generating a 11 response reached r (258) = .42, p < .001, whereas the correlation for 01 trials was r (258) = .13, p = .044. The difference between those correlations was significant, t (257) = -3.51, p < .001.
Taken together, these results confirm our findings from the individual studies and sug-gest that cognitive capacity contributes more to intuitive rather than deliberate thinking when solving conflict problems. With respect to the capacity correlations we had no strong interest in no-conflict problems because these problems are designed such that intuitive thinking cues correct responses. Consequently, as we observed in the present study,
accu-racy is typically near ceiling. For completeness, we do note that the combined analysis on the Study 1 and 2 data showed that there was a significant positive association between cognitive capacity and 11 no-conflict responses, r (258) = .18, p = .005. However, the association was small and was not robustly observed on the individual tasks and capacity measures in the two studies (see Supplementary Table S6). Although this finding should be interpreted with caution, it might indicate that participants lowest in cognitive capac-ity show a somewhat distorted performance because of the general task constraints of the two-response paradigm. What is critical in this respect is that the correlations between cognitive capacity and generation of 11 responses on conflict (and neutral, see below) problems were fare more pronounced and robust.6
Neutral items.
Accuracy correlations. As can be seen from Table 3, at the composite level cog-nitive capacity tended to correlate with both final, r (158) = .31, p < .001, and initial neutral accuracy, r (158) = .26, p < .001. At the individual task level, this pattern was clear for the individual base-rate and bat-and-ball tasks but less so for the syllogisms.
Direction of change correlations. Critically, as Table 4 indicates, at the compos-ite level we observed that cognitive capacity was positively correlated with the probability to generate a neutral 11 trial, r (158) = .32, p < .001. Cognitive capacity was not signif-icantly associated with the probability to generate a neutral 01 response, r (158) = -.15, p = .059. This pattern was clear for each of the individual tasks. As expected, there was also a significant correlation between the overall 11 response probability on neutral and conflict items, r (158) = .44, p < .001. This pattern was clear for each of the individual tasks (bat-and-ball: r (122) = .18, p = .046; base-rate: r (158) = .44, p < .001; syllogisms: r (155) = .27, p < .001). Given that neutral problems require the application of similar logico-mathematical operations as conflict items, these results corroborate the claim that people higher in cognitive capacity do not need to deliberate to apply these.
6To illustrate, the cognitive capacity correlation in the combined analysis reached .18 for no-conflict
11 trials whereas it reached .42 for the conflict trials. The difference between these correlation coefficients was significant, t = -3.21, p < .001.
General discussion
In this study we contrasted the predictions of two competing views on the nature of the association between cognitive capacity and reasoning accuracy: Do people higher in cognitive capacity reason more accurately because they are more likely to correct an initially generated erroneous intuition after deliberation (the smart deliberator view)? Or are people higher in cognitive capacity simply more likely to have accurate intuitions from the start (the smart intuitor view). We adopted a two-response paradigm that allowed us to track how reasoners changed or didn’t change their initial answer after deliberation. Results consistently indicated that although cognitive capacity was associated with the deliberate correction tendency, it was more predictive of correct intuitive responding. This lends credence to the smart intuitor view. Smarter people do not necessarily reason more accurately because they are better at deliberately correcting erroneous intuitions but because they intuit better.
These findings force us to rethink the nature of sound reasoning and the role of cog-nitive capacity in reasoning. This has critical implications for the dual process field. We noted that the smart deliberator view plays a central role in traditional dual process models (Evans, 2008; Evans & Stanovich, 2013; Kahneman, 2011; Sloman, 1996). A key assumption of these models is that avoiding biased responding and reasoning in line with elementary logico-mathematical principles in classic reasoning tasks requires switching from intuitive to cognitively demanding, deliberate reasoning. The association between reasoning accuracy (or bias susceptibility) and cognitive capacity has been taken as prima facie evidence for this characterization (e.g., De Neys, 2006a, 2006b; Evans & Stanovich, 2013; Kahneman, 2011): The more resources you have, the more likely that the demanding deliberate correction will be successful. The smart intuitor results argue directly against this characterization. Avoiding biased responding is driven more by having accurate in-tuitions than by deliberate correction.
Interestingly, the smart intuitor findings do fit with more recent advances in dual process theorizing. In recent—sometimes referred to as “hybrid”—dual process models, the view of the intuitive reasoning system is being upgraded (e.g., Bago & De Neys, 2017, De Neys, 2017, Handley, Newstead, & Trippas, 2011, Pennycook, Fugelsang, & Koehler, 2015, Thompson et al., 2018; for reviews see De Neys, 2017, De Neys & Pennycook, 2019). Put simply, these models assume that the response that is traditionally believed
to require demanding deliberation can also be cued intuitively. Hence, under this view, the elementary logico-mathematical principles and operations that are evoked in classic reasoning tasks can also be processed intuitively. The basic idea is that people would generate different types of intuitions when faced with a reasoning problem. One might be the classic “heuristic” intuition based on stereotypical associations and background beliefs. A second “logical” intuition would be based on knowledge of elementary logico-mathematical principles. Repeated exposure and practice with these elementary principles (e.g., through schooling, education, and/or daily life experiences) would have allowed adult reasoners to practice the operations to automation (De Neys, 2012; De Neys & Pennycook, 2019). Consequently, the necessary “mindware” (Stanovich, 2011) will be intuitively activated and applied when faced with a reasoning problem. The strength of the resulting logical intuition (or put differently, the degree of mindware automatization, Stanovich, 2018) would be a key determinant of reasoning performance (Bago & De Neys, 2017; De Neys & Pennycook, 2019; Pennycook, Fugelsang, & Koehler, 2015). The stronger the logical intuition (i.e., the more the operations have been automatized), the more likely that the logical intuition will dominate the competing heuristic one, and that the correct response can be generated intuitively without further deliberation. In the light of this framework, the present findings suggest that people higher in cognitive capacity are more likely to have dominant logical intuitions (Thompson et al., 2018). As Stanovich (2018) might put it, their logical “mindware” has been more automatized and is therefore better instantiated than that of others.
In addition to the dual process implications, the present findings also force us to revise popular beliefs about what cognitive capacity tests measure. Our pattern of results was very similar for the two specific cognitive capacity tests we adopted–Raven matrices and the Cognitive Reflection Test (CRT). Especially the CRT has been proven to be a potent predictor of performance in a wide range of tasks (e.g., Bialek & Pennycook, 2017; Penny-cook, 2017; Toplak, West, & Stanovich, 2014). The predictive power is believed to result from the fact that it captures both the ability and disposition to engage in deliberation to overcome readily available but incorrect intuitive responses (Toplak, West, & Stanovich, 2011). It is therefore widely conceived to be a prime measure of people’s cognitive miser-liness: The tendency to refrain from deliberation and stick to default intuitive responses (Frederick, 2005; Kahneman, 2011; Toplak, West, & Stanovich, 2011, 2014). The current results force us to at least partly reconsider this popular characterization. Low
cies on the CRT might result from a failure to engage deliberate processing. That is, the smart intuitor findings do not deny that biased reasoners might benefit from engaging in deliberation. Hence, people might score low on the CRT because they are indeed cogni-tive misers. However, our results take issue with the complement of this conjecture; the idea that people higher in cognitive capacity score well on the CRT because they are “cognitive spenders”. Scoring well on the CRT does not necessarily reflect the capacity or disposition to engage in demanding deliberation and think hard. It rather seems to measure the capacity to reason accurately without having to think hard (Peters, 2012; Sinayev & Peters, 2015). Within the dual process framework we discussed above, one can argue that high CRT scores primarily reflect the degree to which the necessary mindware has been automatized (Stanovich, 2018).
Our current findings also fit well with the work of Reyna and colleagues (e.g., Reyna, 2012; Reyna & Brainerd, 2011) who were one of the earliest proponents of a “Smart Intu-itor” view. Their fuzzy-trace theory has long put intuitive processing at the developmental apex of cognitive functioning (Reyna, 2004). They have argued that this is mediated by a switch from more verbatim to more intuitive gist-based representations (e.g., Reyna et al., 2017, for review). Although our tow-response findings are agnostic about the un-derlying representations, they clearly lend credence to Reyna et al.’s central claim about the importance of sound intuiting in human reasoning.
We believe that the present results may have far stretching implications for the rea-soning and decision-making field. It is therefore also important to discuss a number of possible misconceptions and qualifications to avoid confusion about what exactly the re-sults show (and do not show). First, it should be clear that our findings do not argue against the role of deliberation per se. We focused on one specific hypothesized function of deliberation. The results indicate that smarter reasoners do not engage in deliberation to correct their initial intuition. However, people higher in cognitive capacity might engage in deliberation for other reasons. For example, after reasoners have arrived at an intuitive correct response, they might engage in deliberate processing to come up with an explicit justification (e.g., Bago & De Neys, 2019). Although such justification (or rationalization, if one wishes) might not alter their response, it might be important for other reasons (Cushman, 2019; De Neys & Pennycook, 2019; Evans, 2019; Mercier & Sperber, 2017). Hence, it should be stressed that our findings do not imply that people higher in cognitive capacity are not more likely to engage in deliberation than people lower in cognitive
ca-pacity. Our critique focuses on the nature of this deliberate processing: the current result should make it clear that its core function does not lie in a correction process.
Second, our results do also not entail that people never correct their intuition or that correction is completely independent of cognitive capacity. We always observed corrective (i.e., “01 ”) instances and these were also associated with cognitive capacity. This fits with the observation that burdening cognitive resources has often been shown to decrease correct response rates on classic reasoning tasks (e.g., De Neys, 2006a, 2006b). The point is that the corrective association was weak and that cognitive capacity was more predictive of the accuracy of intuitive responding. Hence, the bottom line is that the smart deliberator view has given too much weight to the deliberate correction process and underestimated the role and potential of intuition.
Third, our results show that people higher in cognitive capacity are more likely to have accurate intuitions. However, this does not imply that people lower in cognitive capacity cannot reason correctly or cannot have correct intuitions. Indeed, as Figure 1 indicated, even for those lowest in cognitive capacity we observed some correct intuitive responding. Moreover, although correct responding was overall rarer among lower capacity reasoners, whenever it did occur it was typically more likely to result from correct intuiting than from corrective deliberation (i.e., 11 responses were more prevalent than 01 responses), just as it was for higher capacity reasoners. This suggests that having correct intuitions is not necessarily a fringe phenomenon that is only observed for a small subset of highly gifted reasoners.
One possible counterargument against the above point is that correct intuitive respond-ing among people lower in cognitive capacity might have simply resulted from guessrespond-ing. Indeed, our deadline and load task demands are challenging. This might have prevented some participants from simply reading the problems and forced them to respond randomly. However, our no-conflict control items argue against such a general guessing confound. Overall, initial response accuracy on no-conflict trials was consistently very high in our studies (overall M = 88.2%, SD = 12.1%) and this was the case even for the group of participants in the bottom quartile of the cognitive capacity distribution (M = 85.5%, SD = 16.8%). If participants had to guess because they could not process the material, they should also have guessed on the no-conflict items and scored much worse. Nevertheless, even though a systematic guessing confound might be unlikely, we cannot exclude that guessing affected performance on some trials. The point we want to make is simply that