HAL Id: hal-02563160
https://hal-univ-rennes1.archives-ouvertes.fr/hal-02563160
Submitted on 5 May 2020
HAL is a multi-disciplinary open access
archive for the deposit and dissemination of sci-entific research documents, whether they are pub-lished or not. The documents may come from teaching and research institutions in France or abroad, or from public or private research centers.
L’archive ouverte pluridisciplinaire HAL, est destinée au dépôt et à la diffusion de documents scientifiques de niveau recherche, publiés ou non, émanant des établissements d’enseignement et de recherche français ou étrangers, des laboratoires publics ou privés.
quantification in glioma
Antoine Girard, Hervé Saint-Jalmes, Nibras Chaboub, Pierre-Jean Le Reste,
Alice Metais, Anne Devillers, Florence Le Jeune, Xavier Palard-Novello
To cite this version:
Antoine Girard, Hervé Saint-Jalmes, Nibras Chaboub, Pierre-Jean Le Reste, Alice Metais, et al.. Optimization of time frame binning for FDOPA uptake quantification in glioma. PLoS ONE, Public Library of Science, 2020, 15 (4), pp.e0232141. �10.1371/journal.pone.0232141�. �hal-02563160�
RESEARCH ARTICLE
Optimization of time frame binning for
FDOPA uptake quantification in glioma
Antoine Girard1, Herve´ Saint-Jalmes2, Nibras Chaboub2, Pierre-Jean Le Reste3,Alice Metais4, Anne Devillers1, Florence Le Jeune5, Xavier Palard-NovelloID2*
1 Department of Nuclear Medicine, Centre Eugène Marquis, Rennes, France, 2 Department of Nuclear Medicine, Univ Rennes, CLCC Eugène Marquis, Inserm, LTSI – UMR 1099 research unit, Rennes, France,
3 Department of Neurosurgery, CHU Rennes, Rennes, France, 4 Department of Pathology, CHU Rennes,
Rennes, France, 5 Univ Rennes, Department of Nuclear Medicine, CLCC Eugène Marquis, “Behavior and Basal Ganglia” research unit, France
Abstract
Introduction
3,4-dihydroxy-6-[18F]fluoro-L-phenylalanine (FDOPA) uptake quantification in glioma assessment can be distorted using a non-optimal time frame binning of time-activity curves (TAC). Under-sampling or over-sampling dynamic PET images induces significant varia-tions on kinetic parameters quantification. We aimed to optimize temporal time frame bin-ning for dynamic FDOPA PET imaging.
Methods
Fourteen patients with 33 tumoral TAC with biopsy-proven gliomas were analysed. The mean SUVmax tumor-to-brain ratio (TBRmax) were compared at 20 min and 35 min post-injection (p.i). Five different time frame samplings within 20 min were compared: 11x10sec-6x15sec-5x20sec-3x300sec; 8x15sec– 2x30sec– 2x60sec– 3x300sec; 6x20sec– 8x60sec– 2x300sec; 10x30sec– 3x300sec and 4x45sec– 3x90sec– 5x150sec. The reversible single-tissue compartment model with blood volume parameter (VB) was selected using the Akaike information criterion. K1 values extracted from 1024 noisy simulated TAC using Monte Carlo method from the 5 different time samplings were compared to a target K1 value as the objective, which is the average of the K1 values extracted from the 33 lesions using an imag-ing-derived input function for each patient.
Results
The mean TBRmax was significantly higher at 20 min p.i. than at 35 min p.i (respectively 1.4 +/- 0.8 and 1.2 +/- 0.6; p<0.001). The target K1 value was 0.161 mL/ccm/min. The 8x15sec– 2x30sec– 2x60sec– 3x300sec time sampling was the optimal time frame binning. K1 values extracted using this optimal time frame binning were significantly different with K1 values extracted from the other time frame samplings, except with K1 values obtained using the 11x10sec– 6x15sec –5x20sec-3x300sec time frame binning.
a1111111111 a1111111111 a1111111111 a1111111111 a1111111111 OPEN ACCESS
Citation: Girard A, Saint-Jalmes H, Chaboub N, Le
Reste P-J, Metais A, Devillers A, et al. (2020) Optimization of time frame binning for FDOPA uptake quantification in glioma. PLoS ONE 15(4): e0232141.https://doi.org/10.1371/journal. pone.0232141
Editor: Marta M. Alonso, Universidad de Navarra,
SPAIN
Received: January 9, 2020 Accepted: April 7, 2020 Published: April 22, 2020
Copyright:© 2020 Girard et al. This is an open access article distributed under the terms of the
Creative Commons Attribution License, which permits unrestricted use, distribution, and reproduction in any medium, provided the original author and source are credited.
Data Availability Statement: All relevant data are
within the manuscript.
Funding: The authors received no specific funding
for this work.
Competing interests: The authors have declared
Conclusions
This optimal sampling schedule design (8x15sec– 2x30sec– 2x60sec– 3x300sec) could be used to minimize bias in quantification of FDOPA uptake in glioma using kinetic analysis.
Introduction
Gliomas are the second most common primary brain tumor in adults [1]. 3,4-dihydroxy-6-[18F]fluoro-L-phenylalanine (FDOPA) positron emission tomography / computed tomogra-phy (PET/CT) is being increasingly used for non-invasive glioma assessment [2–4]. FDOPA is an amino-acid analogue and is used to assess primary brain tumor cell growth [5]. FDOPA PET/CT offers the advantage of detecting both high- and low-grade glioma because FDOPA uptake does not depend on a blood–brain barrier disruption [6,7]. As recently recommended in the EANM/EANO/RANO practice guidelines/SNMMI procedure standards for imaging of gliomas using PET, the imaging protocol for FDOPA PET/CT consists of a 10–20 min static image acquisition obtained 10–30 min after injection. For routine clinical interpretation, semi-quantitative measures of tumor activity uptake values are calculated [8]. However, kinetic parameters obtained through dynamic acquisition might provide further details about tumor characterization [5,9]. For instance, information regarding tumor aggressiveness from FDOPA PET/CT could have utility in guiding biopsy [10], and potentially improve patient management with dose-escalation using intensity-modulated radiotherapy in patients with gli-oma [10,11]. Kinetic analysis mandates time frame binning chosen before reconstruction of dynamic PET images. To the best of our knowledge, no recommendations are available regard-ing FDOPA PET/CT time frame binnregard-ing for kinetic analysis in glioma. Up until now, different time frame samplings were used in publications studying glioma uptake quantification using full kinetic analysis for [5,12–14]. However, we recently showed that a slight difference of tem-poral sampling induces bias in 18F-Choline uptake quantification in prostate cancer [15]. In this latter study, initial time frame longer than 5 s but also faster than 5 s were not optimal for quantification. The aim of this study was to define an optimal time frame binning protocol for dynamic FDOPA PET imaging.
Methods
Patients
Sixteen patients with diffuse glioma were prospectively included in the “GLIROPA” clinical trial (NCT03525080). All gliomas were newly diagnosed and selected for resective surgery. Fourteen patients were analysed because the dynamic acquisition was unsuccessful for 2 patients. There were 9 men and 5 women, with a median age of 40 years (range 23–66). Each patient gave written informed consent prior to inclusion. This study has been performed in accordance with the Declaration of Helsinki, approved by an independent national research ethics committee (Comite´ de Protection des Personnes Ile de France 1 2018-ND27-cat.2).
PET/CT imaging protocol
The patients were required to fast at least 4 h before undergoing the imaging protocol. Each patient underwent a CT scan without contrast agent injection, followed by a 40-min PET acquisition using list-mode acquisition with a single field of view centered on the brain (Sie-mens Biograph mCT, Knoxville, TN). At the start of the PET scan, 2 MBq/kg of FDOPA was
administered intravenously, without carbidopa premedication. PET data were reconstructed using Time of Flight (TOF) 3D ordered-subsets expectation maximization iterative algorithm (8 iterations, 21 subsets) with corrections (attenuation, dead time, randoms, scatter and decay) and 4 mm kernel convolution filter. The Point Spread Function reconstruction method was not used as recently recommended in the EANM/EANO/RANO practice guidelines/SNMMI procedure standards for imaging of gliomas using PET [8]. Voxel size was 1x1x2 mm3. For each patient, in order to determine the FDOPA bolus arrival time, PET data were recon-structed into 20 frames of 3 seconds (lower bound of time bin reconstruction available on the system).
Timing of acquisition
A 20-min and 35-min static images from the bolus arrival time were reconstructed. A tumor and a contralateral cortex reference volume-of-interest (VOI) of 1 cm3were generated by a nuclear medicine physician with the Syngo.via software (Siemens) on the 20-min static recon-struction and projected onto the 35-min static reconrecon-struction. Tumor VOIs were drawn based on the MRI-guided brain biopsies (1 cm3). The MRI was performed within a median time of 3 days after FDOPA PET/CT and surgery within a median time of 15 days after FDOPA PET/ CT. One, two or three biopsies were performed for each patient during surgery. A freehand VOI was drawn using a registration between the MRI used for the MRI-guided brain biopsies and the FDOPA PET/CT with the Syngo.via software. For each voxel, the standardized uptake value (SUV) was calculated calculated using the following formula: SUV = tissue radioactivity concentration /[injected dose /patient weight]. The mean TBRmax(tumor SUVmax
/contralat-eral cortex reference SUVmax) were compared at 20 min and 35 min post-injection (p.i) using
the Wilcoxon signed-rank test for paired samples (IBM SPSS Statistics 25 (SPSS Ltd.). Two-sided values of p < 0.05 were considered significant.
Time sampling
Five different time samplings with a total study duration of 20 minutes were defined for com-parison. Two time samplings were based on previous studies: 8x15sec- 2x30sec - 2x60sec– 3x300sec [5,12] and 6x20sec- 8x60sec- 2x300sec [13]. In addition, 3 time samplings with dif-ferent initial frame durations were chosen: 11x10sec- 6x15sec- 5x20sec- 3x300sec; 10x30sec-3x300sec and 4x45sec- 3x90sec- 5x100sec. 70 reconstructions were performed using list-mode acquisitions (14 patients multiplied by 5 different time samplings from the bolus arrival time (Fig 1)). Tumoral and arterial time-activity curves (TAC) were generated. The tumoral VOI of 1 cm3drawn on the 20-min static reconstruction was projected onto each frame of the 5 differ-ent time samplings. On the early PET image with the maximum blood pool activity, a VOI was manually drawn within the middle cerebral artery to estimate an imaging-derived input func-tion (IDIF). For each patient, FDOPA plasma input funcfunc-tion was obtained after correcfunc-tions for metabolites and hematocrit. IDIF was fitted to the measured fractions of metabolites taken from the publication of Huang et al. [16].
Kinetic model selection
In pharmacokinetic modeling, tracer kinetics are assumed to be separable into compartments with a flux of the tracer from one compartment to another. The flux between compartments can be physical (transport across a membrane) or notional (between bound and unbound receptor or chemical transformation in the same physical space). In the current study, the reversible single-tissue compartment model (1T2k+VB) (with K1 = Rate constant from blood to tissue, k2 = rate constant from the tissue compartment to the arterial blood, distribution
volume (DV) = K1/k2 and VB = blood volume parameter), the irreversible (2T3k+VB) and reversible (2T4k+VB) two-tissue compartment model (adding a tissue compartment repre-senting the FDOPA pool of the tumor, with k3 = inward and k4 = outward) were tested (PMOD software version 3.8; PMOD Technologies; Zu¨rich, Switzerland). These three com-partmental models are the most commonly used for full kinetic analysis of PET tracers in oncology. The model providing the best fits (Levenberg-Marquadt algorithm) to the tumoral TAC with the 5 different time samplings was selected on the basis of the Akaike information criterion (AIC) for small sample sizes [17].
Optimal time sampling
Monte Carlo simulations were performed in Mathematica (Wolfram Research, Inc., Mathema-tica, Version 11.1, Champaign, IL (2017)) in order to determine the optimal time binning between the 5 time samplings tested. The mean of the metabolite-corrected arterial TAC from the fastest initial temporal sampling (11x10sec-6x15sec-5x20sec-3x300sec) extracted from the patients with interpolation to 1-second frames was used for the modeled arterial TAC (CIDIF(t)). This modeled arterial TAC was applied for every investigated time sampling. The
modeled tumoral TAC C(t) was obtained as follows: CðtÞ ¼ VB CIDIFðtÞ þ ð1 VBÞK1 e
k2t�C IDIFðtÞ:
K1, K2 and VB were average values extracted for the 33 lesions using the 5 different time sam-plings according to the selected model.
Fig 1. List-mode PET data were recorded during 2400 seconds (A). The first seconds without any count were
excluded and only 20 minutes from the FDOPA bolus arrival time were selected (B). Then, PET data were reconstructed into the 5 different time samplings (C).
For each time sampling, 1024 realizations of independent distributed Poisson noise (Added noise) were added to the modeled TAC as follows:
Added Noise ¼ cðRandomInteger½PoissonDistribution½CðtÞ�� CðtÞÞ=SqrtðdtÞ; where c is the scaling factor and dt is the frame duration.
Each realization was fitted to the model providing an estimation of the kinetic parameters. The mean and standard deviation of the estimated K1 values were computed from all the reali-zations and compared to a target K1 value as the objective, which is the average of the K1 val-ues extracted from the 33 lesions.
Clinical validation
Comparison of all of the K1 values extracted from the optimal time sampling with K1 values extracted from the other time samplings was performed using the nonparametric Wilcoxon signed-rank test for paired samples [18] because the data was not normally distributed. Two-sided values of False Discovery Rate adjusted p < 0.05 were considered significant. Statistical analysis was performed using IBM SPSS Statistics 25 (SPSS Ltd.).
Correlations between the different imaging parameters
IDIF based Logan graphical analysis was also performed. The distribution volume (Vt) was calculated as the slope of the linear part of the Logan analysis. The relationship of the different imaging parameters extracted using the optimal time sampling was investigated using Spear-man’s correlation coefficient (r). A p value less than 0.05 was considered significant.
Results
Patients
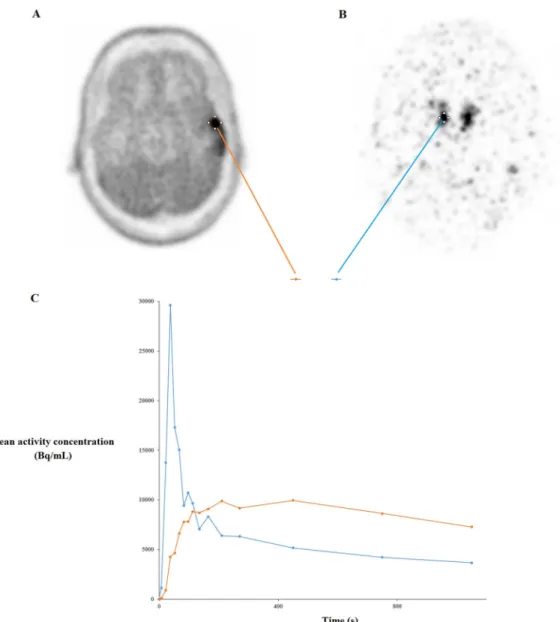
Thirty-three biopsies were done. The distribution of the fourteen cases on the basis of the 2016 World Health Organization histopathologic classification was as follows: 6 patients with astro-cytoma, 2 patients with oligodendroglioma, and 6 patients with glioblastoma. Typical TAC in a 50 years old man are shown inFig 2.
Timing of acquisition
The mean TBRmaxwas significantly higher at 20 min p.i. than at 35 min p.i (respectively 1.4
+/- 0.8 and 1.2 +/- 0.6; p <0.001) (Fig 3).
Kinetic model selection
AIC results indicated that the 1T2k+VB model produced the best fits (preferred model in 102 (62%) of the 165 tumoral TAC from all of the time samplings). The mean K1 value according to the 1T2k+VB model for all of the lesions from all of the time samplings was 0.161 mL/ccm/ min. The mean k2 was 0.087 min-1. The mean VB was 8.4%.
Optimal time sampling
The average K1 value of the 1024 simulations obtained by the 8x15sec– 2x30sec– 2x60sec– 3x300sec time sampling was the closest value to the target K1 value (0.161 mL/ccm/min) (Table 1). The K1 values extracted from the simulated TAC with the latter time sampling were significantly different with the K1 values extracted using the other time samplings, except with the 11x10sec– 6x15sec–5x20sec– 3x300sec time sampling.
Clinical validation
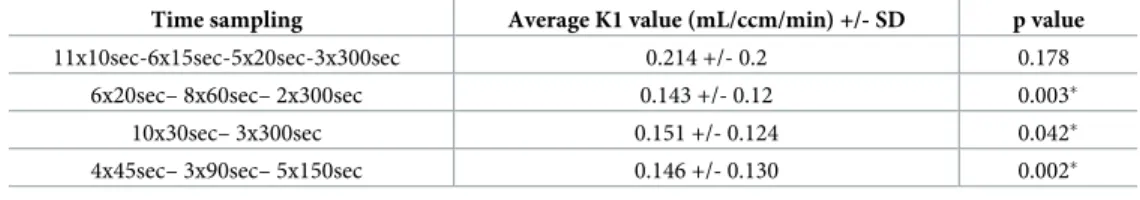
Results showed that the K1 values extracted from the optimal time sampling (8x15sec– 2x30sec– 2x60sec– 3x300sec) for the 33 lesions were significantly different with the K1 values extracted using the other time samplings tested, except for the comparison with the 11x10sec– 6x15sec–5x20sec– 3x300sec time sampling (Table 2).
Correlations between the different parameters
Using the optimal time sampling (8x15sec– 2x30sec– 2x60sec– 3x300sec), the mean DV was 1.68 mL/ccm +/- 0.65 and the mean Vt obtained using the Logan graphical analysis was 1.68 mL/ccm +/- 0.56. Correlation between SUVmax and K1 and between SUVmax and Vt were high (respectively r = 0.88, p < 0.001 and r = 0.77, p < 0.001). All of the correlation coefficients are given inTable 3.
Fig 2. Axial FDOPA PET images show glioma uptake in a 50-year-old man (A) and the injected FDOPA bolus (176 MBq) on the right middle cerebral artery (B) with arterial and glioma time-activity curves (C).
Fig 3. Box plots for TBRmax at 20 min p.i and 35 min p.i.
https://doi.org/10.1371/journal.pone.0232141.g003
Table 1. Comparison of the average K1 values from the 1024 simulations (Monte Carlo) using the 5 different time samplings.
Time sampling Average K1 value (mL/ccm/min-) +/- SD 95% Confidence Interval (mL/ccm/min) Lower bound Upper bound
11x10sec-6x15sec-5x20sec-3x300sec 0.1621 +/- 0.0146 0.1612 0.1630
8x15sec– 2x30sec– 2x60sec– 3x300sec 0.1604 +/- 0.0128 0.1596 0.1612
6x20sec– 8x60sec– 2x300sec 0.1634 +/- 0.0124 0.1627 0.1642
10x30sec– 3x300sec 0.1690 +/- 0.0152 0.1689 0.17
4x45sec– 3x90sec– 5x150sec 0.1745 +/- 0.0131 0.173 0.1753
Discussion
Under-sampling or over-sampling induces significant variations on kinetic parameters quanti-fication [19]. In order to optimize the quantification of dynamic FDOPA uptake, the aim of this study was to define the optimal temporal sampling for FDOPA PET/CT reconstruction protocol in patients with glioma.
Firstly, our results showed that TBRmax was significantly higher at 20 min p.i than at 35 min p.i. Moreover, the TBRmax was always higher at 20 min p.i than at 35 min p.i for all tumors. Several studies have previously explored the evolution of glioma FDOPA uptake over time. Chen et al. showed that the highest tumor FDOPA uptake occurred between 10 min and 30 min after injection [12]. Similarly, in the study published by Schiepers et al., the tumor FDOPA uptake peak activity was reached around 20 min p.i [5]. In two more recent studies, the TACs of tumor FDOPA uptake peaked earlier at 8–10 min p.i [9,13]. However, the EANM/EANO/RANO practice guidelines/SNMMI procedure standards for imaging of gliomas using PET recently recommended a 10–20 min image acquisition performed 10–30 min p.i [8].
Secondly, among 5 different time frame binning protocols, the results of this study show that the 8x15sec– 2x30sec– 2x60sec– 3x300sec time sampling is optimal. Using full quantifica-tion, two studies compared FDOPA influx with tumor grade. On the one hand, Schiepers et al. suggested that newly diagnosed high-grade brain tumors had significantly higher K1 values than K1 values extracted from low-grade brain tumors [5]. On the other hand, Kratochwil et al. found no significant difference of K1 values between high-grade and low-grade brain tumors [13]. A possible explanation of these discordant results could be linked to the dynamic temporal sampling protocol. The protocol was different in the two latter studies. The results of our study show that K1 values extracted using full kinetic analysis depend on the time frame binning protocol. The optimization of the temporal resolution during kinetic acquisition not
Table 2. Comparison of the K1 values extracted from the optimal time sampling (8x15sec– 2x30sec– 2x60sec– 3x300sec) and K1 values from the other time samplings for the 33 lesions.
Time sampling Average K1 value (mL/ccm/min) +/- SD p value
11x10sec-6x15sec-5x20sec-3x300sec 0.214 +/- 0.2 0.178
6x20sec– 8x60sec– 2x300sec 0.143 +/- 0.12 0.003�
10x30sec– 3x300sec 0.151 +/- 0.124 0.042�
4x45sec– 3x90sec– 5x150sec 0.146 +/- 0.130 0.002�
�p values <0.05 = statistically significant
https://doi.org/10.1371/journal.pone.0232141.t002
Table 3. Spearman’s rank correlation matrix for the imaging parameters.
K1 k2 DV Vb SUVmax TBRmax Vt K1 1 0.83� 0.65� 0.61� 0.88� 0.90� 0.67� k2 1 0.21 0.48� 0.60� 0.68� 0.29 DV 1 0.55� 0.78� 0.73� 0.87� Vb 1 0.60� 0.63� 0.31 SUVmax 1 0.96� 0.77� TBRmax 1 0.69� Vt 1
�p values <0.05 = statistically significant
only concerns FDOPA but also the quantitative analysis of other PET radiopharmaceuticals [15, 19–20]. We previously demonstrated that a better estimation of18F-Choline uptake quantification is obtained using an initial time frame of 5s in prostate cancer assessment using the same PET system [15], shorter than the optimal initial frame of 15 s for FDOPA quantification in glioma assessment in this study. A lower activity concentration of FDOPA in glioma than activity co centration of18F-Choline in prostate cancer might be the reason. Indeed, emission events rate in PET modality can be described as a Poisson distribution. Poor counting statistics need longer frames. Regarding FDOPA PET/CT dynamic imaging protocol, to the best of our knowledge, no guidelines are available and no previous research has investigated the optimization of the time frame binning. However, list-mode data cannot be stored on a clinical picture archiving and com-munication system. Temporal sampling has to be defined to store the dynamic PET data.
Thirdly, based on the Akaike criterion, the reversible single-tissue compartment with blood volume fraction was the preferred kinetic model to describe FDOPA uptake in glioma. To the best of our knowledge, only two studies evaluated compartment modeling for FDOPA uptake quantification in glioma based on dynamic PET scans [5,9]. Schiepers et al. demonstrated that the error estimates are significantly smaller for the two-tissue compartment model than for the one single-tissue compartment model [5]. In our study, the PET study duration for the kinetic analysis was 20 min whereas it was 75 min in the Schiepers et al study. This difference of dura-tion could explain why the selected compartment model was different between the latter study and our study. Indeed, Kratochwil et al. suggested that K1 was predominant in the FDOPA uptake in the first minutes post-injection [13]. Nioche et al. study results confirmed this find-ing, showing that the FDOPA uptake in glioma extracted using the two-tissue compartment model and the uptake using the single-tissue compartment model were very close with a PET study duration of 45 minutes [9].
Fourthly, this study showed a strong correlation between SUVmax and uptake rate constant as determined either by graphical Logan analysis or pharmacokinetic modeling. A simpler static measure in place of dynamic PET scans for quantifying FDOPA uptake in glioma should be sufficient in clinical practice. However, other studies are needed to confirm these results.
This study has several limitations. First, the number of patients was limited, although the number of samples is relatively large. Second, the input function used for the PET kinetic modeling was not obtained from arterial sampling. However, FDOPA plasma input function was obtained after corrections for metabolites and hematocrit, based on a previous publication data [16]. Recent studies also used an imaging-derived plasma input function for quantifying FDOPA glioma uptake [5,9,12–14]. Third, variations in methodological factors such as FDOPA dose, non-TOF PET system, image reconstruction, post-filtering and tracer kinetic modeling could bias K1 estimates. The 8x15sec– 2x30sec– 2x60sec– 3x300sec temporal sam-pling was found to be optimal with the parameters of a modern PET system. Fourth, only 33 lesions was analysed for the clinical validation. Further studies with larger number of lesions are needed to confirm the results of our study.
Conclusion
This optimal sampling schedule design (8x15sec– 2x30sec– 2x60sec– 3x300sec) could be used to minimize bias in quantification of FDOPA uptake in glioma using kinetic analysis.
Author Contributions
Conceptualization: Xavier Palard-Novello. Formal analysis: Nibras Chaboub, Alice Metais.
Investigation: Antoine Girard, Pierre-Jean Le Reste, Anne Devillers, Florence Le Jeune, Xavier Palard-Novello.
Supervision: Herve´ Saint-Jalmes, Florence Le Jeune.
Writing – original draft: Antoine Girard, Xavier Palard-Novello.
Writing – review & editing: Antoine Girard, Herve´ Saint-Jalmes, Xavier Palard-Novello.
References
1. Weller M, van den Bent M, Tonn JC, Stupp R, Preusser M, Cohen-Jonathan-Moyal E, et al. European Association for Neuro-Oncology (EANO) guideline on the diagnosis and treatment of adult astrocytic and oligodendroglial gliomas. The Lancet Oncology. 2017; 18:e315–e29.https://doi.org/10.1016/ S1470-2045(17)30194-8PMID:28483413
2. Albert NL, Weller M, Suchorska B, Galldiks N, Soffietti R, Kim MM, et al. Response Assessment in Neuro-Oncology working group and European Association for Neuro-Oncology recommendations for the clinical use of PET imaging in gliomas. Neuro-oncology. 2016; 18:1199–208.https://doi.org/10. 1093/neuonc/now058PMID:27106405
3. Langen KJ, Watts C. Neuro-oncology: Amino acid PET for brain tumours—ready for the clinic? Nature reviews Neurology. 2016; 12:375–6.https://doi.org/10.1038/nrneurol.2016.80PMID:27282652
4. Langen KJ, Galldiks N, Hattingen E, Shah NJ. Advances in neuro-oncology imaging. Nature reviews Neurology. 2017; 13:279–89.https://doi.org/10.1038/nrneurol.2017.44PMID:28387340
5. Schiepers C, Chen W, Cloughesy T, Dahlbom M, Huang SC. 18F-FDOPA kinetics in brain tumors. Journal of nuclear medicine: official publication, Society of Nuclear Medicine. 2007; 48:1651–61.
6. Walter F, Cloughesy T, Walter MA, Lai A, Nghiemphu P, Wagle N, et al. Impact of 3,4-dihydroxy-6-18F-fluoro-L-phenylalanine PET/CT on managing patients with brain tumors: the referring physician’s per-spective. Journal of nuclear medicine: official publication, Society of Nuclear Medicine. 2012; 53:393–8.
7. Chen W. Clinical applications of PET in brain tumors. Journal of nuclear medicine: official publication, Society of Nuclear Medicine. 2007; 48:1468–81.
8. Law I, Albert NL, Arbizu J, Boellaard R, Drzezga A, Galldiks N, et al. Joint EANM/EANO/RANO practice guidelines/SNMMI procedure standards for imaging of gliomas using PET with radiolabelled amino acids and [(18)F]FDG: version 1.0. European journal of nuclear medicine and molecular imaging. 2019; 46:540–57.https://doi.org/10.1007/s00259-018-4207-9PMID:30519867
9. Nioche C, Soret M, Gontier E, Lahutte M, Dutertre G, Dulou R, et al. Evaluation of quantitative criteria for glioma grading with static and dynamic 18F-FDopa PET/CT. Clinical nuclear medicine. 2013; 38:81– 7.https://doi.org/10.1097/RLU.0b013e318279fd5aPMID:23334119
10. Pafundi DH, Laack NN, Youland RS, Parney IF, Lowe VJ, Giannini C, et al. Biopsy validation of 18F-DOPA PET and biodistribution in gliomas for neurosurgical planning and radiotherapy target delinea-tion: results of a prospective pilot study. Neuro-oncology. 2013; 15:1058–67.https://doi.org/10.1093/ neuonc/not002PMID:23460322
11. Kosztyla R, Raman S, Moiseenko V, Reinsberg SA, Toyota B, Nichol A. Dose-painted volumetric modu-lated arc therapy of high-grade glioma using 3,4-dihydroxy-6-[(18)F]fluoro-L-phenylalanine positron emission tomography. The British journal of radiology. 2019; 92:20180901.https://doi.org/10.1259/bjr. 20180901PMID:31017449
12. Chen W, Silverman DH, Delaloye S, Czernin J, Kamdar N, Pope W, et al. 18F-FDOPA PET imaging of brain tumors: comparison study with 18F-FDG PET and evaluation of diagnostic accuracy. Journal of nuclear medicine: official publication, Society of Nuclear Medicine. 2006; 47:904–11.
13. Kratochwil C, Combs SE, Leotta K, Afshar-Oromieh A, Rieken S, Debus J, et al. Intra-individual com-parison of 18F-FET and 18F-DOPA in PET imaging of recurrent brain tumors. Neuro-oncology. 2014; 16:434–40.https://doi.org/10.1093/neuonc/not199PMID:24305717
14. Wardak M, Schiepers C, Cloughesy TF, Dahlbom M, Phelps ME, Huang SC. 18F-FLT and 18F-FDOPA PET kinetics in recurrent brain tumors. European journal of nuclear medicine and molecular imaging. 2014; 41:1199–209.https://doi.org/10.1007/s00259-013-2678-2PMID:24604590
15. Palard-Novello X, Blin AL, Le Jeune F, Garin E, Salaun PY, Devillers A, et al. Optimization of temporal sampling for 18F-choline uptake quantification in prostate cancer assessment. EJNMMI research. 2018; 8:49.https://doi.org/10.1186/s13550-018-0410-8PMID:29904817
16. Huang SC, Barrio JR, Yu DC, Chen B, Grafton S, Melega WP, et al. Modelling approach for separating blood time-activity curves in positron emission tomographic studies. Physics in medicine and biology. 1991; 36:749–61.https://doi.org/10.1088/0031-9155/36/6/004PMID:1908103
17. Glatting G, Kletting P, Reske SN, Hohl K, Ring C. Choosing the optimal fit function: comparison of the Akaike information criterion and the F-test. Medical physics. 2007; 34:4285–92.https://doi.org/10.1118/ 1.2794176PMID:18072493
18. Wilcoxon F. Individual comparisons of grouped data by ranking methods. 1946; 36:269. rpebring A, Johansson L, et al. A Monte Carlo study of the dependence of early frame sampling on uncertainty and bias in pharmacokinetic parameters from dynamic PET. Journal of nuclear medicine technology. 2015;43:53–60.
19. Lee BC, Moody JB, Weinberg RL, Corbett JR, Ficaro EP, Murthy VL. Optimization of temporal sampling for (82)rubidium PET myocardial blood flow quantification. Journal of nuclear cardiology: official publica-tion of the American Society of Nuclear Cardiology. 2017; 24:1517–29.
20. Mazoyer BM, Huesman RH, Budinger TF, Knittel BL. Dynamic PET data analysis. Journal of computer assisted tomography. 1986; 10:645–53.https://doi.org/10.1097/00004728-198607000-00020PMID: