HAL Id: hal-03027924
https://hal.laas.fr/hal-03027924
Submitted on 27 Nov 2020
HAL is a multi-disciplinary open access
archive for the deposit and dissemination of
sci-entific research documents, whether they are
pub-lished or not. The documents may come from
teaching and research institutions in France or
abroad, or from public or private research centers.
L’archive ouverte pluridisciplinaire HAL, est
destinée au dépôt et à la diffusion de documents
scientifiques de niveau recherche, publiés ou non,
émanant des établissements d’enseignement et de
recherche français ou étrangers, des laboratoires
publics ou privés.
Guillaume Poiroux, David Dubuc, Mohsen Hosseini, François Artis, Amar
Tamra, Marie Tosolini, Frédéric Pont, Claudie Bosc, Estelle Saland, Frédéric
Lopez, et al.
To cite this version:
Guillaume Poiroux, David Dubuc, Mohsen Hosseini, François Artis, Amar Tamra, et al..
Label-free detection of mitochondrial activity with Microwave Dielectric Spectroscopy Research Article.
International Journal of Biotechnology and Bioengineering, World Academy of Science, Engineering
and Technology, 2020, 6 (5). �hal-03027924�
International Journal of Biotechnology and
Bioengineering
Label-free detection of mitochondrial activity with Microwave Dielectric
Spectroscopy
Research Article
ISSN 2475-3432
Guillaume Poiroux
1,2,3,4, David Dubuc
2,4, Mohsen Hosseini
1,2,3, François Artis
2,4, Amar Tamra
2,4, Marie Tosolini
1,2,3, Frédéric
Pont
1,2,3, Claudie Bosc
1,2,3, Estelle Saland
1,2,3, Frédéric Lopez
1,2,3, Jean-Jacques Fournié
1,2,3, Jean-Emmanuel Sarry
1,2,3, Katia
Grenier
2,4and Mary Poupot
1,2,3 *1
Centre de Recherches en Cancérologie de Toulouse, INSERM UMR1037, 31037 Toulouse, France.
² Université Toulouse III Paul-Sabatier, 31400 Toulouse, France.
³ ERL 5294 CNRS, 31037 Toulouse, France.
⁴ LAAS-CNRS, 31031 Toulouse, France.
Abstract:
Keywords
: Mitochondria, Microwave Dielectric Spectroscopy, Apoptosis, Energetic MetabolismCorresponding author:
Mary PoupotCentre de Recherches en Cancérologie de Toulouse, INSERM UMR1037, 31037 Toulouse, France.
E-mail: mary.poupot@inserm.fr
Copyright:
© 2020 Mary Poupot This is an open access articledistributed under the terms of the Creative Commons Attribution License, which permits unrestricted use, distribution, and reproduction in any medium, provided the original author and source are credited
Received:
July 03, 2020Accepted:
July 10, 2020
Mitochondrial bioenergetics contributes to important biological processes and its dysfunction underlies some diseases, but its assessment requires invasive methods involving intracellular staining and chemical inhibitors. In this study, we introduce microwave dielectric spectroscopy (MWDS) as a new non-invasive and label-free method to detect mitochondrial activity in live cells. We show that under electromagnetic radiation with microwaves (0.4-40 GHz), the dielectric properties of living cells are determined by their mitochondrial activity. MWDS instantly detects the mitochondrial depolarization induced by drugs targeting electron transport chain complexes or during the earliest events of the apoptotic process, from a cell suspension of a single microliter. MWDS also discriminates cancer cells with higher mitochondrial activity, an aspect often related to therapeutic resistance in cancer. Thereby, MWDS represents a highly innovative method for non-invasive detection of mitochondrial activity in live cells, with a broad range of applications in biology and medicine.
Citation:
Mary Poupot(2020), Label-free detection of mitochondrialactivity with Microwave Dielectric Spectroscopy Int J Biotech & Bioeng. 6:5
Introduction
The main biological function of mitochondria is to produce energy required by all biological processes in cells. Dysfunction of mitochondrial oxidative phosphorylation can promote cardiovascular (1) and neurodegenerative (2) diseases, sarcopenia (3) or diabetes (4), amongst others. In cancer also, tumor cells frequently display more mitochondrial respiration and fatty acid β-oxidation than normal cells, these features are characteristic of a high oxidative phosphorylation (OXPHOS) activity (5, 6). Furthermore, mitochondria display an essential role in apoptosis, an active and coordinated process involving activation of caspases and permeabilization of the mitochondrial outer membrane (MOMP) (7). Although essential in medicine and biology, evaluation of mitochondrial activity is generally tedious due to the difficulty to simultaneously assess the multiple parameters required. The latter comprise mitochondrial membrane potential (MMP),
Here, we introduce a new method based on microwaves to detect mitochondrial activity in live cells. Molecules exposed to electromagnetic fields in the microwave (MHz-GHz) frequency range present a relative dielectric constant ε which reflects their polarization. Thus at such frequency ranges, the electrical properties of molecules from water to macromolecular complexes can be measured. For instance, dielectric spectroscopy can detect aminoacids, carbohydrates, proteins, and nucleic acids in aqueous solutions, as well as solutions containing whole cells without any pre-treatment, labeling, fixation and/or permeabilization (8–17). Both slowdown and adsorption of the electric field penetrating the biological matter are detected through the decrease of the real part (
ε
’) and the imaginary part (ε
’’), respectively, of the complex permittivity (14, 18). Cells suspended in liquid buffers of culture media however comprise not only biomolecules but also water molecules. Since relaxation of proteins or electrolytes is ~ three orders of magnitude smaller than that of water molecules, a fitting of the raw dielectric data is required to yield the sample’s permittivity contrast to water (Δε
’, Δε
”). Furthermore, GHz electromagnetic fields penetrate inside cells, and thus detect both intracellular and extracellular water (14, 19–21). The permittivity contrast of a solution of molecules or cell suspension is thus calculated by subtracting to its raw permittivity the dielectric constant of its solvent (12). Thus, the dielectric signal of a cell suspension reflects the contrast between the intracellular and the extracellular media: the higher the Δε
, the higher the contrast (22). The recent integration of microfluidics with on-chip microwave devices and electrical measurement tools has paved the way to the Microwave Dielectric Spectroscopy (MWDS), a new technology for the study of ions, molecules, particles and cells in solution (12, 14, 23–25). Since MWDS detects living, unlabeled and untreated cells in culture medium, here we asked which specific intracellular activity was actually detected by this method. We discovered that MWDS detects the activity of the electron transport chain complexes in mitochondria. This finding enabled us to monitor the mitochondrial depolarization along the earliest events of the apoptotic process, unveiling its biphasic nature. Furthermore, MWDS also allowed us to detect cancer cells with higher mitochondrial activity, an aspect of potential relevance to predict therapeutic resistance in cancer. Thus, MWDS represents the first method for non-invasive detection and monitoring of mitochondrial respiration in live cells.Materials and Methods
Cell lines and reagents
DOHH2, Karpas 422, RL, SUDHL-1, OCI-Ly3, OCI-Ly7 cell lines (ATCC) were grown in RPMI-Glutamax (Lonza, France) / 10% FCS (Thermo Fischer Scientific) / 100 UI/ml Penicillin/Streptomycin (PAA, France). AnnexinV-FITC, AnnexinV-V450, 7-AAD were from BD Biosciences. MitoView-633, NucView-488 (Caspase-3 assay), anti-Active Caspase-8 mAb-PE, cleaved PARP mAb-Alexa488, anti-Cytochrome c mAb-Alexa647 and isotypic controls were from Ozyme. Green-Mitotracker and Deep Red-Mitotracker were from Life Technologies.
zVAD (Bachem), CCCP (abcam), Navitoclax and ABT263 (Selleckchem), Antimycin A, Rotenone, Oligomycin and Rapamycin (Sigma Aldrich).
Cell death treatment
DOHH2 cells (0,5.10⁶ cell/ml) were pre-incubated in culture medium for 1 hour with or without z-VAD (20 μM) before treatment with ABT263 (100 nM) and Rapamycin (100 nM) for different times.
MDWS device and microwave measurements
The device comprise a microfluidic channel and 0.3 thick gold electrodes on a quartz wafer with a co-planar waveguide ((w,s) of (150, 50) μm and 3.1mm length). NLOF 2035 photoresist (Microchemicals GmbH) was spun down to a thickness of 2.5 μm and delimited with standard photolithography as a protective mask during titanium (50 nm thick) and gold evaporations. SU-8 microfluidic walls were fabricated perpendicularly to the microwave waveguide in gold (2 min oxygen plasma at 200W, coating of wafer with SU-8 3050 photoresist (MicroChem) to a thickness of 250 μm and standard photolithography to delimitate the SU-8 layer). The lid was composed of a cured PDMS elastomer (PDMS sylgard 184 kit, Dow Corning Electronic) of 1 mm thick. The lid was assembled to the SU-8 walls by applying an oxygen plasma.
The microwave setup comprised a Vector Network analyzer (37397C VNA, Anritsu), two flexible coaxial cables (DC-40 GHz, TCF358KK, Totoku) and a customized probe station (Jmicro Technology) including a thermal chuck for a constant temperature of 20 ±0.1°C, a camera microscope, a DC regulated illuminator (MLC-150C, Motic), two microwave probes (Z probes, Cascade Microtech, Inc.) and two probes positioners (KRN-09S, Jmicro Technology). Probes linked the coaxial cables with the device. A laptop was connected to the VNA and the USB camera for probes positioning, measurements savings and data visualization and processing. 1 μl of cells suspension (100 Million/ml) were injected with a syringe pump (Pico Plus Elite, Harvard Apparatus). Acquisition data were processed as reported to plot the permittivity data versus frequency (26). Contrasts of the dielectric constant, Δε’ and Δε’’, are introduced to highlight the dielectric perturbation induced by the investigated elements, the cells, in a host medium. The reference for contrast extraction corresponds to the pure host medium, i.e. the culture medium for cellular suspensions. Each data point corresponds to 4 independent experiments with 4 different samples, with 3 replicates per experiment, using different sensors and new calibration of the test setup for each experiment, Culture medium was then used to clean the sensor between each cell suspension characterization and measured to avoid any memory effect in the dielectric response.
Flow cytometry analysis
Death measurements: 0,5.10⁶ cells were stained using 2,5 μg/ml
AnnexinV-V450, 5 μg/ml 7-AAD, and 5 μg/ml NucView-488 in 100 μl AnnexinV buffer reagent (15 minutes).
Intracellular proteins detection: cells were fixed and permeabilized
with Cytofix/Cytoperm reagent (BD Pharmingen) for 20 minutes at 4°C, then pelleted, washed with Perm/Wash buffer and stained with anti-PARP-Alexa 488, anti-Caspase-8-PE and anti-Cytochrome c-Alexa 647 antibodies (2 μg/ml) or with their isotypes control (4°C, 1 hour). Remark : For Cyto c (27).
Mitochondrial depolarization detection: cells were stained
with MitoView-633 (50 nM) and TMRE (50 nM) (30 minutes at 37°C-5%CO2).
Mitochondrial ROS content and mass measurement: cells were
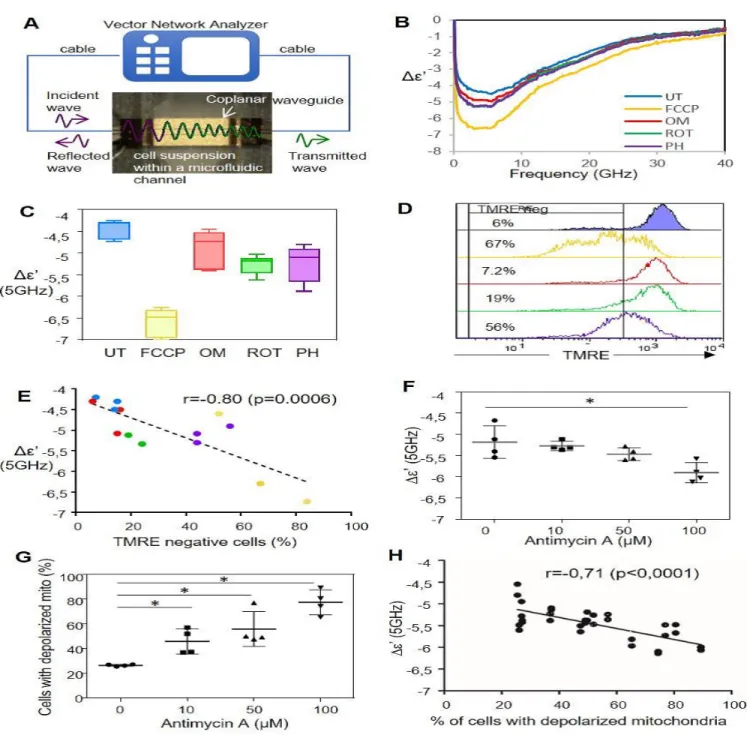
detect intracellular events such as mitochondrial depolarization. DOHH2, a lymphoma cell line, was treated for 4 hours with four drugs targeting oxidative phosphorylation in the mitochondria: FCCP (a mitochondrial uncoupler), rotenone and phenformin (inhibitors of the Electron Transfer Chain complex I) or oligomycin (ATP-synthase inhibitor). The Δε’ parameter of treated DOHH2 was then monitored with the MWDS with waves ranging from 400 MHz to 40 GHz after filling of the coplanar waveguide with the cell suspension (Fig.1A). As expected, the characteristic curve for an untreated living cell suspension was obtained (Fig.1B: blue line). However, treatment with the 4 different drugs induced a significant increase (in absolute value) of the Δε’ value at 5 GHz and especially with FCCP (Fig.1C). Mitochondrial depolarization in these conditions was checked by measuring the leak of cellular TMRE fluorescence by a flow cytometry analysis. A higher decrease of TMRE fluorescence in cells treated with FCCP and phenformin was found as compared to cells treated with oligomycin or by rotenone (Fig.1D). Finally, mitochondrial membrane depolarization was correlated with MWDS response, i.e. an increase of the Δε’ upon mitochondrial membrane depolarization (Fig.1E). Furthermore, DOHH2 was treated with increasing concentrations of Antimycin A which inhibits the oxidation of ubiquinol into ubiquinone from electron chain transfer (ETC) complex III. MWDS signal was measured and the Δε’ parameters obtained at 5 GHz were reported according to Antimycin A concentrations (Fig.1F). A significant increase in the contrast was observed with DOHH2 cells treated with Antimycin A at 100μM. Mitochondrial membrane depolarization was assessed by flow cytometry on the same treated cells and showed an increase of the percentage of cells with depolarized mitochondria upon Antimycin A treatment (Fig.1G). Finally, Δε’ was inversely correlated to the number of cells containing depolarized mitochondria (Fig.1H). Therefore, MWDS allows the detection of mitochondrial membrane depolarization in viable DOHH2 cells (Suppl Fig.2).
MWDS detects depolarized mitochondria in early phases of
induced apoptosis
We previously showed that MWDS detected permeabilized RL lymphoma cell lines with a decreased dielectric contrast compared to living cells (22). We wondered whether the MWDS parameter could be a marker for the mitochondrial depolarization occurring at the onset of apoptosis. The DOHH2 cell line was chosen as model as it contained a good percentage of apoptotic cells measured by flow cytometry after treatment with ABT263 and Rapamycin (Suppl Fig.3). As expected, plasma membrane permeabilization of DOHH2 with saponin induced as in RL lymphoma (22), a decrease in the contrast compared to the medium (Δε’= 0), i.e. a decrease of the Δε’ value measured by MWDS in waves ranging from 400 MHz to 40 GHz (Fig.2A left). Treatment MitoTracker green. The data presented the mean intensity of
MitoSOX or MitoTracker fluorescence. In all cases, cells were washed and suspended in PBS, and analyzed on a LSRII flow cytometer (BD Biosciences).
Oxygen consumption and extracellular acidification rate
measurements
Measurement of oxygen consumption (OCR) and extracellular acidification (ECAR) were performed using the XFp Extracellular Flux Analyser (Seahorse Bioscience, North Billerica, MA). Seahorse XFp microplates wells were coated with 50 μl of Cell-Tak (Corning) solution (22.4 μg/ml) and kept at 4°C overnight. After wells washing with distillated water, AML cells were plated (105 cells per well) in 180μl of XF base minimal DMEM media containing 11 mM glucose, 1 mM pyruvate and 2 mM glutamine, and the microplate was spanned at 80 g for 5 min. After one hour incubation at 37°C in CO2 free-atmosphere, OCR and ECAR were measured. The specific oxygen consumption rates represent the following measurements: basal rate, ATP turnover (basal rate minus oligomycininsensitive rate i.e. oligomycin sensitive), proton leak (oligomycin-insensitive rate), maximal respiration (FCCP/uncoupler-stimulated rate) and spare respiratory capacity (uncoupler-stimulated minus basal rate).
Microarray analysis
Downloaded datasets of gene expression profiles (GEP) of RL, Karpas 422, OCI-Ly3 and OCI-Ly7 cell lines obtained with Affymetrix HG U133 plus 2.0 microarray (GSE41856 (28), GSE42203 (not published), GSE53798 (29), GSE57083 (not published) , GSE36133 (30)) were assembled, RMA-normalized and collapsed to 20 000 HUGO protein-encoding genes. Comparison of GEP between RL/ Karpas 422 (n=7) and OCI-LY3/7 (n=8) groups were performed by Wilcoxon tests and corrected using the Benjamini–Hochberg method (31). The signification of over-expressed gene list were performed using the AutoCompare ZE software based Zelen’s exact test (32) with databases GeneOntology C5 (33), Reactome (34).
Statistical analysis
All data were done in triplicates, and analyzed on GraphPad Prism software using Mann-Whitney test (*: p<0.05).
Results
MWDS detects intracellular mitochondrial depolarization
Since we previously showed that MWDS could enabled us to detect molecules in aqueous solutions, different cell types at different concentrations ((Grenier (35), Suppl Fig.1) and to distinguish living cells from dead cells (22), we wondered whether MWDS could
Figure 1: MWDS detects intracellular mitochondrial depolarization.
A. Microwave setup consisting of a vector network analyzer connected to the microsensor with coaxial cables.
B. MWDS spectra of the dielectric parameter Δε’ from 400 MHz to 40 GHz of DOHH2 treated or not (UT) for 4 hours with FCCP (5μM) or Oligomycin (OM, 5 μM) or rotenone (ROT, 25 μM) or Phenformin (PH, 750 μM).
C. Δε’ value at 5 GHz for DOHH2 treated as above reported according the different treatments (three independent experiments). D. Mitochondria depolarization measurements using TMRE staining and flow cytometry analysis on DOHH2 treated as above.
E. Correlation of Δε’ values at 5 GHz with the percentage of cells with depolarized mitochondria for DOHH2 treated as above (each point corresponding to one independent experiment).
F. MWDS contrast measurements (Δε’ at 5 GHz) of DOHH2 treated for 4 hours with increased concentrations of Antimycin A (0, 10, 50 or 100 μM). G. Mitochondria depolarization measurements of DOHH2 cells treated with increased concentrations of Antimycin A (0, 10, 50 or 100 μM) using MitoView-633 staining and flow cytometry analysis.
H. Correlation of the percentage of DOHH2 cells with depolarized mitochondria with the Δε’ value at 5 GHz (DOHH2 treated with increased Antimycin A concentrations, 0 to 100 μM). *p<0.05 relative to the control untreated.
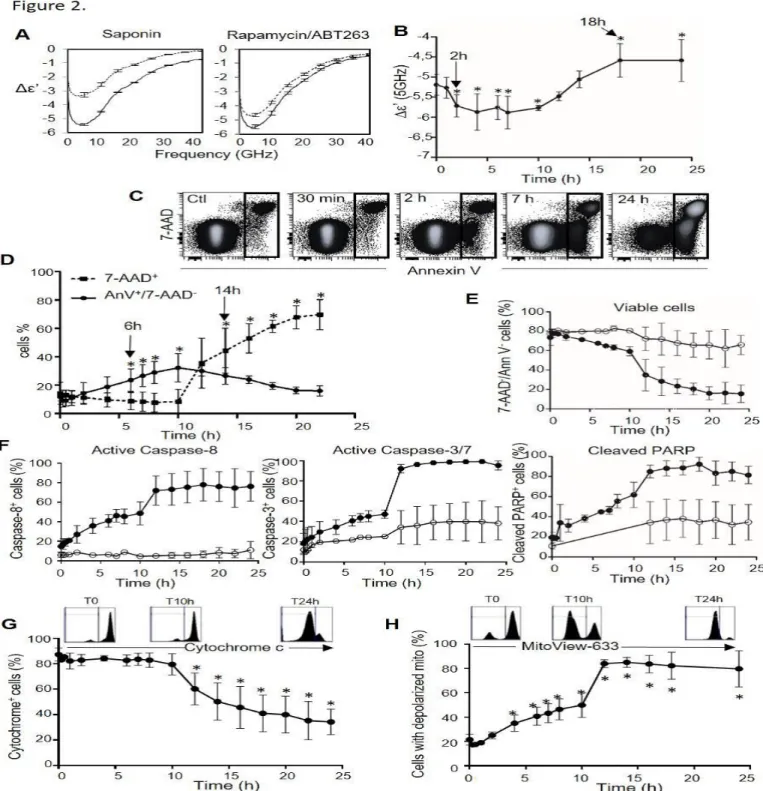
of DOHH2 with the ABT263/Rapamycin mix for 24h also induced a significant decrease in the contrast (Fig.2A right). We then searched to evaluate the dielectric behavior during this apoptotic process using a time lapse experiment lasting 24 hours with the same drugs. Δε’ values at 5 GHz were reported according to the time (Fig.2B).
Interestingly, a significant increase in the contrast in the early phases (from 2 hours to approximately 12 hours) was obtained. The Δε’ values then decreased in the late phases (18h). The late event of induced apoptosis is thus the permeabilization of the plasma membrane with a lower Δε’ compared to before the treatment. To know which event was detected by MWDS in the early phase of the apoptosis, corresponding to an increase of the dielectric contrast, several processes occurring during the induced apoptosis time lapse were monitored by flow cytometry. First, an increase of DOHH2 expressing 7-AAD and annexin V was observed from 7 hours of treatment with ABT263/Rapamycin (Fig.2C). A significant increase of cells expressing 7-AAD at 14 hours, characteristic of permeabilized cells (Fig.2D) was then obtained and was associated with the lowering of the Δε’ parameter measured by MWDS (Fig.2B). This confirmed that MWDS detects the membrane permeabilization by a decrease in the contrast. Moreover, cells expressing annexin V, which externalize PS, significantly increased from 6 h (Fig.2D). Thus, the significant increase in contrast from 2 hours measured by MWDS does not correspond to the PS externalization. MWDS detects other earlier biochemical events of induced apoptosis. Thus, we asked the question whether the early apoptotic events detected by MWDS could be caspase activation. For this, we performed flow cytometry analysis with staining of activated caspases and cleaved PARP on cells undergoing apoptosis time lapse with the same cocktail as above, with or without pretreatment with z-VAD, a
pan caspase inhibitor. Firstly, z-VAD treatment inhibited the decrease of viable cells from 7 hours (Fig.2E, white circles) and more precisely cells expressing Annexin V from 7 hours and cells expressing 7-AAD from 12 hours (Suppl Fig.4). PARP being a substrate of caspases during apoptosis, activated caspases and cleaved PARP expression were analyzed on the same apoptosis time lapse. Figure 2F shows a very early increase of activated caspases 8 and 3/7, and of cleaved PARP, inhibited by z-VAD pretreatment (white circle). Activation of caspases is thus a very early event in this model. To establish whether MWDS detects caspases activation in early apoptosis, the Δε’ parameter of DOHH2 pretreated or not with z-VAD before treatment with rapamycin/ABT263, was measured. z-VAD treatment did not modify the MWDS signal of apoptotic cells (Suppl Fig.5). The inhibition of caspases activation by z-VAD in an induced apoptotic model had no impact on the MWDS signal. Thus, early events detected by MWDS in induced apoptotic cells do not include caspase activation.
Initiation of intrinsic apoptosis involving Bcl-2 partners leads to mitochondrial membrane depolarization that allows the release of cytochrome c into the cytosol. Thus, we wondered whether mitochondrial modifications or release of cytochrome c could be the early apoptotic events detected by MWDS. Firstly, the release of cytochrome c induced by an apoptosis time lapse (with ABT-263/ rapamycin) was measured by flow cytometry. A significant decrease of the fluorescence associated with free intracellular cytochrome c from 12 hours of induced apoptosis in DOHH2 was obtained (Fig.2G). Thus, MWDS does not detect the release of cytochrome c in the early phases of induced apoptosis. The mitochondria membrane potential of DOHH2 was then measured after apoptosis induction. The decrease in red fluorescence (MitoView-633) reflects the mitochondria depolarization. A significant increase in the percentage of cells with
Figure 2: MWDS detects depolarization of mitochondria during early phases of induced apoptosis.
A. MWDS spectra of the Δε’ (400 MHz - 40 GHz) of DOHH2 treated (dashed line) or not (plain line) with saponin (left) or with ABT263/ Rapamycin (100 nM) (right).
B,C. Δε’ value at 5 GHz (B) and flow cytometry analysis of AnnexinV/7-AAD staining (C) for DOHH2 cell suspensions treated with ABT263/Rapamycin (100 nM) in time lapses from 30 min to 24 hours. D. Follow-up by flow cytometry of phosphatidylserine externalization (green solid line), and plasma membrane permeabilization (red dashed line), corresponding respectively to the percentage of AnnexinV+/7AAD- and 7-AAD+ cells according to time of treatment. E,F. Flow cytometry analysis of the percentage of viable cells (AnnexinV-/7-AAD-; E) and of cells with active Caspase-8, active Caspase-3/7 and inactivation of PARP (F) for DOHH2 cells pre-treated (empty circles) or not (black circles) with zVAD (20 μM) before ABT263/Rapamycin (100 nM/100 nM) treatment according to time of treatment.
G,H. Flow cytometry analysis of the cytochrome c release from mitochondria (G) or of mitochondrial depolarization measurements using MitoView-633 staining (percentage of cells losing red fluorescence) (H) of DOHH2 cells treated in a time lapse with ABT263/Rapamycin (100 nM/100 nM). Mean ± SD of 4 experiments with 3 replicates per experiment; *p<0.05 relative to the control untreated (B to H).
depolarized mitochondria was shown after 4 hours of apoptotic treatment (Fig.2H). As Caspase activation is not detected by MWDS, mitochondria depolarization is therefore the early event detected by MWDS during apoptosis.
MWDS response is a marker of mitochondrial oxidative
state in cancer cells
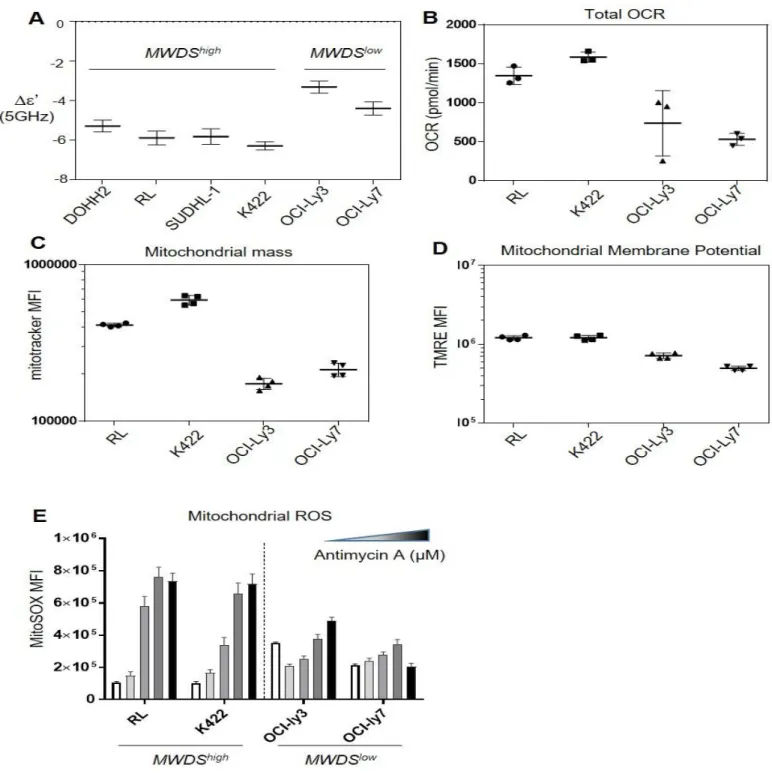
Since MWDS identifies cells with depolarized mitochondria, this method could be used to easily detect cells with changes in mitochondrial biogenesis and/or activities in cancer. Thus, we asked the question whether different lymphoma cell lines could display different mitochondrial activity assessed by Δε’ measurement at 5 GHz with MWDS. Amongst six different cell lines tested, four, DOHH2, RL, SUDHL-1 and Karpas 422 (K422), displayed a higher Δε’than in OCI-Ly3 and OCI-Ly7 cells. The first four cell lines were thus referred to as MWDShigh responders and the last two as MWDSlow responders
mitochondrial ROS upon Antimycin A treatment (Fig.3E, grey and black bars).
All these results showed that MWDS could discriminate cancer cells with regard to their respective mitochondrial activity. Moreover, the analysis of the cellular energetic balance (OCR versus ECAR; Suppl Fig.6) showed that RL and K422 cells had a higher OXPHOS status than OCI-Ly3 and OCI-Ly7 cells (Fig.4A). Furthermore, the comparison of gene expression profiles (GEP) of MWDShigh vs MWDSlow lymphoma cell lines was performed. Datasets of GEP of RL, K422, DOHH2 and SUDHL-1 (n=12) and of the OCI-LY3/7 (n=8) were downloaded from the Cancer Cell Line Encyclopedia (CCLE) and gene expression levels (log2) were compared between the two groups. 268 genes were differentially expressed (BH-corrected Student P= 1.2 e-4, FDR 0.05). These comprised 168 up-regulated and 100 down-regulated genes in the MWDShigh vs MWDSlow cell lines. The signification of the
over-Figure 3: MWDS is sensitive to the Oxphos status.
A. Δε’ value at 5 GHz for six lymphoma cell lines (mean of three different experiments). B. Rate of total oxygen consumption by four lymphoma cell lines selected (n=3).
C,D. Mitochondrial mass (C) and active mitochondrial membrane potential (MMP) (D) assessed by flow cytometry using the fluorescent MitoTracker Green (MTG) and TMRE probes (n=4).
E. MitoSOX mean of fluorescence (MFI) analyzed by flow cytometry which determines the mitochondrial ROS content in the two groups of lymphoma cell lines treated with increasing concentrations of Antimycin A (10 to 100 μM) compared to the basal MMP in white.
pneumoniae for instance, a decreased ATP production was associated with decreased numbers of healthy mitochondria in aged adult macrophages and lung tissue (45). Furthermore, as metabolic changes in tumor cells are hallmarks of cancer, numerous studies focus on the mitochondrial status that can control drug response, cell proliferation or the metastatic ability of tumor cells (46, 47). Identification of new markers for cancer diagnosis involving alteration of mitochondria or to predict the response to drugs targeting the mitochondria, is still a challenge. In this study, we showed that the MWDS technique was able to discriminate lymphoma cell lines with regard to their mitochondrial status. By their altered metabolism, some cancer cells display a high level of oxidative stress with increased ROS production. However, the most suitable environment for tumor development is high amounts of oxygen and nutrients and few ROS. Thus, to manage this oxidative stress, these cells overexpress genes involved in the glutathione metabolism and/or the purine salvage, two pathways found to be overexpressed in MWDShigh responders of this study. MWDShigh responders were determined here as high OXPHOS cells with a strong MWDS permittivity. Indeed, the glutathione peroxidase decreases the ROS production by the oxidation of the glutathione, consistent with a weak level of ROS in mitochondria of MWDShigh responders.
The decrease of oxidative stress by glutathione peroxidase overexpression is often associated with chemoresistance (48– 51). High mitochondrial activity supports chemoresistance in glioblastoma, prostate cancer or acute myeloid leukemia (5, 52– 54). In carcinomas, this chemoresistance can also be triggered by mitochondrial miRNAs which reprogram the energetic metabolism (55). The MWDS contrast parameter,Δε, could thus be a new marker of chemoresistance of cancer cells. Moreover, as we have shown that MWDShigh responders produced a higher amount of mitochondrial ROS in response to drugs, this parameter could also be a new marker for mitochondrial changes in drug responses and mitochondrial priming to apoptosis.
In addition to its role in several diseases, mitochondria are key factors in the female reproductive system, with dysfunctions in oocytes resulting in infertility (56); hence the interest of the MWDS development as a new diagnostic tool for testing and treatment of these deficient oocytes (57).
Discussion
This study demonstrates that the MWDS detects the mitochondrial energetic activity in living cells without any labeling treatment as usually required with classical methods. The MWDS contrast parameter,Δε, increases with the depolarization of the mitochondrial membrane and thus during early phases of apoptosis. This increase could be related to the rise of the proton leak from the mitochondria or to the reduction of the mitochondrial ROS content concomitant to the increase in the cytoplasmic ROS content. During apoptosis, concomitantly with the activation of pro-apoptotic factors, the endoplasmic reticulum (ER) releases high amount of Ca2+ to the mitochondria that also contributes to mitochondrial depolarization (36). Increased levels of Ca2+ in mitochondria might also contribute to the increase in MWDS contrast during early phases of apoptosis. Microwaves are indeed sensitive to the interactions between water molecules and ions and/or macromolecules (17, 23). Furthermore, dysregulated mitochondrial Ca2+ homeostasis contributes to cancer cell survival, Ca2+ transfer from the ER to the mitochondria is essential for the maintenance of mitochondrial function and energy balance in these cells (37, 38). Hence MWDS could thus be applied to discriminate healthy from tumors cells. However, further studies will aim to clarify in depth the relationship between the molecular interactions and the changes in broadband dielectric signals. Nevertheless, since MWDS at 0.4 to 10 GHz frequency ranges detects the depolarization of mitochondria, and since this phenomenon might underlie some diseases, MWDS could prove useful in diagnosis, prognosis or monitoring therapeutic responses. In neurodegenerative diseases such as Parkinson’s or Alzheimer’s diseases, mitochondria dysfunction and oxidative stress play a critical role in the etiopathogenesis and the pathophysiology (39, 40). Mitochondrial dysfunction in adipocytes is also a primary cause of adipose tissue inflammation in diabetes (41). Some treatments and prevention strategies for these diseases are based on improving mitochondrial functions which could easily be evaluated using MWDS. Mitochondria are also essential in the skeletal muscles for ATP production which is a key element of muscle contractibility and plasticity. Generation and development of skeletal muscle pathologies are thus often due to mitochondrial dysfunction such as sarcopenia with notable alterations of mitochondrial Ca2+ homeostasis (42–44). Immune responses also highly depend on fully functional mitochondria. In response to Streptococcus
5. Farge, T., E. Saland, F. de Toni, N. Aroua, M. Hosseini, R. Perry, C. Bosc, M. Sugita, L. Stuani, M. Fraisse, S. Scotland, C. Larrue, H. Boutzen, V. Féliu, M.-L. Nicolau-Travers, S. Cassant-Sourdy, N. Broin, M. David, N. Serhan, A. Sarry, S. Tavitian, T. Kaoma, L. Vallar, J. Iacovoni, L.K. Linares, C. Montersino, R. Castellano, E. Griessinger, Y. Collette, O. Duchamp, Y. Barreira, P. Hirsch, T. Palama, L. Gales, F. Delhommeau, B.H. Garmy-Susini, J.-C. Portais, F. Vergez, M. Selak, G. Danet-Desnoyers, M. Carroll, C. Récher, and J.-E. Sarry. 2017. Chemotherapy-Resistant Human Acute Myeloid Leukemia Cells Are Not Enriched for Leukemic Stem Cells but Require Oxidative Metabolism. Cancer Discov. 7: 716–735.
6. Kuntz, E.M., P. Baquero, A.M. Michie, K. Dunn, S. Tardito, T.L. Holyoake, G.V. Helgason, and E. Gottlieb. 2017. Targeting mitochondrial oxidative phosphorylation eradicates therapy-resistant chronic myeloid leukemia stem cells. Nat. Med. 23: 1234– 1240.
7. Osellame, L.D., T.S. Blacker, and M.R. Duchen. 2012. Cellular and molecular mechanisms of mitochondrial function. Best Pract. Res. Clin. Endocrinol. Metab. 26: 711–723.
8. Hayashi, M., Y.-J. Shiu, K.K. Liang, S.H. Lin, and Y.R. Shen. 2007. Theory of time-resolved sum-frequency generation and its applications to vibrational dynamics of water. J. Phys. Chem. A. 111: 9062–9069.
9. Ermilova, E., F.F. Bier, and R. Hölzel. 2014. Dielectric measurements of aqueous DNA solutions up to 110 GHz. Phys. Chem. Chem. Phys. 16: 11256–11264.
10. Wolf, M., R. Gulich, P. Lunkenheimer, and A. Loidl. 2012. Relaxation dynamics of a protein solution investigated by dielectric spectroscopy. Biochim. Biophys. Acta. 1824: 723–730.
11. Artis, F., david dubuc, J.-J. Fournié, M. Poupot, and K. Grenier. 2014. Microwave dielectric spectroscopy of cell membrane permeabilization with saponin on human B lymphoma cells. IEEE MTT- Int. Microw. Symp. IMS. .
12. Artis, F., david dubuc, J.-J. Fournié, M. Poupot, and K. Grenier. 2015. Sub-microliter microwave dielectric spectroscopy for identification and quantification of carbohydrates in aqueous solution. IEEE Top. Conf. Biomed. Wirel. Technol. Netw. Sens. Syst. BioWireleSSBiowireless. : 45–47.
Mitochondrial dysfunction is also critical in fungal pathogenesis and plant physiology. Both Candida albicans pathogenesis, virulence, and tolerance to antifungal drugs rely upon mitochondrial activity (58). Hence MWDS could also prove useful to directly monitor sensitivity to antifungal drugs in various human pathogens. In plants as well, some phytotoxic drugs which directly target mitochondria and impact crop productivity could also be tested by MWDS (59, 60). Thus, MWDS represents the first non-invasive and label-free method for rapid detection and monitoring of mitochondrial activity in living cells for different therapeutic applications in medicine and beyond. Interestingly, another method using microwaves was recently developed to produce images of live mitochondria in respiration buffer without any labelling or pretreatment (61). Scanning microwave microscopy (SMM) is currently able to produce an image of isolated mitochondria in buffer which provide nutrients to sustain the Krebs cycle. Thus to go further, the coupling of SMM to MWDS presented here might be the way to visualize the changes in the energetic status of the mitochondria in cases where SMM can be adapted to the imaging of the whole cell.
Author Contributions
MP, KG and DD supervise the project; MP, GP, KG, DD, JES and JJF designed the experiments; GP, FA and AT performed the MWDS experiments; GP, MH, CB and ES performed the flow cytometry experiments; MT, FP and FL performed the genomic and computational experiments; MP, GP, JES and JJF interpreted the data; MP wrote the paper.
Acknowledgments
This work was supported by institutional grants from the Institut National de la Santé et de la Recherche Médicale (INSERM), the Université Toulouse 3, the Centre National de la Recherche Scientifique (CNRS) and the Plan Cancer Aviesan.
Additional information
No Competing financial and non-financial interests
References
1. Smolders, V.F., E. Zodda, P.H.A. Quax, M. Carini, J.A. Barberà, T.M. Thomson, O. Tura-Ceide, and M. Cascante. 2018. Metabolic Alterations in Cardiopulmonary Vascular Dysfunction. Front. Mol. Biosci. 5: 120.
2. Zhao, X.-Y., M.-H. Lu, D.-J. Yuan, D.-E. Xu, P.-P. Yao, W.-L. Ji, H. Chen, W.-L. Liu, C.-X. Yan, Y.-Y. Xia, S. Li, J. Tao, and Q.-H. Ma. 2019.
1810–1816.
28. Gravelle, P., C. Jean, J. Familiades, E. Decaup, A. Blanc, C. Bezombes-Cagnac, C. Laurent, A. Savina, J.-J. Fournié, and G. Laurent. 2014. Cell growth in aggregates determines gene expression, proliferation, survival, chemoresistance, and sensitivity to immune effectors in follicular lymphoma. Am. J. Pathol. 184: 282–295.
29. Falgreen, S., K. Dybkær, K.H. Young, Z.Y. Xu-Monette, T.C. El-Galaly, M.B. Laursen, J.S. Bødker, M.K. Kjeldsen, A. Schmitz, M. Nyegaard, H.E. Johnsen, and M. Bøgsted. 2015. Predicting response to multidrug regimens in cancer patients using cell line experiments and regularised regression models. BMC Cancer. 15: 235.
30. Barretina, J., G. Caponigro, N. Stransky, K. Venkatesan, A.A. Margolin, S. Kim, C.J. Wilson, J. Lehár, G.V. Kryukov, D. Sonkin, A. Reddy, M. Liu, L. Murray, M.F. Berger, J.E. Monahan, P. Morais, J. Meltzer, A. Korejwa, J. Jané-Valbuena, F.A. Mapa, J. Thibault, E. Bric-Furlong, P. Raman, A. Shipway, I.H. Engels, J. Cheng, G.K. Yu, J. Yu, P. Aspesi, M. de Silva, K. Jagtap, M.D. Jones, L. Wang, C. Hatton, E. Palescandolo, S. Gupta, S. Mahan, C. Sougnez, R.C. Onofrio, T. Liefeld, L. MacConaill, W. Winckler, M. Reich, N. Li, J.P. Mesirov, S.B. Gabriel, G. Getz, K. Ardlie, V. Chan, V.E. Myer, B.L. Weber, J. Porter, M. Warmuth, P. Finan, J.L. Harris, M. Meyerson, T.R. Golub, M.P. Morrissey, W.R. Sellers, R. Schlegel, and L.A. Garraway. 2012. The Cancer Cell Line Encyclopedia enables predictive modelling of anticancer drug sensitivity. Nature. 483: 603–607.
31. Hochberg, Y., and Y. Benjamini. 1990. More powerful procedures for multiple significance testing. Stat. Med. 9: 811–818.
32. Ycart, B., F. Pont, and J.-J. Fournié. 2014. Curbing false discovery rates in interpretation of genome-wide expression profiles. J. Biomed. Inform. 47: 58–61.
33. Ashburner, M., C.A. Ball, J.A. Blake, D. Botstein, H. Butler, J.M. Cherry, A.P. Davis, K. Dolinski, S.S. Dwight, J.T. Eppig, M.A. Harris, D.P. Hill, L. Issel-Tarver, A. Kasarskis, S. Lewis, J.C. Matese, J.E. Richardson, M. Ringwald, G.M. Rubin, and G. Sherlock. 2000. Gene ontology: tool for the unification of biology. The Gene Ontology Consortium. Nat. Genet. 25: 25–29.
34. Milacic, M., R. Haw, K. Rothfels, G. Wu, D. Croft, H. Hermjakob, P. D’Eustachio, and L. Stein. 2012. Annotating cancer variants and anti-cancer therapeutics in reactome. Cancers. 4: 1180–1211. 35. Grenier, K, Artis, F, Poupot, M, Fournie, JJ and Dubuc, D. 2018. Label-free discrimination of human lymphoma cell sub-populations with microwave dielectric spectroscopy. .
36. Akl, H., T. Vervloessem, S. Kiviluoto, M. Bittremieux, J.B. Parys, H. De Smedt, and G. Bultynck. 2014. A dual role for the anti-apoptotic Bcl-2 protein in cancer: Mitochondria versus endoplasmic reticulum. Biochim. Biophys. Acta BBA - Mol. Cell Res. 1843: 2240– 2252.
15. dubuc, david, O. Mazouffre, C. Llorens, T. Taris, M. Poupot, J.-J. Fournié, J.-J.-B. Begueret, and K. Grenier. 2013. Microwave-based biosensor for on-chip biological cell analysis. ANALOG Integr. CIRCUITS SIGNAL Process. : 135–142.
16. Tamra, A., D. Dubuc, M.-P. Rols, and K. Grenier. 2017. Microwave Monitoring of Single Cell Monocytes Subjected to Electroporation. Ieee Trans. Microw. Theory Tech. 65: 3512–3518.
17. Stelson, A.C., M. Liu, C.A.E. Little, C.J. Long, N.D. Orloff, N. Stephanopoulos, and J.C. Booth. 2019. Label-free detection of conformational changes in switchable DNA nanostructures with microwave microfluidics. Nat. Commun. 10: 1174.
18. Polk C and E Postow. Handbook of Biological Effects of Electromagnetic Fields. Eliot Postow.
19. Fuchs, K., and U. Kaatze. 2001. Molecular dynamics of carbohydrate aqueous solutions. Dielectric relaxation as a function of glucose and fructose concentration. J. Phys. Chem. B. 105: 2036– 2042.
20. Mcgami, G., T. Wazawa, N. Morimoto, T. Kodama, and M. Suzuki. 2011. Hydration properties of adenosine phosphate series as studied by microwave dielectric spectroscopy. Biophys. Chem. 154: 1–7.
21. 2015. Dielectric Relaxation in Biological Systems: Physical Principles, Methods, and Applications. New York: Oxford Univ Press.
22. Artis, F., T. Chen, T. Chretiennot, J.-J. Fournié, M. Poupot, david dubuc, and K. Grenier. 2015. Microwaving Biological Cells: Intracellular Analysis with Microwave Dielectric Spectroscopy. Microw. Mag. IEEE. : 87–96.
23. Buchner, R., and G. Hefter. 2009. Interactions and dynamics in electrolyte solutions by dielectric spectroscopy. Phys. Chem. Chem. Phys. PCCP. 11: 8984–8999.
24. Asami, K. 2002. Characterization of heterogeneous systems by dielectric spectroscopy. Prog. Polym. Sci. 27: 1617–1659.
25. Mateu, J., N. Orloff, M. Rinehart, and J.C. Booth. 2007. Broadband Permittivity of Liquids Extracted from Transmission Line Measurements of Microfluidic Channels. In: 2007 IEEE/MTT-S International Microwave Symposium. . pp. 523–526.
26. Grenier, K, Dubuc, D, Poleni, PE, Kumemura, H, Toshiyoshi,H, Fujii, T, and Fujita, H. 2009. Integrated broadband microwave and microfluidic sensor dedicated to bioengineering. 57: 3246–3249. 27. Bellosillo, B., N. Villamor, A. López-Guillermo, S. Marcé, F. Bosch, E. Campo, E. Montserrat, and D. Colomer. 2002. Spontaneous and drug-induced apoptosis is mediated by conformational changes of Bax and Bak in B-cell chronic lymphocytic leukemia. Blood. 100:
37. Roderick, H.L., and S.J. Cook. 2008. Ca2+ signalling checkpoints in cancer: remodelling Ca2+ for cancer cell proliferation and survival. Nat. Rev. Cancer. 8: 361–375.
38. Bustos, G., P. Cruz, A. Lovy, and C. Cárdenas. 2017. Endoplasmic Reticulum-Mitochondria Calcium Communication and the Regulation of Mitochondrial Metabolism in Cancer: A Novel Potential Target. Front. Oncol. 7: 199.
39. Bajracharya, R., N.A. Youngson, and J.W.O. Ballard. 2019. Dietary Macronutrient Management to Treat Mitochondrial Dysfunction in Parkinson’s Disease. Int. J. Mol. Sci. 20.
40. Tobore, T.O. 2019. On the central role of mitochondria dysfunction and oxidative stress in Alzheimer’s disease. Neurol. Sci. Off. J. Ital. Neurol. Soc. Ital. Soc. Clin. Neurophysiol. .
41. Woo, C.Y., J.E. Jang, S.E. Lee, E.H. Koh, and K.U. Lee. 2019. Mitochondrial Dysfunction in Adipocytes as a Primary Cause of Adipose Tissue Inflammation. Diabetes Metab. J. .
42. Abrigo, J., F. Simon, D. Cabrera, C. Vilos, and C. Cabello-Verrugio. 2019. Mitochondrial dysfunction in skeletal muscle pathologies. Curr. Protein Pept. Sci. .
43. Huang, Y., X. Zhu, K. Chen, H. Lang, Y. Zhang, P. Hou, L. Ran, M. Zhou, J. Zheng, L. Yi, M. Mi, and Q. Zhang. 2019. Resveratrol prevents sarcopenic obesity by reversing mitochondrial dysfunction and oxidative stress via the PKA/LKB1/AMPK pathway. Aging. . 44. Zampieri, S., C. Mammucari, V. Romanello, L. Barberi, L. Pietrangelo, A. Fusella, S. Mosole, G. Gherardi, C. Höfer, S. Löfler, N. Sarabon, J. Cvecka, M. Krenn, U. Carraro, H. Kern, F. Protasi, A. Musarò, M. Sandri, and R. Rizzuto. 2016. Physical exercise in aging human skeletal muscle increases mitochondrial calcium uniporter expression levels and affects mitochondria dynamics. Physiol. Rep. 4.
45. Plataki, M., S.J. Cho, R.M. Harris, H.-R. Huang, H.S. Yun, K.T. Schiffer, and H.W. Stout-Delgado. 2019. Mitochondrial Dysfunction in Aged Macrophages and Lung during Primary Streptococcus pneumoniae Infection is Improved with Pirfenidone. Sci. Rep. 9: 971.
46. Zhang, G., D.T. Frederick, L. Wu, Z. Wei, C. Krepler, S. Srinivasan, Y.C. Chae, X. Xu, H. Choi, E. Dimwamwa, O. Ope, B. Shannan, D. Basu,
5849–5855.
48. Wang, S.-F., C.-H. Wung, M.-S. Chen, C.-F. Chen, P.-H. Yin, T.-S. Yeh, Y.-L. Chang, Y.-C. Chou, H.-H. Hung, and H.-C. Lee. 2018. Activated Integrated Stress Response Induced by Salubrinal Promotes Cisplatin Resistance in Human Gastric Cancer Cells via Enhanced xCT Expression and Glutathione Biosynthesis. Int. J. Mol. Sci. 19.
49. Nunes, S.C., C. Ramos, F. Lopes-Coelho, C.O. Sequeira, F. Silva, S. Gouveia-Fernandes, A. Rodrigues, A. Guimarães, M. Silveira, S. Abreu, V.E. Santo, C. Brito, A. Félix, S.A. Pereira, and J. Serpa. 2018. Cysteine allows ovarian cancer cells to adapt to hypoxia and to escape from carboplatin cytotoxicity. Sci. Rep. 8: 9513.
50. Colla, R., A. Izzotti, C. De Ciucis, D. Fenoglio, S. Ravera, A. Speciale, R. Ricciarelli, A.L. Furfaro, A. Pulliero, M. Passalacqua, N. Traverso, M.A. Pronzato, C. Domenicotti, and B. Marengo. 2016. Glutathione-mediated antioxidant response and aerobic metabolism: two crucial factors involved in determining the multi-drug resistance of high-risk neuroblastoma. Oncotarget. 7: 70715– 70737.
51. Balendiran, G.K., R. Dabur, and D. Fraser. 2004. The role of glutathione in cancer. Cell Biochem. Funct. 22: 343–352.
52. Comelli, M., I. Pretis, A. Buso, and I. Mavelli. 2018. Mitochondrial energy metabolism and signalling in human glioblastoma cell lines with different PTEN gene status. J. Bioenerg. Biomembr. 50: 33–52. 53. Ippolito, L., A. Marini, L. Cavallini, A. Morandi, L. Pietrovito, G. Pintus, E. Giannoni, T. Schrader, M. Puhr, P. Chiarugi, and M.L. Taddei. 2016. Metabolic shift toward oxidative phosphorylation in docetaxel resistant prostate cancer cells. Oncotarget. 7: 61890– 61904.
54. Bosc, C., M.A. Selak, and J.-E. Sarry. 2017. Resistance Is Futile: Targeting Mitochondrial Energetics and Metabolism to Overcome Drug Resistance in Cancer Treatment. Cell Metab. 26: 705–707. 55. Fan, S., T. Tian, W. Chen, X. Lv, X. Lei, H. Zhang, S. Sun, L. Cai, G. Pan, L. He, Z. Ou, X. Lin, X. Wang, M.F. Perez, Z. Tu, S. Ferrone, B.A. Tannous, and J. Li. 2019. Mitochondrial miRNA determines chemoresistance by reprogramming metabolism and regulating mitochondrial transcription. Cancer Res. .
Extracellular Flux Analysis. J. Vis. Exp. JoVE. .
59. Araniti, F., A. Costas-Gil, L. Cabeiras-Freijanes, A. Lupini, F. Sunseri, M.J. Reigosa, M.R. Abenavoli, and A.M. Sánchez-Moreiras. 2018. Rosmarinic acid induces programmed cell death in Arabidopsis seedlings through reactive oxygen species and mitochondrial dysfunction. PloS One. 13: e0208802.
60. Vicentini, T.M., A.H. Cavalheiro, C.R.P. Dechandt, L.C. Alberici, and C.G. Vargas-Rechia. 2019. Aluminum directly inhibits alternative oxidase pathway and changes metabolic and redox parameters on Jatropha curcas cell culture. Plant Physiol. Biochem. PPB. 136: 92–97.
61. Li, J., Z. Nemati, K. Haddadi, D.C. Wallace, and P.J. Burke. 2018. Scanning Microwave Microscopy of Vital Mitochondria in Respiration Buffer. IEEE MTT- Int. Microw. Symp. Dig. IEEE MTT- Int. Microw. Symp. 2018: 115–118.