HAL Id: hal-02433889
https://hal.archives-ouvertes.fr/hal-02433889
Submitted on 9 Jan 2020HAL is a multi-disciplinary open access archive for the deposit and dissemination of sci-entific research documents, whether they are pub-lished or not. The documents may come from teaching and research institutions in France or abroad, or from public or private research centers.
L’archive ouverte pluridisciplinaire HAL, est destinée au dépôt et à la diffusion de documents scientifiques de niveau recherche, publiés ou non, émanant des établissements d’enseignement et de recherche français ou étrangers, des laboratoires publics ou privés.
3d core thermalhydraulic phenomena in pwr sblocas and
iblocas
D. Bestion, M. Valette, P. Fillion, P. Gaillard
To cite this version:
D. Bestion, M. Valette, P. Fillion, P. Gaillard. 3d core thermalhydraulic phenomena in pwr sblocas and iblocas. NURETH-17, Sep 2017, Xian, China. �hal-02433889�
3D CORE THERMALHYDRAULIC PHENOMENA IN PWR SBLOCAS
AND IBLOCAS
D. Bestion, M. Valette
CEA-GRENOBLE, DEN-DM2S-STMF, 17 rue des martyrs, 38054 Grenoble, FRANCE
[email protected]
;
[email protected]
P. Fillion, P. Gaillard
CEA-Saclay, DEN-DM2S-STMF, F-91191 Gif-sur-Yvette, France
[email protected]
; [email protected]
ABSTRACT
System thermalhydraulic codes have 3D models in porous medium approach which were initially devoted to the prediction of very large scale 3D effects during LBLOCAs. Such 3D modules initially used a very coarse nodalization including only a few hundreds of meshes in the whole pressure vessel. Today the computer power allows 3D simulations with a much finer nodalization in many transients. A core modelling with one mesh per assembly may become a standard practice in near future. This allows to look at much finer multi-dimensional physical processes.
As part of a general methodology a detailed PIRT is made to identify the dominant phenomena occurring in a PWR core in small break and intermediate break LOCAS with particular attention to uncovered core situations and to the peak clad temperature (PCT). Processes which have a significant impact on the PCT include the interfacial friction, the radial mixing of phases below the swell level, the crossflows in the single-phase vapou uncovered zone which are produced by radial differences in gravity and friction pressure losses. Turbulent diffusion of momentum and heat with the impact of spacer grids and dispersion effects of momentum and heat in the porous medium with the impact of the mixing vanes are also considered. Then processes are quantitatively evaluated using existing data, using scaling analysis, using some simulations and sensitivity tests. At last a validation matrix is defined to cover all dominant processes. The role of finer scale simulations in the whole process is also presented. As a final objective, a reduction of code prediction uncertainty is expected.
KEYWORDS 3D porous medium approach, LOCA, crossflow, diffusion and dispersion
1. INTRODUCTION
Small Break Loss of Coolant Accidents (SBLOCAs) and Intermediate Break Loss of Coolant Accidents (IBLOCAs) of Pressurized water Reactors have been extensively studied in the past for licensing and safety demonstrations. System Thermalhydraulic codes are used to simulate the transients and they have been extensively validated against separate effect tests (SETs) and integral effect tests (IETs). Most of these simulations used a 1D core modelling or better a multi-1D modelling with a possible modelling of crossflows to be able to predict the peak clad temperature (PCT) of the highest power rod. A typical core nodalization could use a mean core in parallel with a hot assembly. In the hot assembly, several rods could be coupled to the mean thermalhydraulics and the highest power rod was used to predict the PCT.
1. The possible fuel relocation in case of clad ballooning makes it more difficult to demonstrate that the safety criterion is not reached since the degraded cooling of deformed rods may be associated to an increased local decay power.
2. The continuous increase of computer power allows using 3D Pressure Vessel (PV) modelling with a finer nodalization.
The Figure 1 below shows PV nodalizations for LOCA simulations.
Figure 1: Illustration of the nodalization of a PWR pressure vessel using a 3D module. On the left an old coarse nodalization; on the right a recent finer nodalization particularly in the core On the left one can see an old nodalization of a 3 loop reactor with a cylindrical coordinate and 5 meshes in a radius, 6 meshes in the azimutal direction and 21 meshes in the vertical direction for a total of 630 meshes only (198 meshes in the core) . On the right side, (Prea, 2017, [1]) one can see a cylindrical system of coordinates in all parts except the core which is modelled in a cartersian frame of reference and one column of meshes per assembly. In the radial direction, there is one radial mesh in the downcomer, a radial mesh for the core baffle, and 5 radial meshes in lower plenum, upper plenum and upper head. This nodalization is clearly much finer in the core with about 6000 meshes. The continuous progress of computer power will allow in future a nodalization with the possibility to combining various sub-components using either cartesian, cylindrical or elliptical frames of reference depending on the local geometry as shown in Figure 2. One may also imagine local mesh refinements in one or a few fuel assemblies which would be treated by sub-channel analysis model, i.e. with one raw of meshes for each sub-channel.
A general methodology is proposed to develop such new applications of 3D modules of system codes. In a first step, a detailed PIRT will be applied to identify the dominant phenomena occurring in a PWR core in small break and intermediate break LOCAS with particular attention to uncovered core situations and to the PCT. All processes which may have a significant impact on the PCT will be listed. In a second step, each process will be quantitatively evaluated using existing data, using scaling analysis, using some simulations and sensitivity tests, and a hierarchy will be established with respect to the impact on the PCT. Then, an ideal validation matrix will be defined to cover all dominant processes. The role of finer scale simulations in the whole process is also considered to complement the existing data and the planned experimental programs. As a final objective, a reduction of code prediction uncertainty is expected, which may be helpful when considering the worst scenarios with possible clad ballooning and fuel relocation.
Figure 2: Example of evolution of the 3D modelling of a Pressure Vessel with Cartesian, cylindrical elliptical coordinates and with possibility of a local zoom with sub-channel analysis in one or a few
assemblies.
2. THE PHENOMENA IN THE CORE DURING SBLOCAS AND IBLOCAS
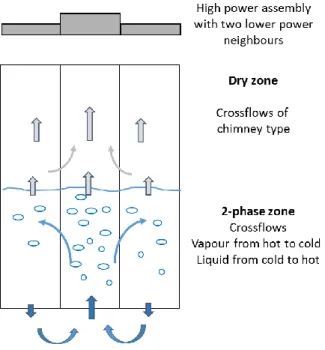
The main concern during LOCAs is the maximum clad temperature reached in the core uncovery phases of the transients. Such phases are encountered in SBLOCAs and IBLOCAs after SCRAM with a decay power in the range of about 4% down to 1.5% of nominal power. Due to a lack of cooling water in the core, there may be a two phase mixture up to a swell level and a pure vapour flow or a vapour + droplets flow in the upper part of the core. Below the swell level, a good nucleate boiling heat transfer provides an efficient cooling of fuel rods whereas in the vapour zone, a post-dry-out heat transfer induces a possible high clad temperature. A possible entrainment of droplets in the dry zone may create a better heat transfer since droplets absorb some steam superheat and vaporize, increasing the steam flowrate.
In the zone below the swell level, there may be some subcooled liquid at the bottom and then a saturated two-phase mixture. Boiling occurs due to decay heat and there may be in addition some additional vaporization by flashing if the system pressure decreases. The swell level depends mainly on the interfacial friction and to a lower extent on the net vapor generation point and on the heat flux partitioning in the subcooled boiling region. In the dry region above swell level (in pure steam flow conditions), the vapour temperature increases due to heat received by forced convection from the rods. The clad temperature Tw is associated to the vapour temperature Tv with a difference Tw-Tv which is controlled by the heat transfer coefficient
The various fuel assemblies in a core may have some neutronic power differences associated to their burn up, and their position in the core. The various rods in an assembly may have some neutronic power differences associated to their position with respect to guide tubes or to space between assemblies and to neighboring assemblies. These differences create radial differences of thermalhydraulic parameters between assemblies and between sub-channels. Several types of radial transfers of mass, momentum and energy are then created.
Figure 3: Sketch of phenomena in a PWR during a core uncovery with radial transfers associated to radial power differences
Let’s consider the various zones:
Radial transfers in the region below the swell level
More boiling occurs in higher power assemblies and in sub-channels which receive a higher power than in other assemblies and other sub-channels. This creates in the zone below the swell level rather strong natural circulation due to average density differences (Figure 3). More upward flow velocity exists in highest power sub-channels and assemblies. Gravity driven natural circulation creates a radial flow from high power regions to low power regions tending to homogenize the void fraction. The inlet velocity at bottom of the core may be very different in the various assemblies and negative velocity may even exist at inlet of low power assemblies. Due to this radial homogenization, the swell level is almost uniform with a small trend to be a little higher in higher power zones. The efficiency of the radial homogenization depends on the radial friction losses and to interfacial friction in a two-phase flow which is not parallel to rods. In this zone below the swell level, radial diffusion and dispersion effects of mass momentum and energy also play a probably minor role compared to natural circulation effects. The vapour mass flux leaving the swell level is also more or less homogenized and highest power assemblies may have a higher mass flux than lower power assemblies with a relative difference which is significantly smaller than the relative difference on the assembly powers.
Radial transfers in the dry region above the swell level
The vapour mass flux may be more or less homogenized at outlet of the two phase level. If significant differences exist between axial velocities, this creates a higher wall friction in high power assemblies and this may induce radial velocities from higher power to lower power assemblies. Even when velocity is radially homogeneous at a certain elevation, a higher power creates a lower vapour density inducing a higher velocity. As already explained (Bestion, 2015[2]), if the decreased gravitational pressure differences in high power region is larger than the increased axial friction pressure loss, there will be a gravity driven radial flow from colder assemblies to hotter assemblies, which is often called a “chimney effect”(see Figure 3). In the other case, a “divergent” radial flow establishes from higher power to lower power assemblies. A chimney effect tends to decrease the PCT and the divergent effect to increase the PCT by providing more
cooling or less cooling to the highest power assemblies. Other radial transfers exist which may be better identified by looking at the system of equations used in porous body approaches (See next paragraph). This includes:
Void dispersion: radial transfer of mass by dispersion forces related to flow fluctuations Momentum and energy molecular diffusion
Momentum and energy turbulent diffusion Momentum and energy dispersion
3. RADIAL TRANSFERS IN A CORE SEEN FROM THE SET OF EQUATIONS
The various sources of radial transfers in 3D models with a porous approach may be identified in the 2-fluid 3D system of equation (see Chandesris et al., [3,4] 2006, 2013):
𝜕𝜙𝛼𝑘𝜌𝑘 𝜕𝑡 + ∇. (𝜙𝛼𝑘𝜌𝑘𝑉𝑘) = 𝜙Γ𝑘 (1) 𝛼𝑘 𝜌𝑘(𝜕𝑉𝑘 𝜕𝑡 + 𝑉𝑘𝛻. 𝑉𝑘) +𝛼𝑘 𝛻𝑃 = (𝑝𝑖+ 𝑓𝑖 𝑇𝐷) 𝛻𝛼 𝑘∓ 𝜏𝑖+ 𝛼𝑘 𝜌𝑘𝑔 + 𝜏𝑤𝑘+𝜙1𝛻. (𝛼𝑘𝜌𝑘𝜏𝑘𝑡+𝑑) (2) 𝜕𝜙𝛼𝑘𝜌𝑘𝑒𝑘 𝜕𝑡 + ∇. (𝜙𝛼𝑘𝜌𝑘ℎ𝑘𝑉𝑘) = 𝜙q𝑘𝑖+ 𝑆𝑐q𝑤𝑘+ 𝜙Γ𝑘ℎ𝑘+ ∇. (𝛼𝑘𝑞𝑘 𝑡+𝑑) (3)
In these equations, 𝛼𝑘,𝜌𝑘,𝑉𝑘, 𝑒𝑘, ℎ𝑘 are the volume fraction, the density, the velocity, the internal energy and the enthalpy for the phase k, 𝜙 is the porosity, P the pressure, Γ𝑘 the interfacial mass exchange. 𝑝𝑖 and 𝑓𝑖𝑇𝐷are void dispersion terms due to space averaging of interfacial pressure forces, and time averaging
of drag and added mass forces. They tend to homogenize void fraction. 𝜏𝑖 𝑖𝑠 the interfacial friction force, 𝜏𝑤𝑘the wall friction force, q𝑘𝑖, q𝑤𝑘 the interfacial and the wall to phase k heat transfer, 𝑆𝑐 the heating surface, 𝜏𝑘𝑡+𝑑the stress tensor which accounts for turbulent and dispersive effects, and 𝑞
𝑘𝑡+𝑑the turbulent
and dispersive heat flux
Diffusion and dispersion terms
The momentum and energy dispersive and diffusive terms came out during the double (time and space) averaging process of the local convection terms:
< 𝑣𝑣̅̅̅ >𝑓=< 𝑣̅ >𝑓< 𝑣̅ >𝑓+< 𝑣′𝑣′̅̅̅̅̅ >𝑓+< 𝛿𝑣̅̅̅ 𝛿𝑣̅̅̅ >𝑓 (4) < 𝑣ℎ̅̅̅̅ >𝑓=< 𝑣̅ >𝑓< ℎ̅ >𝑓+< 𝑣̅̅̅̅̅ >′ℎ′
𝑓 +< 𝛿𝑣̅̅̅ 𝛿ℎ̅̅̅ >𝑓 (5)
𝑥 ̅is the time average of the quantity x and x’ the deviation from this average:
< 𝑥 >𝑓 is the spatial average of the quantity x and 𝛿𝑥 the deviation from this average
The first rhs terms of equations (4) and (5) are the macroscopic convection of the mean velocity and enthalpy, the second rhs terms are the turbulent diffusion of momentum and energy, and the third rhs terms are momentum and energy dispersion terms (see Drouin et al, 2010, [5]).
Chandesris et al. [4] synthesized the present status of modelling and validation of these momentum and energy diffusion and dispersion terms for a PWR core available on option in the CATHARE code. The macroscopic Reynolds stress tensor is modelled following the microscopic eddy-diffusivity concept. The dispersive momentum term can be modelled in a similar way introducing a dispersive momentum coefficient.
𝜏𝑘𝑡+𝑑 = (𝜈
𝑡𝑘𝜙 + 𝜈𝑑𝑘𝜙 ) [𝛻(𝜙𝑉𝑘) + 𝛻𝑇(𝜙𝑉𝑘) −23𝛻. (𝜙𝑉𝑘)𝐼] (6)
The macroscopic turbulent energy flux is modelled according to a generalized Fick’s law using a macroscopic turbulent thermal conductivity 𝛼𝑡𝑘𝜙. The dispersive heat flux can also be modelled using a first gradient hypothesis. Some models consider a thermal dispersive tensor 𝐷̿𝑑𝑘𝜙 to account for anisotropic geometries.
𝑞𝑘𝑡+𝑑= (𝛼𝑡𝑘𝜙𝐼 + 𝐷̿𝑑𝑘𝜙 ) 𝜙𝛻ℎ𝑘 (7) It was found that dispersive fluxes usually dominate the macroscopic turbulent heat flux by two or three
order of magnitude and that turbulent fluxes also dominate molecular fluxes. It is also clear that spacer grids play a dominant role on dispersion effects and that dispersion is highly geometry-dependant. The presence of mixing vanes is playing a dominant role.
The available models were obtained from 5x5 or at maximum 8x8 rod bundle data analysed at the sub-channel scale. In the same way as turbulent viscosity depends on the filter scale in single phase Large Eddy Simulation, diffusion-dispersion coefficients should depend on the spatial scale of the model. When a core is modelled with a porous-3D approach at a much larger scale (one assembly/ mesh, several assemblies/ mesh) than the sub-channel scale, the coefficients should be different. Today there is no general diffusion-dispersion model validated for every type of meshing and the applicability of current models to large scale nodalizations is not proved. There is a lack of data obtained in large dimension rod bundles with measurement of diffusion and dispersion effects. One can add that diffusion-dispersion of other scalar quantities such as boron concentration also needs validation.
Regarding the void dispersion term 𝑝𝑖 and 𝑓𝑖𝑇𝐷, which are related to spatial and temporal fluctuations of
pressure and velocity at the interface, Valette (2011[6]) proposed some models for core geometry based on PSBT and BFBT benchmark data analysis at the sub-channel scale. However extension of the models and validation to larger scale modelling is also required.
4. PERICLES-2D BOIL UP TESTS
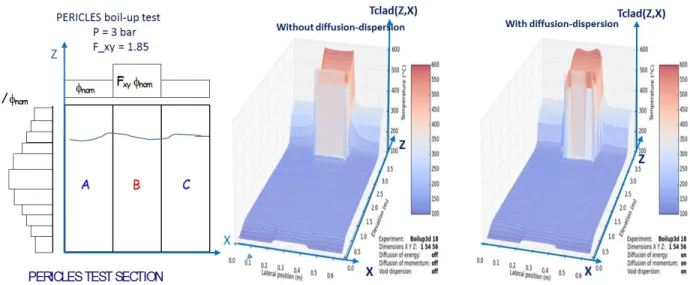
The PERICLES 2D experiment was carried out to study the effects of the radial power profile in a PWR core in both core uncovery and reflooding cases. The boil up tests investigate these effects in case of core uncovery. Steady state tests are performed with both transverse and axial power profile in a rectangular rod bundle test section. Three fuel assemblies are simulated by a set of 51x7 rods, representing almost 3 half 17X17 assemblies. Axial and radial power profiles are simulated (Figure 4). Subcooled water is injected at the bottom and a stationary swell level is obtained with a dry zone at the top. This simulates an accidental situation in a PWR with a core uncovery. The wall superheat in the dry zone must be accurately predicted by system codes for safety studies. The tests have shown that even with a rather steep transverse power profile, a quasi-perfect mixing is obtained in the wetted area with uniform swell level and void fractions. In the uncovered area, the transverse mixing is very low.
The CATHARE code is a French system code for nuclear reactor thermalhydraulics developed at CEA with the support of EDF, AREVA and IRSN. It can model any light water reactor or test facilities using several available modules. A Three-dimensional module is available for modeling the pressure vessel. It was used to validate the CATHARE code against PERICLES 2D boil up tests (Morel & Bestion, 1999, [7], Morel et al., 2000[8]). No diffusion nor dispersion of mass momentum and energy was used in these calculations. The mixing below the swell level is due to natural convection recirculating flows. More vapor being produced in the hot assembly than in the cold assemblies, differences in mixture density create this recirculation and the transverse pressure losses may be a limitation to these cross-flows. In the calculation, it was observed that there is not a stationary pattern of recirculation cells but fluctuating cells without any instantaneous symmetrical behavior. Only time averaged quantities respect the symmetry of the experiment. The efficiency of these recirculations in homogenizing the void fraction may depend on the transverse pressure losses. However sensitivity tests did not show a very high sensitivity of the value of these pressure losses. Anyway, the absence of turbulent diffusion and momentum dispersion term did not prevent from a good prediction of the void fraction. In such a porous medium, heat and momentum transfers with the internal structures are probably of a higher order of magnitude than turbulent transfers of heat and momentum.
In the dry zone, vapor and rod temperatures were well predicted by the code. As a first approximation, they correspond to the heat transfers obtained by assuming that the vapor mass flux is uniform at the swell level (even when there is a transverse power profile) and that there is no significant mixing in this area. Heat transfer in this zone is mainly wall to vapor forced convection modelled by the Dittus-Boelter correlation. The validity of the model is extended to the present calculations with a transverse power profile. Cross-flows in this area are not playing a significant role. Here also, the absence of turbulent diffusion of momentum and heat was not a problem.
More recently the same tests were revisited by Torsti Alku (2016, [9]) with CATHARE-3 2D calculations using a subchannel analysis and using the diffusion and dispersion models developed and validated by Chandesris et al. [4]. Figure 4 below shows the predicted clad temperature as a function of lateral (X) and vertical (Z) coordinates with and without diffusion and dispersion terms in one boil up test at P=3 bar, with a central assembly B having a power 1.85 times higher that lateral assemblies A and C.
Figure 4: CATHARE-2D simulations of a PERICLES 2D boil up test using sub-channel modelling with and without diffusion-dispersion terms
One can observe in the simulation without diffusion-dispersion terms small effects of crossflows. Since axial pressure losses are a little higher in central assembly B compared to lateral assemblies A &C, the lateral clad temperatures profile in B shows a minimum in the center and maxima at lateral rods. This is the result of some lateral flow from B to A and C which induces a loss of axial velocity, a higher steam temperature Tv and a higher clad temperature. The dry zone is rather short in this test and the decrease of mass flux seems to have affected only the most lateral sub-channels of central assembly. In A and B the sub-channels close to B have higher clad temperatures than the other sub-channels. Although they receive more flowrate coming from B, the cooling is less efficient since the vapour coming from B is already heated at a higher temperature. In the calculation with all diffusion-dispersion terms, some simple smoothing is clearly visible. There may be a somewhat larger zone of influence of the neighbouring assembly since momentum dispersion is added to crossflows to produce some homogenization of axial velocity. The effect of diffusion-dispersion effects on the maximum clad temperature does not seem to be very high at least in this case. Let’s call m of Figure 5 the mixing layer thickness between two unequally heated assemblies, assuming they are almost equal for momentum and energy. This thickness is the combined effects of crossflows, diffusion and dispersion effects. m/2 may be the penetration depth of the influence of the neighbouring assembly which can only be predicted by the sub-channel analysis. A coarse modelling with lateral space averaging over the dimension of the assembly can predict some crossflow and could model in principle some diffusion-dispersion but it can only predict the effect on the space averaged velocity and
space-average vapour temperature. As a consequence, only a space-average clad temperature can be predicted in an assembly although safety analysis require the knowledge of the maximum clad temperature. Attention should be paid in a LOCA simulation with one mesh per assembly to take into account the difference between the PCT and the average clad temperature at least in the uncertainty quantification. In this situation of figure 4, the dry zone is short and m/2 is rather narrow. In case of higher crossflows one may expect a larger penetration depth and smaller clad temperature differences within each assembly.
Figure 5: Illustration of the mixing layer thickness m for momentum and energy between
two unequally heated assemblies in the dry zone.
One could conclude from these simulations that all radial transfers in the dry zone including cross-flows and diffusion-dispersion have a low effect on PCT and that a simple modelling with one mesh per assembly is fully adapted to predict such core uncovery. However this may not be extrapolated to other test conditions. These PERICLES-2D tests only investigated low pressure conditions, with a rather high swell level and a homogeneous inlet mass flux in hot (B) and cold (A&C) assemblies. If an upstream lower plenum was used, there could have been very different inlet mass fluxes as some simulations have shown. Also the pressure range creates crossflows from hot to cold assemblies on a short distance. At higher pressure, the same flowrates produce lower velocities and lower friction pressure losses in comparison to gravitational pressure differences. The crossflow may be qualitatively and quantitatively very different with possible chimney effects and a larger radial penetration depth of the influence of the neighbouring assembly by diffusion-dispersion and crossflows.
5. SIMPLIFIED SIMULATIONS IN THE DRY ZONE
In order to better identify the various situations, some simulations of only the dry zone for a swell level at mid-core elevation (1.825m) of two assemblies having different power are done at various pressures and with equal or different vapor flowrates at swell level. Power corresponds to an average power of 3%NP (nominal power) and a flat axial power profile is assumed to simplify the analysis. A ratio of 1.4 is taken between the hot (right) and the cold (left) assembly.
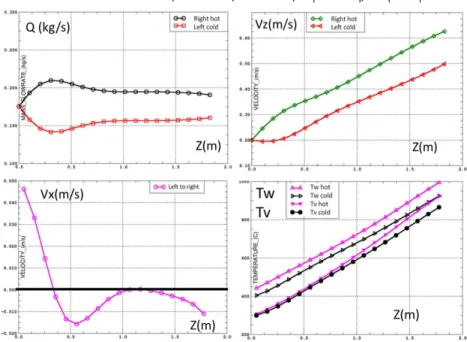
Figure 6 shows results obtained at a pressure of 7 MPa, with equal inlet flowrates. One can see a chimney effect above the swell level which increases the flowrate in the hot assembly. This corresponds to a lower gravitational in hot assembly where the vapour density becomes lower than in cold assembly. However increasing the flowrate increases the friction pressure loss and at level 0.35m above swell level, axial pressure losses are equalized and transverse velocity is zero. Then a reverse crossflow from cold to hot
assembly takes place which keeps smaller values. The two axial flowrates keep a difference of about +/- 11% . The maximum ratio of radial to axial velocity Vx/Vz is about 0.29 corresponding to an angle 16° of velocity vector with rod axis. This crossflow reduced the vapour and wall temperature overheating difference between assemblies to about 10% for a 40% difference in power. The crossflow from cold to hot assembly has two homogenizing effects: the hot assembly receives more coolant and colder coolant.
Figure 6: Simulation of vapour flow above a swell level in two assemblies with 40% power difference. Mass flowrates in both assemblies (top left), axial velocity (top right) and radial velocity
(bottom left). Wall and vapor temperatures (bottom right) versus elevation Z. P=7 MPa
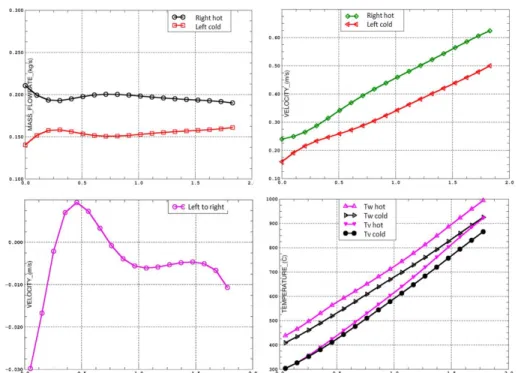
Figure7: Simulation of vapour flow above a swell level in two assemblies with 40% power difference. Mass flowrates in both assemblies (top left), axial velocity (top right) and radial velocity
(bottom left). Wall and vapour temperatures (bottom right) versus elevation Z. P=1MPa Figure 7 shows quite different results of the same situation but at 1 Mpa. The velocities are higher and friction pressure losses are larger than gravity pressure differences. Any heating increases the pressure loss
and there is a continuous small crossflow from hot to cold assembly which induces a big difference in the vapour and wall overheating. The two axial flowrates reach a maximum difference of about +/- 9% at the top of the heating zone. The maximum ratio of radial to axial velocity Vx/Vz is about 0.016 corresponding to an angle 1° of velocity vector with rod axis. This small crossflow creates a vapour overheating difference between assemblies of about 43% for a 40% difference in power. The vapor temperatures behave almost as if there was no crossflow. The hot assembly temperatures are not much higher than without crossflow since it loses coolant flowrate but also it sends some energy to the fluid of the neighbour assembly, which compensates. The cold assembly receives more coolant but a heated coolant.
Figure 8: Simulation of vapour flow above a swell level in two assemblies with 40% power difference and 40% flowrate difference. Mass flowrates in both assemblies (top left), axial velocity
(top right) and radial velocity (bottom left). Wall and vapor temperatures (bottom right) versus elevation Z. P=7MPa
Figure 8 shows a situation similar to Figure 6 but with 40% difference in upstream flowrates: +20% in hot assembly and -20% in cold assembly. It is interesting to note that crossflows are first from hot to cold then are reversed and come back to low positive and negative values. At the end the flowrate repartition is almost the same as in the case with equal inlet flowrates. The temperature differences in hot and cold assemblies also are very close to the case of equal inlet flowrates.
6. GOVERNING PROCESSES CREATING CROSSFLOWS In a single-phase situation in a steady situation momentum equations are:
𝜌(𝑉𝛻. 𝑉) + 𝛻𝑃 = − 𝜌𝑔 + 𝜏𝑤+1 𝜙𝛻. (𝜌𝜏𝑡+𝑑) 𝜌 (𝑉𝑧 𝜕𝑉𝑧 𝜕𝑧 + 𝑉𝑥 𝜕𝑉𝑧 𝜕𝑥) + 𝜕𝑃 𝜕𝑧 = 𝜌𝑔 − ( 𝐾𝑆𝐺𝑧 ∆𝑧𝑆𝐺+ 4 𝐷ℎ𝑧𝐶𝑓𝑧) 𝜌 𝑉𝑧2 2 + 𝜇𝑡𝑑 𝜕2𝑉 𝑧 𝜕𝑥2
𝜌 (𝑉𝑥𝜕𝑉𝑥 𝜕𝑥 + 𝑉𝑧 𝜕𝑉𝑥 𝜕𝑦) + 𝜕𝑃 𝜕𝑥 = − ( 𝐾𝑅𝑂𝐷𝑥 𝑝 + 4 𝐷ℎ𝑥𝐶𝑓𝑥) 𝜌 𝑉𝑥2 2 + 𝜇𝑡𝑑 𝜕2𝑉 𝑥 𝜕𝑧2 𝐾𝑒𝑓𝑓𝑧 = 𝐿𝑍 (𝐾𝑆𝐺𝑧 ∆𝑧𝑆𝐺+ 4 𝐷ℎ𝑧𝐶𝑓𝑧) ; 𝐾𝑒𝑓𝑓𝑥= 𝐿𝑋 ( 𝐾𝑅𝑂𝐷𝑥 𝑝 + 4 𝐷ℎ𝐶𝑓𝑥)
𝐿𝑍 is height of core, 𝐿𝑋 the size of an assembly, ∆𝑧𝑆𝐺 is the distance between spacer grids (0.52 m), 𝐾𝑆𝐺𝑧 (1) is the pressure loss coefficients for vertical flow through one spacer grid and 𝐾𝑅𝑂𝐷𝑥 is the pressure loss coefficients for horizontal flow through one raw of rods. p is the pitch of the rod array (p 12.5 mm in PWR), Vo and o are reference vertical velocity and vapour density at bottom of dry zone. Due to thermal expansion the density may be decreased by a factor 3 (from simulations of chapter 5) along the core height. The estimations of the order of magnitude of the respective terms of the axial momentum equation are made using –when necessary- results of simulation of Figure 6 at P=7MPa.
𝜌 (𝑉
𝑥𝜕𝑉𝜕𝑥𝑥) ≅ (
𝜌𝜌𝑜 1− 1)
𝜌𝑜𝑉𝑜2 𝐿𝑍≅ 1 𝜌
𝑜𝑉𝑜
2𝜌 (𝑉
𝑧𝜕𝑉𝜕𝑦𝑥) ≅
0.2∗0.160.22𝜌
𝑜𝑉𝑜
2≅ 0.15 𝜌
𝑜𝑉𝑜
2Estimation of the friction terms in vertical momentum equation (assuming Blasius law):
𝐾𝑒𝑓𝑓𝑧 𝐿𝑍
𝜌
𝑉2 2= 𝜌 (
𝐾𝑆𝐺𝑧 ∆𝑧𝑆𝐺+
4 𝐷ℎ𝑧𝐶
𝑓𝑧)
𝑉𝑜2 2≅ 5 𝜌
𝑜𝑉𝑜
2As mentioned by Chandesris et al.[4], the momentum diffusion-dispersion term is often obtained from the energy diffusivity term transposed to momentum diffusivity using a macroscopic Prandtl number close to unity.
The following expressions were used: 𝜇𝑡𝑑 = 𝐴 𝜌𝑘𝑂.5𝐷ℎ with : 𝑘 = 0.0367 𝑉2𝑅𝑒−1/6
Energy diffusivity being fitted on PSBT data (A=0.5) characteristic of a typical PWR rod bundle the momentum dynamic equivalent viscosity is 𝜇𝑡𝑑 ≅ 0.015 and consequently:
𝜇𝑡𝑑𝜕2𝑉𝑧 𝜕𝑥2 ≤ 𝜇𝑡𝑑 0.2𝑉𝑜 0.22 ∗ 0,22= 𝜇𝑡𝑑 0.2 0.22 ∗ 0,22𝐺𝑜
𝜌
𝑜𝑉𝑜
2 ≅ 0.01𝜌
𝑜𝑉𝑜
2The evaluation of diffusion-dispersion indicates that they are most often smaller than friction or gravity terms. The contribution from radial advection term is small but the axial acceleration term is not negligible but smaller than the two dominant terms which are the friction and the gravity terms
The ratio of friction term to gravity term is: 𝐹1=𝐾𝑒𝑓𝑓𝑧𝑉
2
2𝑔𝐿𝑍 . It is 0.01 at bottom of the dry zone and increases
by a factor 8 when Tv reaches 800°C since gravity term decreases and friction term increases.
When two neighbouring assemblies have different power, the density decrease by thermal expansion are different and the axial pressure gradient are different creating crossflows. As already pointed by Bestion [2], if the mass flux is uniform at exit of a swell level, the value of F1 gives the direction of the crossflow just at the beginning of the dry zone:
F1<1: chimney effect and F1>1 : divergent crossflow.
However the simulations above show that the crossflow evolution with elevation depends on the relative axial variations of the assembly flowrates and on the pressure range. There may be several change of directions of the crossflow along the core height. For similar mass flux, F1 is larger at lower pressure. The chimney effect dominates at high pressure such as P=7MPa whereas the divergent effect dominates at P=1MPa.
7. REVIEW OF PHENOMENA AND VALIDATION BASIS
Considering the use of system codes with 3D modelling of the core for safety demonstration a Best-Estimate Plus Uncertainty (BEPU) approach requires that all processes are identified, modelled and that uncertainty
ranges are known. Several 3D phenomena are identified which may have a significant effect on peak clad temperature during a SBLOCA or a IBLOCA.
1. The interfacial friction below a swell level controls the swell level for a given collapsed level. A higher interfacial friction induces a higher swell level which induces a higher vapour flowrate in the dry zone. This higher flowrate combined with a shorter dry zone and a higher heat transfer coefficient provide three reasons of minimizing the PCT. Many data sources were used for developing and validating the interfacial friction models but the uncertainty remains rather high. More accurate models could decrease the uncertainty of PCT related to uncertainty on interfacial friction. This may require new experiments with advanced instrumentation and a better identification of the two-phase flow regime to provide more physically-based models.
2. The radial power differences between assemblies create differences in steam quality in the two-phase region which create natural circulation mixing close to perfect mixing. However a non-perfect mixing will create a higher vapour flowrate to cool the higher power rods. This positive effect can only be precisely predicted if an accurate modelling of transverse pressure losses and interfacial friction for non-axial flow in rod bundles is available, but separate effect data are still required to validate the existing models. Without validation a high uncertainty range – such as a multiplying factor in the range 0.1 to 10 - has to be used in current models.
3. The radial power differences between assemblies create differences in vapour density in the dry zone which create differences in gravitational and friction axial pressure losses. Depending on the relative weight of gravity and friction, there may be chimney type crossflows from cold to hot assemblies (if pressure is rather high) or divergent flow from hot to cold assemblies (at lower pressures). These crossflows have a very significant effect on the PCT. A precise prediction of such crossflows requires an accurate prediction of axial and radial pressure losses in rather low Reynolds numbers and with an angle up to 20° between the velocity and the rods. New experiments with accurate measurements are required. In the current absence of validation of transverse pressure losses, a high uncertainty range – such as a multiplying factor in the range 0.1 to 10 - has to be used in current models.
4. The radial differences in vapour velocity and temperature between neighbouring assemblies induce radial diffusion and dispersion of heat and momentum which tend to flatten the radial profiles. Some validated models exist at the sub-channel scale which were used to simulate boil-up tests at low pressure (3 bar). Their effect on vapour and rod temperatures were small in conditions where crossflows were rather small from hot to cold assemblies. It is expected to be masked in higher pressure conditions when crossflow are higher -as found in the simple simulations of section 5 and larger mixing layer m are expected.
8. CONCLUSIONS AND PERSPECTIVES
The objective of modelling a PWR with one mesh par assembly for LOCA simulation is achievable and is able to predict important phenomena like crossflows in two-phase region and in a dry zone in case of core uncovering. Diffusion and dispersion phenomena are of second order importance compared to crossflows which are governed by differences in axial pressure drop due to differences in density created by power differences in neighbouring assemblies. Rather high uncertainty ranges still have to be taken for some of the sensitive phenomena and specific experiments with the following capabilities could provide a more accurate validation of this core modelling and would probably allow a significant reduction of the resulting uncertainty ranges:
1. Wall friction and singular pressure losses in two-phase flow in presence of axial and radial velocity in conditions encountered below a swell level
2. Interfacial friction for a flow with a radial velocity component in conditions encountered below a swell level
3. Wall friction and singular pressure losses in single-phase flow in presence of axial flow in the range of Reynolds numbers encountered in pure vapor flow above a swell level (1000 to 10000)
4. Wall friction and singular pressure losses in single-phase flow in presence of axial and radial flow (Vx/Vz up to about 20%) in the range of Reynolds numbers encountered in pure vapor flow above a swell level
5. Radial diffusion-dispersion of a passive scalar in absence of crossflow. 6. Radial diffusion-dispersion of momentum.
An experimental program METERO-S is in progress at CEA-Saclay to provide the above information. In addition to this validation, the use of a multi-scale approach with some sub-channel modelling of prototypic conditions can provide a useful support to the modelling with a quantification of diffusion-dispersion effects and an estimation of the uncertainty on PCT related to the coarse nodalization which does not predict differences between external and central rods in presence of mixing phenomena.
REFERENCES
1. R. Prea, V. Figerou, A. Mekkas, A. Ruby, CATHARE-3: a first computation of a 3-inch break loss-of-coolant accident using both cartesian and cylindrical 3D meshes modelling of a PWR vessel, NURETH-17, Xian, china, Sept 3-8, 2017
2. D. Bestion, L Matteo, “Scaling considerations about LWR core thermalhydraulics”, NURETH-16, Chicago, IL, USA, August 30-September 4, 2015
3. M. Chandesris, G. Serre, P. Sagaut, “A macroscopic turbulence model for flow in porous media suited for channel, pipe and rod bundle flows”, Int. J. Heat Mass Transfer, 49, 2739-2750, 2006.
4. M. Chandesris, M. Mazoyer, G. Serre and M. Valette, “Rod bundle thermalhydraulics mixing phenomena: 3D analysis with CATHARE 3 of various experiments”, NURETH15, Pisa, Italy, May 2013.
5. M. Drouin, O. Grégoire, O. Simonin, A. Chanoine, “Macroscopic modeling of thermal dispersion for turbulent flows in channels“, Int. J. of and Mass Transfer, 53 (2010), 2206-2217.
6. M. Valette, “PSBT simulations with Cathare 3”, NURETH-14, Toronto, Canada, September 25-30, 2011
7. C. Morel, D. Bestion, “Validation of the Cathare code against Pericles 2D boil up tests”, NURETH-9, Oct 99, San Francisco
8. C. Morel, D. Bestion, G. Serre, & I. Dor, “Application of the 6-equation Cathare 3-D module to complex flows in a reactor core under core uncovery and reflooding conditions”, AMIF-ESF Workshop on Computing methods for Two-phase Flow, Aussois, Jan 12-14, 2000
9. Torsti Alku, Modelling of turbulent effects in LOCA conditions with CATHARE-3, Nuclear Engineering and Design, in press, (2016)