HAL Id: inserm-01511474
https://www.hal.inserm.fr/inserm-01511474
Submitted on 21 Apr 2017HAL is a multi-disciplinary open access archive for the deposit and dissemination of sci-entific research documents, whether they are pub-lished or not. The documents may come from teaching and research institutions in France or abroad, or from public or private research centers.
L’archive ouverte pluridisciplinaire HAL, est destinée au dépôt et à la diffusion de documents scientifiques de niveau recherche, publiés ou non, émanant des établissements d’enseignement et de recherche français ou étrangers, des laboratoires publics ou privés.
Voxel-based mapping of grey matter volume and glucose
metabolism profiles in amyotrophic lateral sclerosis
Marie-Sonia Buhour, Franck Doidy, Audrey Mondou, Alice Pélerin, Laurence
Carluer, Francis Eustache, Fausto Viader, Béatrice Desgranges
To cite this version:
Marie-Sonia Buhour, Franck Doidy, Audrey Mondou, Alice Pélerin, Laurence Carluer, et al.. Voxel-based mapping of grey matter volume and glucose metabolism profiles in amyotrophic lateral sclerosis. EJNMMI Research, SpringerOpen, 2017, 7 (1), pp.21. �10.1186/s13550-017-0267-2�. �inserm-01511474�
V
OXEL-
BASED MAPPING OF GREY-
MATTER VOLUME AND GLUCOSEMETABOLISM PROFILES IN AMYOTROPHIC LATERAL SCLEROSIS
M-S Buhour, F Doidy, A Mondou, A Pélerin, L Carluer, F Eustache, F Viader*, B Desgranges* Normandie Univ, UNICAEN, EPHE, INSERM, U1077, CHU de Caen, Neuropsychologie et Imagerie de la
Mémoire Humaine, 14000 Caen, France
*Those authors have equally contributed
Corresponding author: B. Desgranges
email: beatrice.desgranges@unicaen.fr,
Tel.: +33 (0)231568381,
Abstract
Background Amyotrophic lateral sclerosis (ALS) is a rapidly progressive disease of the nervous system involving both upper and lower motor neurons. The patterns of structural and metabolic brain alterations are
still unclear. Several studies using anatomical MRI yielded a number of discrepancies in their results and a
few PET studies investigated the effect of ALS on cerebral glucose metabolism. The aim of this study was
threefold: to highlight the patterns of grey-matter (GM) atrophy, hypometabolism and hypermetabolism in
patients with amyotrophic lateral sclerosis (ALS), then to understand the neurobehavioral significance of
hypermetabolism and finally to investigate the regional differences between the morphologic and functional
changes in ALS patients, using a specially designed voxel-based method.
Methods Thirty seven patients with ALS and 37 age and sex-matched healthy individuals underwent both structural MRI and 18[F] - fluorodeoxyglucose (FDG) PET examinations. PET data were corrected for
partial volume effects. Structural and metabolic abnormalities were examined in ALS patients compared
with control subjects using two-sample t-tests in SPM. Then, we extracted the metabolic values of clusters
presenting hypermetabolism to correlate with selected cognitive scores. Finally, GM atrophy and
hypometabolism patterns were directly compared with a one paired t-test in SPM.
Results We found GM atrophy as well as hypometabolism in motor and extra motor regions and hypermetabolism in medial temporal lobe and cerebellum. We observed negative correlations between the
metabolism of the right and left parahippocampal gyri and episodic memory, and between the metabolism of
right temporal pole and affective theory of mind. GM atrophy predominated in the temporal pole, left
hippocampus and right thalamus, while hypometabolism predominated in a single cluster in the left frontal
superior medial cortex.
Conclusions Our findings provide direct evidence of regional variations in the hierarchy and relationships between GM atrophy and hypometabolism in ALS. Moreover, the 18FDG-PET investigation suggests that
cerebral hypermetabolism is deleterious to cognitive function in ALS.
Keywords: amyotrophic lateral sclerosis, magnetic resonance imaging, positron emission tomography,
BACKGROUND
Amyotrophic lateral sclerosis (ALS) is a neurodegenerative disease that primarily affects motor
function, but also concerns extramotor systems. The degeneration of the motor system typically involves
both upper motor neurons located in the primary motor cortex, and lower motor neurons from the brainstem
nuclei and anterior horns of the spinal cord. The disease has a uniformly fatal outcome as a result of muscle
weakness, with median survival of 2-4 years (1). The underlying pathophysiology is poorly understood and
effective treatments are still needed for this neurodegenerative disease.
There is increasing awareness that ALS is a clinically heterogeneous disease (2). There is also a
general recognition that ALS patients commonly present deficits in executive functions but also memory
(3,4) and social cognition with impairment of both cognitive and affective theory of mind (5–7).
Magnetic resonance imaging (MRI) of the brain and spinal cord is routinely used in the diagnostic
work-up of ALS, to rule out various pathological conditions that may masquerade as motor neuron disease,
but rarely gives specific clues to the positive diagnosis. Automated techniques for analysing MRI images
have been developed notably with statistical parametric mapping (SPM) software to carry out
voxel-by-voxel analysis of the whole brain (voxel-by-voxel-based morphometry, VBM). Most of the studies, have reported
extensive GM atrophy, not confined to motor areas (8).
Positron emission tomography (PET) combined with 18F-fluorodeoxyglucose (FDG), a specific
radiotracer for glucose metabolism, indicates glucose uptake by astrocytes and neurons (9) and reveals local
brain activity. Early studies found reduced regional cerebral glucose utilization in patients with ALS, (10)
mostly in the frontal cortex but also in other cortical territories such as the superior occipital cortex (11).
More recently, other authors, adopting a voxel-by-voxel approach (12–16), have observed severe
hypometabolism in the premotor cortex, postcentral gyrus, prefrontal cortex, lingual gyrus, fusiform gyrus
and thalamus. They also observed an increased cerebral glucose metabolism or hypermetabolism in the
medial temporal lobe, the cerebellum, the occipital cortex and brainstem. This hypermetabolism has been
proposed as a possible biomarker for ALS by Pagani and colleagues (13). It is not yet known, however,
is important to note that the limited PET camera resolution can give rise to partial volume effects (PVEs)
that result in blurring and, therefore, an underestimation of regional activity, particularly in small structures
or those with volume loss. Since previous FDG-PET studies did not correct for PVEs, the metabolic
abnormalities observed in patients with ALS have to be interpreted cautiously.
The above-mentioned studies investigated different groups of nondemented patients with ALS using
either brain MRI or FDG-PET (without correction for PVEs). Only one combined these two techniques in a
single group of 18 patients with ALS who met the Neary criteria for frontotemporal dementia (FTD) (17).
The authors assessed brain GM structural changes using VBM, and metabolic changes using FDG-PET.
They concluded that the metabolic changes corresponded to the structural changes, with a few exceptions.
To our knowledge, no combined assessment of GM volume and regional cerebral metabolism has yet
been carried out in nondemented patients with ALS. The goals of the present study were threefold: 1)
determine both GM volume and glucose metabolism changes in a sample of patients with ALS by adopting
a voxel-based approach; 2) further study the clinical significance of hypermetabolism, by assessing its
relationship with selected cognitive scores; and 3) carry out a direct voxelwise comparison of the degrees of
local GM atrophy and hypometabolism throughout the brain, by using a specific processing technique
developed in our laboratory that has already been applied in early Alzheimer’s disease (18), alcoholism (19),
and the behavioural variant of FTD (20).
METHODS
Participants
Participants with ALS.
Participants were 37 patients with ALS (21 men and 16 women; mean age = 61.18 years, standard deviation
= 11.11; mean level of education = 10.03 years, standard deviation = 2.96) with either bulbar (n = 10) or
spinal (n = 27) onset. Patients with ALS were recruited between November 2009 and June 2014 via the ALS
speakers and had a minimum level of education equivalent to a now obsolete school-leaving certificate that
was generally taken at 14 years.. All the patients met the modified El Escorial criteria for probable or definite ALS (21). Exclusion criteria were the additional presence of severe and chronic illness, alcohol or drug abuse, traumatic brain injury, or an extremely severe communication problem that could seriously
compromise the administration of cognitive tests. None of the patients fulfilled the criteria for a diagnosis of
FTD according to the core and supportive diagnostic features of FTD detailed in Lund and Manchester’s
consensus statement (22). None of the patients with ALS met the criteria for a possible and/or probable
behavioural variant of FTD (23). Behavioural disorders were explored in 32 patients via the short form of
the Neuropsychiatric Inventory (24). None had behavioural disorders of the frontal type sufficiently severe
to meet the criteria for ALS with behavioural impairment. All the patients underwent a neurological
assessment that included the ALS Functional Rating Scale Revised (ALS-FRS-R) (25), Norris scale (26),
and Medical Research Council (MRC, 1976) Muscle Strength Scale. They were able to speak or to write
intelligibly. All the patients gave their written informed consent, and the independent regional ethics
committee approved the study. Some of these patients had already been included in a previous study (5).
The ALS patients underwent a neuropsychological assessment covering a range of cognitive functions (for
details, see (5)).
Control groups.
Neuroimaging
To compare the neuroimaging data, we included a group of 37 healthy controls (21 men and 16 women;
mean age = 61.11 years, standard deviation = 11.11; mean level of education = 11.45 years, standard
deviation = 2.97). Healthy controls were recruited from the community and performed in the normal range
on a neuropsychological examination assessing multiple domains of cognition including episodic and
semantic memory, executive and visuo-spatial functions, language and praxis. Within a few days from
recruitment, they also underwent a structural MRI and a PET using [18F] fluoro-2-deoxy-D-glucose
(18FDG). These controls were closely matched for sex, age, and level of education with the group of
Cognition
As most of our neuropsychological tests were original, with no available normative values, to compare the
cognitive scores, we included another group of 37 healthy subjects (21 men and 16 women; mean age =
61.81 years, standard deviation = 8.84; mean level of education = 11.19 years, standard deviation = 2.60).
The Mattis cut-off score was set at 130, to avoid the possible inclusion of controls with mild cognitive
impairment (for details, see Table 1).
Neuropsychological assessment
Patients and controls underwent a neuropsychological assessment that evaluated a set of cognitive functions
that were already described and published in a previous study (for details see (27)). In order to understand
the neurobehavioral significance of cerebral hypermetabolism, we only worked on cognitive scores that
could be related to brain regions showing hypermetabolism (see infra). This is why we chose to explore the
affective theory of mind abilities and the episodic memory of ALS patients. Affective theory of mind was
assessed with the Reading the Mind in the Eyes test derived from the procedure used by Baron-Cohen et al.
(2001) (28). The participants had to make inferences about the affective and motivational states of others on
the basis of a picture of their eyes (for more details see (29)). We then explored episodic memory, with a
task in which participants had to intentionally encode a list of eighteen unrelated words. Every three words,
they were subjected to an immediate free recall task. Following the study phase, there was a 20-second
interval during which participants were engaged in an unrelated distractor task. Participants then had to
recall as many words as possible, with no time-limit. After a 20-min interval, they were finally subjected to
a delayed free recall task, again with no time-limit.
Neuroimaging data acquisition
All participants were scanned using the same MRI and PET cameras at the Cyceron centre (Caen, France): a
Philipps Achieva 3.0 T scanner and a discovery RX VCT 64 PET-CT device (General Electric Healthcare,
respectively.
For each participant, a high-resolutionT1-weighted anatomical image was acquired on a Philips Achieva 3T
scanner using a three-dimensional fast field echo sequence (sagittal; repetition time = 20 ms, echo time = 4.6
ms, flip angle = 10°, 180 slices, slice thickness = 1 mm, field of view = 256 x 256 mm2, matrix = 256 x
256).
PET data.
Each participant underwent a PET examination the day after MRI examination. FDG scans were acquired on
a Discovery RX VCT 64 PET-CT device (GE Healthcare) with a resolution of 3.76 x 3.76 x 4.9 mm3
FWHM(axial field of view = 157 mm). Forty-seven planes were obtained with septa out (3D acquisition);
with a voxel size of 2.7 x 2.7 x 3.27 mm3. A CT transmission scan was performed for attenuation correction
before the PET acquisition. Participants were fasted for at least 6 hours before scanning. After a 30-minute
resting period in a quiet and dark environment, ~180 MBq of FDG were intravenously injected as a bolus. A
10-minute PET acquisition scan began 50 minutes after injection. During data acquisition, head motion was
continuously monitored with laser beams projected onto ink marks drawn on the forehead, which also served
to make any necessary corrections.
Neuroimaging data handling and transformation
Preprocessing
Using the VBM5.1 toolbox (http://dbm.neuro.uni-jena.de/vbm/vbm5-for-spm5/), implemented in
SPM5 software (Wellcome Trust Centre for Neuroimaging, London, UK), the raw MRI data were spatially
normalized to Montreal Neurological Institute (MNI) space (voxel size = 1 mm3, matrix = 156 x 189 x 157)
and segmented into GM, white matter (WM) and cerebrospinal fluid (CSF). The normalized GM images
were modulated by the Jacobian determinants to correct for nonlinear warping only, to obtain maps of local
GM volumes corrected for brain size.
FDG-PET data were first corrected for CSF and WM PVEs, using the voxel-by-voxel modified
Müller-Gartner method,(30,31) described in detail elsewhere(32) and already used in our laboratory.(18–20)
Using SPM5, the PVE-corrected PET data were then coregistered (rigid-body coregistration) to their
from the VBM protocol described above. The resulting images underwent quantitative scaling using mean
GM as a reference.
Smoothing
For the between-group comparison, and in order to blur individual variations in gyral anatomy and
increase the signal-to-noise ratio, the registered MRI data were smoothed using an 8 x 8 x 8 (x, y, z) mm
Gaussian kernel. PET datasets were also smoothed, using a 12 x 12 x 12 mm Gaussian kernel.
Differential Smoothing
For the direct comparison between GM atrophy and glucose hypometabolism, since the MRI and
PET data had different spatial resolutions, differential smoothing was applied to equalize the effective
smoothness (33, 47, 48). A Gaussian kernel of 8 x 8 x 8 (x,y,z) mm was used for the MRI data, and 7.1 x 7.1
x 6.4 for the PET data. Finally, images were masked to exclude non-GM voxels from the analysis.
W
-score maps
To obtain measurements of atrophy and hypometabolism expressed in the same units so that we
could undertake direct comparisons of the different modalities, we computed W-score maps for each patient
and each imaging modality, using the healthy control group as a reference. W scores are analogous to z
scores, but are adjusted for specific covariates (36)-age in the present case. The smoothed MRI and PET
data were used to create W-score maps [(raw value for each patient) - (value expected in the control group
for the patient’s age) / (SD for each patient and each modality); see (18) for more details].
As the two datasets had different original spatial resolutions, the MRI data were coregistered and resliced
into PET space to obtain images with the same dimensions.
Anatomical localization
GM anatomical localization was carried out using AAL automated labelling software implemented in
SPM5.(37) For further information about thalamic subdivision, we used the Talairach atlas.(38) We focused
on five major regions of the thalamus: medial dorsal nucleus, anterior and lateral ventral nuclei, posterior
Statistical Analyses
Between-group comparison of GM volume and metabolism
To determine the pattern of GM atrophy in the ALS group as well as glucose hypometabolism and
hypermetabolism, compared to the control group, we used a two-sample t test in SPM5. This yielded three
maps of statistically significant GM atrophy and metabolic abnormalities in patients relative to controls. To
address the issue of multiple comparisons, for each analysis, the significant cluster size was determined
using a Monte Carlo simulation program (AlphaSim) as previously done in our laboratory (39,40), with a
cumulative proportion criterion of less than .05 (41). For the GM volume analysis, this equated to a cluster
volume of 475 voxels and for the metabolism analyses a k= 113 voxels.
Correlations between hypermetabolism and selected cognitive scores
Statistical analyses were performed using Statistica 10.0 (StatSoft, Tulsa, OK, USA). The threshold
of significance was set at p = .05 (one-tailed). We assessed correlations between the metabolism of
significant clusters identified in the previous analysis showing hypermetabolism and selected cognitive tests.
To this end, we extracted the mean metabolic values of the regions presenting hypermetabolism using the “Binary ROIs analysis” in SPM5 and then entered them into Statistica to assess correlations with selected scores of the patients with ALS.
Within-group comparison between morphological and metabolic alterations
Individual GM MRI W scores maps and PET W scores maps were entered in a one-paired t test
analysis with one group (patients with AL) and two images per participant (i.e., MRI and PET W score
maps), using SPM5. We put years of education and Mattis (total score) as confounding covariates in this
analysis. Both contrasts were assessed (W-PET > W-MRI and W-MRI > W-PET) to generate statistical maps
reflecting predominant structural abnormalities or glucose hypometabolism. To address the issue of
multiple comparisons, significant cluster size was determined using a Monte Carlo simulation program
(AlphaSim), with a cumulative proportion criterion of less than .05 (41). This equated to a cluster volume of
RESULTS
Behavioral results
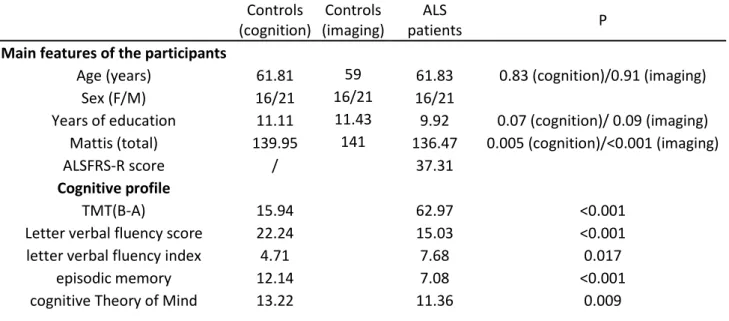
Regarding executive functions, compared with the control group, the patients exhibited significant
impairment of executive functions on the Trail-Making Test B-A (p < 0.001), letter verbal fluency score (p <
0.001), and letter verbal fluency index (p = 0.017). The same was true for both episodic memory, measured
with a classic word learning test (p < 0.001), and cognitive theory of mind, assessed with a false-belief task
(p = 0.009), with a trend for affective theory of mind, assessed with the Face/Eyes test (p = 0.062) for details
see Table 1). When comparing ALS patients with bulbar onset to those with spinal onset, we did not find
any difference in their cognitive status (data not shown).
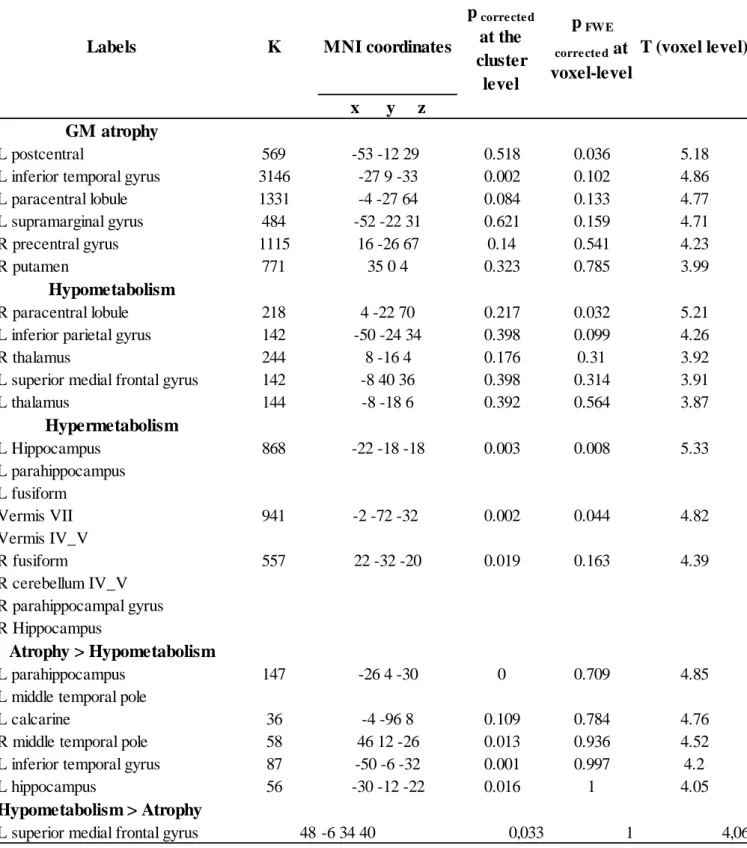
Patterns of grey matter atrophy and hypometabolism in ALS (see Fig. 1)
The comparison of GM volume between patients and controls revealed significant GM atrophy in the
left postcentral gyrus, the left inferior temporal gyrus, the left paracentral lobule and the left supramarginal
gyrus. We also found GM atrophy within the right precentral gyrus and the right putamen.
Hypometabolism mainly concerned the right paracentral lobule, the left inferior parietal gyrus, the
thalamus bilaterally as well as the left superior medial frontal gyrus.
Patients also showed hypermetabolism mainly in the cerebellar vermis (IV, V and VII), cerebellar
lobules IV and V, bilaterally within the medial temporal cortex (both hippocampus and parahippocampal
gyri) and, to a lesser extent, the fusiform gyrus. All the results are listed in Table 2.
In our quest to better understand this metabolic dysfunction and investigate its neurobehavioural
significance, we assessed the relationships between hypermetabolism and selected cognitive functions.
Given that the medial temporal lobe is involved in episodic memory, the cerebellum is part of a motor
network, and fusiform gyrus is involved in social cognition(42,43), we looked for positive or negative
correlations between the metabolism of each of these regions and the relevant (and available) cognitive
performances. All the significant correlations we found were negative. Thus, we observed significant
hippocampus (r = -0.36; p = 0.04), the left hippocampus (r = -0.36; p = 0.04) and the left parahippocampal
gyrus (r= -0.46; p=0.007). Concerning the delayed recall, we found significant negative correlations with the
metabolic values of the left parahippocampal gyrus (r=-0.45; p=0.01). We also found negative correlations
between metabolic activity within the left fusiform gyrus and TOM-15 (cognitive theory of mind) (r=-0.33;
p= 0.04) (Table 3).
Direct comparison between GM atrophy and hypometabolism in ALS patients
GM atrophy was greater than hypometabolism in the temporal lobes (left and right middle temporal
poles, left hippocampus and left parahippocampus as well as left inferior temporal gyrus). This was also true
in the left calcarine (Table 2).
The reverse contrast (hypometabolism > GM atrophy) only concerned the left superior medial frontal cortex.
DISCUSSION
To our knowledge, this was the first neuroimaging study to closely examine the relationship between
cerebral GM volume and glucose metabolism via a direct comparison of both parameters, as well as the
relationship between hypermetabolism and cognitive performance in patients with ALS. We first compared
GM volume and cerebral glucose metabolism in patients versus controls, via a two-sample t test. We found
1) marked GM atrophy in the right premotor cortex, but also in extramotor regions, 2) glucose
hypometabolism mainly in both thalamus and the parietal lobe, and 3) glucose hypermetabolism located
bilaterally in the cerebellar vermis, medial temporal lobe, and fusiform gyrus. We then extracted the
metabolic values of the main hypermetabolic clusters and correlated them with cognitive scores that were
expected to depend on these brain regions. We found only negative correlations, first, between the
hippocampus and left parahippocampus and episodic memory, and second between the left fusiform gyrus
and cognitive theory of mind. We also conducted a voxelwise comparison of the degrees of local atrophy
and hypometabolism, using a method specially designed for this purpose, and we observed that GM atrophy
predominated in the bilateral middle temporal pole and the left hippocampus, while hypometabolism
Between-group comparisons
The profile of GM atrophy in our patients was in agreement with previous studies that had reported
motor and extramotor GM atrophy in a parieto-temporal network (44–51), as well as the putamen (46,52–
54) .
The pathological involvement of the putamen in ALS may seem surprising, as patients do not
typically exhibit extrapyramidal signs. However, ubiquitin immunoreactive intracytoplasmic inclusions and
neuronal loss have been found in the striatonigral system in half of patients with classic motor neuron
disease (55). Interestingly, in the study of Kim et al., the putamen was among the most atrophied brain
regions in cognitively impaired ALS patients (54). Furthermore, the putamen has a major role in verbal
fluency, working memory and speech production (56), cognitive domains frequently impaired in ALS (57).
Finally, putaminal regions receive afferences from the motor, premotor cortices (53) all of which being
heavily affected in this study.
Concerning the hypometabolism, our results are in line with most previous studies (12–14,16).
Concerning the hypometabolism in the paracentral lobule, this result has rarely been found with 18FDG-PET.
Indeed, Kew et al., using C15O2 in 12 patients with ALS, observed a significant reduction of cerebral blood
flow at rest within this structure (58). Concerning the decreased uptake of 18FDG within the left inferior
parietal gyrus found in our sample of patients, PET studies using [11C]-flumazenil, or C15O2, (58–60), also
found reduced regional cerebral blood flow within the parietal lobe. We also found significantly lower
frontal metabolism (superior medial) in our patient group that is line with the fact that they present frontal
dysfunction. A study went further, showing that prefrontal hypometabolism was associated with reduced
clinical functioning in ALS patients (14). Decreased glucose uptake in the thalamus has also been reported
by Pagani et al., and is thought to be a metabolic signature of C9orf72-related ALS (61). Up to 10% of
patients with ALS have a mutated gene, the most common of which is C9orf72. In patients with this
mutation, the thalamic hypometabolism is slightly more marked than it is in sporadic ALS cases (14).
Our results confirm the brain hypermetabolism in ALS already demonstrated in previous studies (12–
mainly in agreement with previous studies that also observed increased glucose metabolism in the medial
temporal lobe and cerebellum (13,14).
Negative correlations with episodic memory and affective theory of mind
We observed significant negative correlations between episodic memory (immediate recall) and the
metabolic value of the right hippocampus, the left hippocampus and the left parahippocampal gyrus. We
also found negative correlations between metabolic activity within the left fusiform gyrus and cognitive
theory of mind. The negative correlation between metabolism and cognitive scores means that
hypermetabolism is associated with a functional deficiency of the involved brain area. Indeed, given that our
patients with ALS scored more poorly than controls for episodic memory as well as for cognitive theory of
mind, this result indicates that the abnormal pattern of glucose metabolism within these regions was not
associated with preserved performances. This result was not expected because generally, when studies found
hypermetabolism or hyperactivation, it is usually considered as the reflect of compensatory mechanisms
(62,63). However, within the framework of Huntington’s disease, a previous work has shown a link between
hyperactivation of the precuneus and impaired performances of motor sequence learning (64). In ALS, it
has been suggested that cerebral hypermetabolism reflects neuroinflammation, characterized by activated
astrocytes and microglia (16), rather than compensatory neuronal activity. Neuroinflammation has a
deleterious effect, and is therefore more consistent with the negative correlations we found in our patients
between metabolic data and relevant cognitive scores.
This finding further highlights the potential role of cerebral hypermetabolism as a functional imaging
marker for ALS.
Voxelwise comparisons between alterations
This analysis revealed differences in the relative degrees of GM atrophy and cerebral glucose
hypometabolism.
Greater atrophy than hypometabolism
Atrophy was greater than hypometabolism in three main regions: the temporal lobe (anterior, lateral
frontotemporal dementia or chronic alcoholism (18,20,65,66), it is generally thought that loss of brain cells
other than neurons might result in atrophy without associated hypometabolism. In ALS, an increasing
number of studies have suggested that astrocytosis and/or microglia activation could be involved in the
pathophysiology of the disease (67,68)
The finding of a normal, i.e. higher than expected, level of glucose metabolism in atrophic cerebral
zones may also suggests that compensatory mechanisms are at work in these structures, helping to maintain
a moderately high metabolic level relative to structural alterations-a hypothesis previously developed for Alzheimer’s disease (69). In this disease, according to the authors, the presence of abnormally phosphorylated tau proteins that aggregates to form neurofibrillary tangles, may be one of the processes
underlying severe atrophy and moderate hypometabolism in the hippocampus (69). In ALS, TDP-43
inclusions are located in neurons and astrocytes of ALS patients, not only in the motor regions, but also in
the temporal lobe (70). Following the same reasoning, the presence of TDP-43 could lead to a massive
neuronal loss whereas moderate hypometabolism could be explained by a compensation of the remaining
neurons.
Greater hypometabolism than GM atrophy
We found that hypometabolism was more severe than atrophy in the left superior medial frontal
cortex. This result suggests that ALS is characterized by genuine functional alterations (metabolic, chemical
or molecular) on top of the neuronal loss, heightening the functional consequences of local GM atrophy.
Supporting the notion of metabolic alterations in ALS, a study used the benzodiazepine GABAA marker 11
C-flumazenil to study brain dysfunction in 17 patients (60). Flumazenil is an antagonist at the benzodiazepine
subunit of the GABAA receptor. These authors found reduced binding of 11C-flumazenil in the dorsomedial
prefrontal cortex notably. This may reflect the downregulation of postsynaptic GABAA receptor expression
(60). Given that glucose metabolism reflects synaptic activity (71), the detrimental effects of ALS on
neurotransmission systems could explain why metabolic dysfunction precedes GM atrophy (e.g., within the
frontal lobe). Greater hypometabolism than GM atrophy has also been observed in the behavioural variant of
FTD (20), suggesting that this could be a remote effect of GM atrophy on metabolism, or a diaschisis.
connected to a damaged area. The medial prefrontal cortex is connected to limbic structures such as the
medial temporal lobe and putamen (72). The neuronal loss reflected by GM atrophy within the temporal
lobe and putamen (see above) may remotely affect the metabolism of the medial prefrontal cortex, though
possibly only for a limited period of time, as disconnected neurons eventually die, giving rise to different
patterns of brain volume and metabolic impairment.
The study has some limitations. The major one is the existence of two groups of healthy subjects.
Indeed, as our protocol did not include the neuroimaging examinations for healthy subjects, we used the
scans of healthy subjects of another protocol of our laboratory. Then, the threshold that we used in this
article is relatively liberal even if it has been employed in several MRI (47,51,73–78) or PET studies (14,16)
in ALS. However, with a more stringent threshold we could have missed some interesting findings. Finally,
this study should be replicated in a bigger group of ALS patients.
CONCLUSIONS
Taken together, our results confirm the existence of structural and metabolic changes in the brains of
patients with ALS without dementia. We found that regional cerebral hypermetabolism is associated to
impaired cognitive performance, which suggests that it reflects a local deleterious neuronal and/or astrocytic
process. Our findings also emphasize the complex relationships between GM atrophy and hypometabolism,
and the regional heterogeneity in their hierarchy. Greater GM atrophy than hypometabolism might mean
either that brain tissue loss does not involve metabolically active cells, or that the metabolism of the
remaining cells is higher than expected. Greater hypometabolism than GM atrophy could reflect either a
disconnection mechanism, or an early stage of metabolic neuronal failure preceding cell death. Longitudinal
Abbreviations
ALS: Amyotrophic lateral Sclerosis; ALS-FRS-R: ALS functional rating scale revised; CSF: cerebrospinal
fluid; FDG: 18F-fluorodeoxyglucose; FTD: Fronto-temporal dementia; GM: Grey matter; MRI: Magnetic
resonance imaging; PET: Positron emission tomography; PVE: Partial volume effect; SPM: Statistical
parametric mapping; VBM: Voxel-based morphometry; WM: White matter
Acknowledgments
The authors are grateful to B. Landeau and R. La Joie for their contribution and the Cyceron MRI-PET staff
members (C. Lebouleux, M.H. Noel, and M.C. Onfroy) for their help with patients and imaging examination
acquisition. The authors also wanted to thank S.Segobin for his valuable advices during the revision phase.
Competing of interests
The authors declare that they have no competing interests
Funding
This work was supported by the French Ministry of Health (PHRC, 2008, n° ID-RCB A01150-55) and Fondation pour la Recherche Médicale (FRM)
Authors’ contributions
MSB was actively involved in this study from design to drafting. She conducted all the statistical analyses
and played a central role in interpreting the results and writing the article. . FD greatly contributed to the
neuroimaging part of this study. AM and AP participated in the acquisition of the cognitive data, especially
in the careful screening of our cohort. FD, LC, and FE provided their critical revision of the manuscript. FV
and BD supervised and coordinated the teamwork from start to finish. Their knowledge and expertise in
neuropsychology, and ALS pathology were crucial for the design, analysis, and interpretation of the results
of this project. They were also particularly involved in the revising of the manuscript. All authors read and
Ethical approval
All procedures performed in studies involving human participants were in accordance with the
ethical standards of the institutional and/or national research committee and with the 1964 Helsinki
declaration and its later amendments or comparable ethical standards.
Author details
Normandie Univ, UNICAEN, EPHE, INSERM, U1077, CHU de Caen, Neuropsychologie et Imagerie de la
Bibliography
1. Chiò A, Calvo A, Moglia C, Mazzini L, Mora G, PARALS study group P study. Phenotypic heterogeneity of amyotrophic lateral sclerosis: a population based study. J Neurol Neurosurg Psychiatry. BMJ Publishing Group Ltd; 2011 Jul;82(7):740–6.
2. Turner MR, Hardiman O, Benatar M, Brooks BR, Chio A, de Carvalho M, et al. Controversies and priorities in amyotrophic lateral sclerosis. Lancet Neurol. 2013 Mar;12(3):310–22.
3. Machts J, Bittner V, Kasper E, Schuster C, Prudlo J, Abdulla S, et al. Memory deficits in amyotrophic lateral sclerosis are not exclusively caused by executive dysfunction: a comparative neuropsychological study of amnestic mild cognitive impairment. BMC Neurosci. BioMed Central; 2014;15(1):83.
4. Ringholz GM, Appel SH, Bradshaw M, Cooke NA, Mosnik DM, Schulz PE. Prevalence and patterns of cognitive impairment in sporadic ALS. Neurology. 2005 Aug 23;65(4):586–90.
5. Carluer L, Mondou A, Buhour M-S, Laisney M, Pélerin A, Eustache F, et al. Neural substrate of cognitive theory of mind impairment in amyotrophic lateral sclerosis. Cortex. 2015;65:19–30.
6. Girardi A, Macpherson SE, Abrahams S. Deficits in emotional and social cognition in amyotrophic lateral sclerosis. Neuropsychology. 2011 Jan;25(1):53–65.
7. Cerami C, Dodich A, Canessa N, Crespi C, Iannaccone S, Corbo M, et al. Emotional empathy in amyotrophic lateral sclerosis: a behavioural and voxel-based morphometry study. Amyotroph Lateral Scler Frontotemporal Degener. 2014 Mar;15(1–2):21–9.
8. Shen D, Cui L, Fang J, Cui B, Li D, Tai H. Voxel-Wise Meta-Analysis of Gray Matter Changes in Amyotrophic Lateral Sclerosis. Front Aging Neurosci. Frontiers Media SA; 2016 Mar 30;8.
9. Nehlig A, Coles JA. Cellular pathways of energy metabolism in the brain: is glucose used by neurons or astrocytes? Glia. 2007 Sep;55(12):1238–50.
10. Dalakas MC, Hatazawa J, Brooks RA, Di Chiro G. Lowered cerebral glucose utilization in amyotrophic lateral sclerosis. Ann Neurol. 1987 Nov;22(5):580–6.
11. Ludolph AC, Langen KJ, Regard M, Herzog H, Kemper B, Kuwert T, et al. Frontal lobe function in amyotrophic lateral sclerosis: a neuropsychologic and positron emission tomography study. Acta Neurol Scand. 1992 Feb;85(2):81–9.
12. Cistaro A, Valentini MC, Chiò A, Nobili F, Calvo A, Moglia C, et al. Brain hypermetabolism in amyotrophic lateral sclerosis: a FDG PET study in ALS of spinal and bulbar onset. Eur J Nucl Med Mol Imaging. 2012 Feb;39(2):251–9.
13. Pagani M, Chiò A, Valentini MC, Öberg J, Nobili F, Calvo A, et al. Functional pattern of brain FDG-PET in amyotrophic lateral sclerosis. Neurology. 2014 Sep 16;83(12):1067–74.
14. Van Laere K, Vanhee A, Verschueren J, De Coster L, Driesen A, Dupont P, et al. Value of 18fluorodeoxyglucose-positron-emission tomography in amyotrophic lateral sclerosis: a prospective study. JAMA Neurol. 2014 May;71(5):553–61.
15. Canosa A, Pagani M, Cistaro A, Montuschi A, Iazzolino B, Fania P, et al. 18F-FDG-PET correlates of cognitive impairment in ALS. Neurology. 2015 Nov 20;86(1):44–9.
16. Van Weehaeghe D, Ceccarini J, Delva A, Robberecht W, Van Damme P, Van Laere K. Prospective Validation of 18F-FDG Brain PET Discriminant Analysis Methods in the Diagnosis of Amyotrophic Lateral Sclerosis. J Nucl Med. Society of Nuclear Medicine; 2016 Aug 1;57(8):1238–43.
17. Rajagopalan V, Pioro EP. Comparing brain structural MRI and metabolic FDG-PET changes in patients with ALS-FTD: “the chicken or the egg?” question. J Neurol Neurosurg Psychiatry. 2015 Sep;86(9):952–8.
18. La Joie R, Perrotin A, Barré L, Hommet C, Mézenge F, Ibazizene M, et al. Region-specific hierarchy between atrophy, hypometabolism, and β-amyloid (Aβ) load in Alzheimer’s disease dementia. J
Neurosci Off J Soc Neurosci. 2012 Nov;32(46):16265–73.
19. Ritz L, Segobin S, Lannuzel C, Boudehent C, Vabret F, Eustache F, et al. Direct voxel-based comparisons between grey matter shrinkage and glucose hypometabolism in chronic alcoholism. J Cereb Blood Flow Metab. 2015 Oct 14;
20. Buhour M-S, Doidy F, Laisney M, Pitel AL, De V, Sayette L, et al. Pathophysiology of the behavioral variant of frontotemporal lobar degeneration: A study combining MRI and FDG-PET. Brain Imaging Behav. 2016;
21. Brooks BR, Miller RG, Swash M, Munsat TL. El Escorial revisited: revised criteria for the diagnosis of amyotrophic lateral sclerosis. Amyotroph Lateral Scler Other Motor Neuron Disord. 2000 Dec;1(5):293–9.
22. Neary D, Snowden JS, Gustafson L, Passant U, Stuss D, Black S, et al. Frontotemporal lobar degeneration: a consensus on clinical diagnostic criteria. Neurology. 1998 Dec;51(6):1546–54. 23. Rascovsky K, Hodges JR, Knopman D, Mendez MF, Kramer JH, Neuhaus J, et al. Sensitivity of
revised diagnostic criteria for the behavioural variant of frontotemporal dementia. Brain. 2011 Sep;134(9):2456–77.
24. Cummings JL, Mega M, Gray K, Rosenberg-Thompson S, Carusi DA, Gornbein J. The Neuropsychiatric Inventory: comprehensive assessment of psychopathology in dementia. Neurology. 1994 Dec;44(12):2308–14.
25. Cedarbaum JM, Stambler N, Malta E, Fuller C, Hilt D, Thurmond B, et al. The ALSFRS-R: a revised ALS functional rating scale that incorporates assessments of respiratory function. BDNF ALS Study Group (Phase III). J Neurol Sci. 1999 Oct 31;169(1–2):13–21.
26. Norris FH, U KS, Sachais B, Carey M. Trial of baclofen in amyotrophic lateral sclerosis. Arch Neurol. 1979 Nov;36(11):715–6.
27. Carluer L, Mondou A, Buhour M-S, Laisney M, Pélerin A, Eustache F, et al. Neural substrate of cognitive theory of mind impairment in amyotrophic lateral sclerosis. Cortex. 2015;65:19–30.
28. Baron-Cohen S, Wheelwright S, Hill J, Raste Y, Plumb I. The "Reading the Mind in the Eyes" Test Revised Version: A Study with Normal Adults, and Adults with Asperger Syndrome or High-functioning Autism. J Child Psychol Psychiatry. Blackwell Publishing Ltd.; 2001 Feb;42(2):241–51.
29. Laisney M, Bon L, Guiziou C, Daluzeau N, Eustache F, Desgranges B. Cognitive and affective Theory of Mind in mild to moderate Alzheimer’s disease. J Neuropsychol. 2013 Mar;7(1):107–20. 30. Muller-Gartner HW, Links JM, Prince JL, Bryan RN, McVeigh E, Leal JP, et al. Measurement of
Radiotracer Concentration in Brain Gray Matter Using Positron Emission Tomography: MRI-Based Correction for Partial Volume Effects. J Cereb Blood Flow Metab. SAGE Publications; 1992 Jul;12(4):571–83.
31. Rousset OG, Ma Y, Evans AC. Correction for partial volume effects in PET: principle and validation. J Nucl Med Off Publ Soc Nucl Med. 1998 May;39(5):904–11.
32. Quarantelli M, Berkouk K, Prinster A, Landeau B, Svarer C, Balkay L, et al. Integrated software for the analysis of brain PET/SPECT studies with partial-volume-effect correction. J Nucl Med Off Publ Soc Nucl Med. 2004 Feb;45(2):192–201.
33. Richardson MP, Friston KJ, Sisodiya SM, Koepp MJ, Ashburner J, Free SL, et al. Cortical grey matter and benzodiazepine receptors in malformations of cortical development. A voxel-based comparison of structural and functional imaging data. Brain. Oxford University Press; 1997 Nov;(11):1961–73.
34. Chételat G, Desgranges B, Landeau B, Mézenge F, Poline JB, de la Sayette V, et al. Direct voxel-based comparison between grey matter hypometabolism and atrophy in Alzheimer’s disease. Brain A J Neurol. 2008 Jan;131(Pt 1):60–71.
between hippocampal atrophy, white matter disruption, and gray matter hypometabolism in Alzheimer’s disease. J Neurosci Off J Soc Neurosci. 2008 Jun;28(24):6174–81.
36. Boccardi M, Laakso MP, Bresciani L, Galluzzi S, Geroldi C, Beltramello A, et al. The MRI pattern of frontal and temporal brain atrophy in fronto-temporal dementia. Neurobiol Aging. 2003 Feb;24(1):95–103.
37. Tzourio-Mazoyer N, Landeau B, Papathanassiou D, Crivello F, Etard O, Delcroix N, et al. Automated anatomical labeling of activations in SPM using a macroscopic anatomical parcellation of the MNI MRI single-subject brain. Neuroimage. 2002 Jan;15(1):273–89.
38. Lancaster JL, Woldorff MG, Parsons LM, Liotti M, Freitas CS, Rainey L, et al. Automated Talairach atlas labels for functional brain mapping. Hum Brain Mapp. 2000 Jul;10(3):120–31.
39. Mutlu J, Landeau B, Tomadesso C, de Flores R, Mézenge F, de La Sayette V, et al. Connectivity Disruption, Atrophy, and Hypometabolism within Posterior Cingulate Networks in Alzheimer’s Disease. Front Neurosci. 2016 Dec 21;10:582.
40. Tomadesso C, Perrotin A, Mutlu J, Mézenge F, Landeau B, Egret S, et al. Brain structural, functional, and cognitive correlates of recent versus remote autobiographical memories in amnestic Mild Cognitive Impairment. NeuroImage Clin. 2015;8:473–82.
41. Cox RW. AFNI: software for analysis and visualization of functional magnetic resonance neuroimages. Comput Biomed Res. 1996 Jun;29(3):162–73.
42. Carrington SJ, Bailey AJ. Are there theory of mind regions in the brain? A review of the neuroimaging literature. Hum Brain Mapp. 2009 Aug;30(8):2313–35.
43. Schultz RT, Grelotti DJ, Klin A, Kleinman J, Van Der Gaag C, Marois R, et al. The role of the fusiform face area in social cognition: implications for the pathobiology of autism. Philos Trans R Soc L B Biol Sci. 2003;358(1430):415–27.
44. Cosottini M, Pesaresi I, Piazza S, Diciotti S, Cecchi P, Fabbri S, et al. Structural and functional evaluation of cortical motor areas in Amyotrophic Lateral Sclerosis. Exp Neurol. 2012 Mar;234(1):169–80.
45. Grosskreutz J, Kaufmann J, Frädrich J, Dengler R, Heinze H-J, Peschel T. Widespread sensorimotor and frontal cortical atrophy in Amyotrophic Lateral Sclerosis. BMC Neurol. 2006;6(1):17.
46. Mioshi E, Lillo P, Yew B, Hsieh S, Savage S, Hodges JR, et al. Cortical atrophy in ALS is critically associated with neuropsychiatric and cognitive changes. Neurology. 2013 Mar 19;80(12):1117–23. 47. Agosta F, Pagani E, Rocca MA, Caputo D, Perini M, Salvi F, et al. Voxel-based morphometry study
of brain volumetry and diffusivity in amyotrophic lateral sclerosis patients with mild disability. Hum Brain Mapp. 2007 Dec;28(12):1430–8.
48. Chang JL, Lomen-Hoerth C, Murphy J, Henry RG, Kramer JH, Miller BL, et al. A voxel-based morphometry study of patterns of brain atrophy in ALS and ALS/FTLD. Neurology. 2005 Jul 12;65(1):75–80.
49. Filippini N, Douaud G, Mackay CE, Knight S, Talbot K, Turner MR. Corpus callosum involvement is a consistent feature of amyotrophic lateral sclerosis. Neurology. 2010 Nov 2;75(18):1645–52.
50. Grossman M, McMillan C, Moore P, Ding L, Glosser G, Work M, et al. What’s in a name: voxel-based morphometric analyses of MRI and naming difficulty in Alzheimer’s disease, frontotemporal dementia and corticobasal degeneration. Brain A J Neurol. 2004 Mar;127(Pt 3):628–49.
51. Kassubek J, Unrath A, Huppertz H-J, Lulé D, Ethofer T, Sperfeld A-D, et al. Global brain atrophy and corticospinal tract alterations in ALS, as investigated by voxel-based morphometry of 3-D MRI. Amyotroph Lateral Scler Other Motor Neuron Disord. 2005 Dec;6(4):213–20.
52. Agosta F, Gorno-Tempini ML, Pagani E, Sala S, Caputo D, Perini M, et al. Longitudinal assessment of grey matter contraction in amyotrophic lateral sclerosis: A tensor based morphometry study. http://dx.doi.org.gate2.inist.fr/101080/17482960802603841. Taylor & Francis; 2009;10(3):168–74. 53. Machts J, Loewe K, Kaufmann J, Jakubiczka S, Abdulla S, Petri S, et al. Basal ganglia pathology in
ALS is associated with neuropsychological deficits. Neurology. 2015 Oct 13;85(15):1301–9.
54. Kim HJ, Oh SI, de Leon M, Wang X, Oh KW, Park JS, et al. Structural explanation of poor prognosis of amyotrophic lateral sclerosis in the non-demented state. Eur J Neurol. 2016;24(1):122–9.
55. Mackenzie IRA, Feldman HH. Ubiquitin immunohistochemistry suggests classic motor neuron disease, motor neuron disease with dementia, and frontotemporal dementia of the motor neuron disease type represent a clinicopathologic spectrum. J Neuropathol Exp Neurol. 2005 Aug;64(8):730– 9.
56. Sefcsik T, Nemeth D, Janacsek K, Hoffmann I, Scialabba J, Klivenyi P, et al. The role of the putamen in cognitive functions – a case study. Learn Percept. 2009;1(2):215–27.
57. Beeldman E, Raaphorst J, Klein Twennaar M, de Visser M, Schmand BA, de Haan RJ. The cognitive profile of ALS: a systematic review and meta-analysis update. J Neurol Neurosurg Psychiatry. 2016 Jun;87(6):611–9.
58. Kew JJ, Leigh PN, Playford ED, Passingham RE, Goldstein LH, Frackowiak RS, et al. Cortical function in amyotrophic lateral sclerosis. A positron emission tomography study. Brain,116(3), 655-680.
59. Kew JJ, Goldstein LH, Leigh PN, Abrahams S, Cosgrave N, Passingham RE, et al. The relationship between abnormalities of cognitive function and cerebral activation in amyotrophic lateral sclerosis. A neuropsychological and positron emission tomography study. Brain, 116(6), 1399-1423.
60. Lloyd CM, Richardson MP, Brooks DJ, Al-Chalabi A, Leigh PN. Extramotor involvement in ALS: PET studies with the GABA(A) ligand [(11)C]flumazenil. Brain, 123(11), 2289-2296.
61. Cistaro A, Pagani M, Montuschi A, Calvo A, Moglia C, Canosa A, et al. The metabolic signature of C9ORF72-related ALS: FDG PET comparison with nonmutated patients. Eur J Nucl Med Mol Imaging. 2014 May;41(5):844–52.
62. Ashraf A, Fan Z, Brooks D, Edison P. Cortical hypermetabolism in MCI subjects: a compensatory mechanism? European journal of nuclear medicine and molecular imaging, 42(3), 447-458.
63. Hu WT, Wang Z, Lee .-Y, Trojanowski MJQ, Detre JA, Grossman M. Distinct cerebral perfusion patterns in FTLD and AD. Neurology. 2010;75(10):881–8.
64. Feigin A, Ghilardi M-F, Huang C, Ma Y, Carbon M, Guttman M, et al. Preclinical Huntington’s disease: Compensatory brain responses during learning. Ann Neurol. Wiley Subscription Services, Inc., A Wiley Company; 2006 Jan;59(1):53–9.
65. Pitel A-L, Aupée A-M, Chételat G, Mézenge F, Beaunieux H, de la Sayette V, et al. Morphological and glucose metabolism abnormalities in alcoholic Korsakoff’s syndrome: group comparisons and individual analyses. PLoS One. 2009;4(11):e7748.
66. Shimizu S, Zhang Y, Laxamana J, Miller BL, Kramer JH, Weiner MW, et al. Concordance and discordance between brain perfusion and atrophy in frontotemporal dementia. Brain Imaging Behav. 2010 Mar;4(1):46–54.
67. Blackburn D, Sargsyan S, Monk PN, Shaw PJ. Astrocyte function and role in motor neuron disease: A future therapeutic target? Glia. 2009;57(12):1251–64.
68. Brettschneider J, Toledo JB, Van Deerlin VM, Elman L, McCluskey L, Lee VM-Y, et al. Microglial Activation Correlates with Disease Progression and Upper Motor Neuron Clinical Symptoms in Amyotrophic Lateral Sclerosis. Petrucelli L, editor. PLoS One. Public Library of Science; 2012 Jun 14;7(6):e39216.
69. La Joie R, Perrotin A, Barre L, Hommet C, Mezenge F, Ibazizene M, et al. Region-Specific Hierarchy between Atrophy, Hypometabolism, and -Amyloid (A ) Load in Alzheimer’s Disease Dementia. J Neurosci. Society for Neuroscience; 2012 Nov 14;32(46):16265–73.
70. Geser F, Brandmeir NJ, Kwong LK, Martinez-Lage M, Elman L, McCluskey L, et al. Evidence of Multisystem Disorder in Whole-Brain Map of Pathological TDP-43 in Amyotrophic Lateral Sclerosis. Arch Neurol. 2008;65(5):636–41.
71. Rocher A, Chapon F, Blaizot X, Baron J, Chavoix C. Resting-state brain glucose utilization as measured by PET is directly related to regional synaptophysin levels: a study in baboons. Neuroimage. 2003;20(3):1894–8.
72. Ongur D, Price JL. The Organization of Networks within the Orbital and Medial Prefrontal Cortex of Rats, Monkeys and Humans. Cereb Cortex. Oxford University Press; 2000 Mar 1;10(3):206–19. 73. Lillo P, Mioshi E, Burrell JR, Kiernan MC, Hodges JR, Hornberger M. Grey and White Matter
Changes across the Amyotrophic Lateral Sclerosis-Frontotemporal Dementia Continuum. Stamatakis EA, editor. PLoS One. Public Library of Science; 2012 Aug 29;7(8):e43993.
74. Mezzapesa DM, Ceccarelli A, Dicuonzo F, Carella A, De Caro MF, Lopez M, et al. Whole-brain and regional brain atrophy in amyotrophic lateral sclerosis. AJNR Am J Neuroradiol. 2007 Feb;28(2):255–9.
75. Senda J, Kato S, Kaga T, Ito M, Atsuta N, Nakamura T, et al. Progressive and widespread brain damage in ALS: MRI voxel-based morphometry and diffusion tensor imaging study. Amyotroph Lateral Scler. 2011 Jan;12(1):59–69.
76. Tavazzi E, Laganà MM, Bergsland N, Tortorella P, Pinardi G, Lunetta C, et al. Grey matter damage in progressive multiple sclerosis versus amyotrophic lateral sclerosis: a voxel-based morphometry MRI study. Neurol Sci. Springer Milan; 2014 Mar 17;36(3):371–7.
77. Tsujimoto M, Senda J, Ishihara T, Niimi Y, Kawai Y, Atsuta N, et al. Behavioral changes in early ALS correlate with voxel-based morphometry and diffusion tensor imaging. J Neurol Sci. 2011 Aug 15;307(1–2):34–40.
78. Ellis CM, Suckling J, Amaro E, Bullmore ET, Simmons A, Williams SC, et al. Volumetric analysis reveals corticospinal tract degeneration and extramotor involvement in ALS. Neurology. 2001 Nov 13;57(9):1571–8.
Table 1 Demographic, medical data, and executive function as well as episodic memory and affective theory of mind performances of controls and patients with ALS.
Controls (cognition) Controls (imaging) ALS patients P
Main features of the participants
Age (years) 61.81 59 61.83 0.83 (cognition)/0.91 (imaging)
Sex (F/M) 16/21 16/21 16/21
Years of education 11.11 11.43 9.92 0.07 (cognition)/ 0.09 (imaging) Mattis (total) 139.95 141 136.47 0.005 (cognition)/<0.001 (imaging)
ALSFRS-R score / 37.31
Cognitive profile
TMT(B-A) 15.94 62.97 <0.001
Letter verbal fluency score 22.24 15.03 <0.001
letter verbal fluency index 4.71 7.68 0.017
episodic memory 12.14 7.08 <0.001
Table 2 Labelization. MNI coordinates. Cluster size in number of voxels and T value of the significant peaks for the SPM analyze of GM atrophy, hypometabolism, hypermetabolism and GM atrophy > Hypometabolisme and Hypometabolisme > GM atrophy.
Labels K MNI coordinates
p corre cte d at the cluster level p FW E corre cte d at voxel-level T (voxel level) x y z GM atrophy L postcentral 569 -53 -12 29 0.518 0.036 5.18
L inferior temporal gyrus 3146 -27 9 -33 0.002 0.102 4.86
L paracentral lobule 1331 -4 -27 64 0.084 0.133 4.77 L supramarginal gyrus 484 -52 -22 31 0.621 0.159 4.71 R precentral gyrus 1115 16 -26 67 0.14 0.541 4.23 R putamen 771 35 0 4 0.323 0.785 3.99 Hypometabolism R paracentral lobule 218 4 -22 70 0.217 0.032 5.21
L inferior parietal gyrus 142 -50 -24 34 0.398 0.099 4.26
R thalamus 244 8 -16 4 0.176 0.31 3.92
L superior medial frontal gyrus 142 -8 40 36 0.398 0.314 3.91
L thalamus 144 -8 -18 6 0.392 0.564 3.87 Hypermetabolism L Hippocampus 868 -22 -18 -18 0.003 0.008 5.33 L parahippocampus L fusiform Vermis VII 941 -2 -72 -32 0.002 0.044 4.82 Vermis IV_V R fusiform 557 22 -32 -20 0.019 0.163 4.39 R cerebellum IV_V R parahippocampal gyrus R Hippocampus Atrophy > Hypometabolism L parahippocampus 147 -26 4 -30 0 0.709 4.85
L middle temporal pole
L calcarine 36 -4 -96 8 0.109 0.784 4.76
R middle temporal pole 58 46 12 -26 0.013 0.936 4.52
L inferior temporal gyrus 87 -50 -6 -32 0.001 0.997 4.2
L hippocampus 56 -30 -12 -22 0.016 1 4.05
Hypometabolism > Atrophy
Table 3. Correlations between the metabolism of each region presenting hypermetabolism and the relevant cognitive performances in ALS patients. R = right. L= left.
Figure 1. Patterns of grey matter atrophy, hypometabolism and hypermetabolism in ALS
Episodic Memory (immediate recall) Episodic memory (delayed recall) TOM-15
L hippocampus r= -0,3575; p= 0,045 r=-0,2921; p=0,105 R hippocampus r=-0,3585; p=0,044 r=-0,3171; p=0,077 L parahippocampus r= -0,4641; p=0,007 r=-0,4501; p=0,010 R parahippocampus r=-0,1932; p=0,289 r=-0,1059; p=0,564 L fusiform r=-0,3327; p= 0,044 R fusiform r=-0,1324; p=0,435