HAL Id: hal-00509643
https://hal-mines-paristech.archives-ouvertes.fr/hal-00509643
Submitted on 13 Aug 2010
HAL is a multi-disciplinary open access
archive for the deposit and dissemination of
sci-entific research documents, whether they are
pub-lished or not. The documents may come from
teaching and research institutions in France or
abroad, or from public or private research centers.
L’archive ouverte pluridisciplinaire HAL, est
destinée au dépôt et à la diffusion de documents
scientifiques de niveau recherche, publiés ou non,
émanant des établissements d’enseignement et de
recherche français ou étrangers, des laboratoires
publics ou privés.
Experimental characterisation of damage in SiC/SiC
minicomposites
Camille Chateau, L. Gélébart, Michel Bornert, Jérôme Crépin, Daniel
Caldemaison, Elodie Boller, C. Sauder, M. Langer, Wolfgang Ludwig
To cite this version:
Camille Chateau, L. Gélébart, Michel Bornert, Jérôme Crépin, Daniel Caldemaison, et al..
Experi-mental characterisation of damage in SiC/SiC minicomposites. ICEM 14 – 14th International
Con-ference on Experimental Mechanics, Jul 2010, Poitiers, France. 8 p., �10.1051/epjconf/20100620002�.
�hal-00509643�
minicomposites
C. Chateau1,2,a, L. G´el´ebart1, M. Bornert2,3, J. Cr´epin4, D. Caldemaison2, E. Boller5, C. Sauder1, M.
Langer5,6, and W. Ludwig7
1 Commissariat `a l’Energie Atomique Saclay, DEN/DANS/DMN/SRMA, 91191 Gif/Yvette Cedex,
France
2 Laboratoire de M´ecanique des Solides, Ecole polytechnique, CNRS UMR 7649, 91128 Palaiseau
Cedex, France
3 Unit´e de Recherche Navier, Ecole des Ponts ParisTech, Universit´e Paris Est, 77455 Marne-la-Vall´ee
Cedex, France
4 Centre des mat´eriaux, Mines ParisTech, CNRS UMR 7633, BP 87, 91003 Evry Cedex, France 5 European Synchrotron Radiation Facility, 6 rue Jules Horowitz, 38043 Grenoble Cedex, France 6 CREATIS-LRMN, Universit´e CB Lyon 1, INSA Lyon, CNRS UMR 5220, INSERM U630, 69621
Villeurbanne Cedex, France
7 MATEIS, Universit´e de Lyon, INSA Lyon, CNRS UMR 5510, 69621 Villeurbanne Cedex, France
Abstract. SiC/SiC composites are studied for their potential use in the next generation
of nuclear reactors. A multiscale approach is under development to construct a predictive modelling of their complex damageable mechanical behaviour due to their heterogeneous microstructure. This paper focuses on the damage characterisation of the composite at the scale of the tow at room temperature, both in terms of its spatial distribution and its chronology. Such observations are necessary to validate a multiscale damage mod-elling at the microscopic scale. The nonlinear behaviour is related to the accumulation of damages such as matrix cracking, fibre/matrix debonding and finally fibre breaking. Therefore, in-situ tensile tests were carried out on SiC/SiC minicomposites using scan-ning electron microscopy. Specific procedures could be used to get statistical data on the crack evolution. The first results especially show that the growth of the crack openings over the global strain is related to inter-crack distance. This test was complemented by a microtomographic investigation, conducted at the ESRF, performed on a minicomposite submitted to a tensile load. An analysis conducted on the 3D image of a crack shows a slow propagation of the matrix cracking through the minicomposite section.
1 Introduction
Because of their favourable mechanical properties at high temperature and after irradiation, SiC/SiC composites are relevant candidates for structural or functional applications in the future nuclear reac-tors.
The composite is elaborated from a fibrous preform on the base of woven tows constituted by SiC fibres. The Chemical Vapor Infiltration process (CVI) used to deposit the SiC matrix does not allow to fully densify the composite. The residual porosity is present in the composite between the tows, and in each tows between the fibres. So, this material can be described at two different scales : the scale of the woven composite and the smaller scale of the tow. A multiscale approach is thus under development to build a predictive modelling of their complex and damageable mechanical behaviour
EPJ Web of Conferences
taking into account their heterogeneous microstructure [1, 2]. This nonlinear behaviour is related to the accumulation of damages such as matrix cracking, fibre/matrix debonding and finally fibre breaking. Even though the damage effects on the macroscopic behaviour are relatively well known, mechanisms themselves have been less studied, both in terms of spatial distribution and chronology. For instance, the matrix crack spacing distribution is usually characterised after the ultimate failure (post-test obser-vations) [3–7]. Moreover, these characterisations are limited to 2D examinations. In order to validate a multiscale damage modelling at the microscopic scale, it is necessary to characterise initiation, prop-agation and distribution of the matrix cracks, associated fibre/matrix debonding and fibre breaking. In this purpose in-situ tensile tests, at room temperature, were carried out on SiC/SiC minicomposites (1D composites containing 500 fibres) to study the damage at the tow scale. The first results presented here focus on the study of the matrix cracking.
Scanning electron microscopic (SEM) observations have been performed at several loading levels in order to link cracking characteristics - such as initiation, geometry, opening and spacing of ma-trix cracks - to the macroscopic behaviour. The first results especially show that the crack opening evolution over the global strain is related to inter-crack distance. This test may lead to statistical data about the cracking on a representative tow segment as a function of the applied load. However, these results are limited to surface observations. In order to characterise the crack propagation through the minicomposite section, it has thus been complemented by another in-situ tensile test using micro-tomography. 3D images of a minicomposite at several loading levels have been acquired using the X-ray synchrotron source provided by the European Synchrotron Radiation Facility (ESRF, Grenoble, France) on the ID19 beamline. Due to the small size of these objects, and to the low contrast between SiC fibres and SiC matrix, the High Resolution holotomographic mode provided by ESRF has been used to distinguish fibres from matrix. These images, combined to the absorption contrast images, have been analysed to detect a matrix crack within the volume. The slow propagation of the crack through the minicomposite section is described and two different stages of propagation are evidenced.
2 Material
The material under investigation is a SiC/SiC minicomposite, a 1D composite used to study the proper-ties of the woven composite at the scale of the tow and to test the influence of interface characteristics on the mechanical behaviour. It was elaborated [8] from a fibrous yarn constituted by 500 Hi-Nicalon type S fibres, with an average diameter of 13 µm, like a tow in the woven composite. A Chemical Vapor Infiltration process (CVI) was next used to deposit a 100 nm interphase of pyrocarbon and to densify the composite with SiC matrix. Because of the CVI process, the material can not be fully densified and a residual porosity appears within the minicomposite.
Like the woven composite, minicomposites have an elastic damageable behaviour. Their macro-scopic behaviour follows successive typical steps [8] (see fig.1b). The first one is the elastic domain of the minicomposite behaviour : no crack occurs. The non-linear second domain is associated with the matrix cracking until its saturation (≈ 0.3%). A second linear region thanks to the elastic deformation of fibres then appears after saturation. The final step is characterised by a slight nonlinearity associated with fibre breaking just before the ultimate failure (close to ≈ 0.7%). If this qualitative description is usually accepted, the purpose of this experimental study is now to quantify the evolution of damage mechanisms as a function of the load.
The strain-stress curve corresponding to the studied minicomposite batch, given in fig.1b, has been obtained with the macroscopic device presented in [8]. The average crack spacing distance, measured after failure, is equal to 193 µm.
3 In-situ SEM tensile test
3.1 Experimental procedure
In-situ tensile tests were carried out on minicomposite using a specific tensile machine available at the LMS (Laboratoire de M´ecanique des Solides, Ecole Polytechnique, France) designed to load samples
into a Field Emission Gun Scanning Electron Microscope (FEG-SEM). Both sides of the sample were glued into aluminium tabs and the specimen was loaded through pins mounted in the grip regions (see fig.1a). Specimens had a gauge length of 25 mm, which allowed the observation of a significant number of matrix cracks.
The tensile test was interrupted at various loads until the ultimate failure. Interruptions were more frequent at low loadings to distinguish as much as possible the crack apparition levels. Acoustic emis-sion were also monitored to detect the beginning of the damage accumulation. At each step, strain was measured using SEM observations of each side of the gauge length. The location of each new crack was also reported along the observed length. The observation was bounded to the central 16 mm of the sample. Finally, in order to study the evolution of the crack opening, a few cracks, distributed into three regions about 2 mm long each, were observed at high magnification (see fig.3b).
For now, as shown on fig.1b, the macroscopic behaviour of the minicomposite, obtained with the in-situ tensile test machine is not satisfying and reveals a premature failure. The way to improve this test is under investigation. Nevertheless, these tests allowed us to develop specific procedures to study the matrix cracking evolution over the minicomposite global strain.
(a) Sample mounted in the in-situ tensile machine (b) Macroscopic tensile behaviour of a minicomposite (obtained with a macro-scopic and the in-situ devices)
Fig. 1: Experimental device and material behaviour
3.2 Results
3.2.1 Crack positions
Cracks appear straight in the transverse direction, so they are easy to localize (see fig.3a). The locations of all cracks along the observed length of the specimen are presented in fig.2a. The strain when each crack was newly observed is also reported – the correspondence between colors and strain levels is given in fig.2b. This figure suggests that cracks appear in groups located in various healthy parts of the minicomposite. The evolution of the matrix fragments (or the crack spacing distance) over the actual strain and the location in the minicomposite, presented in fig.2b, leads to the same remark. The crack spacing distance decreases and tends to stabilize around an average value (378 µm) along the sample. This distance is higher than the expected average crack spacing distance at saturation (about 200 µm, see section 2), which could be due to the premature failure of the minicomposite.
3.2.2 Crack openings
The opening of matrix cracks was measured from high magnification FEG-SEM images (see fig.3b) using an automatic procedure. It is based on the detection of the crack width for each row of pixels
EPJ Web of Conferences
(a) Crack locations in the observed length (each vertical line corresponds to a crack)
(b) Evolution of matrix fragment length
Fig. 2: Cracking evolution of the observed length over the global strain
(a) Cracked minicomposite (b) Zoom on a crack Fig. 3: FEG-SEM images of matrix cracks
of the image by thresholding the grey levels. The threshold is adjusted for each row of the image and the opening is defined as the average of the highest measured widths. The only relevant errors made by this procedure were a few overestimates of the opening in the case of dark artefacts in the image. These overestimates were considerable so they were easily identified and manually corrected.
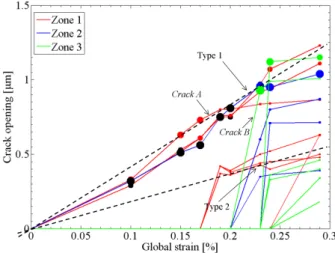
Openings of cracks localized in the three areas defined in fig.2a (about 2 mm long) were measured using this automatic procedure. Their evolutions against the global strain are presented in fig.4. This figure takes also into account the distance of the nearest neighbouring crack through dot sizes. This figure suggests there are two kinds of evolution as a function of the global strain :
– if the distance of the nearest neighbouring crack is high (large markers, type 1), the evolution is quite linear with a high slope.
– if the distance of the nearest neighbouring crack is small (small markers, type 2), the evolution is also almost linear with a far smaller slope.
Cracks A and B (fig.4) are perfect examples of the link between the crack spacing distance and the slope of the opening-strain curve, for which a sharp change of slope corresponds to a sharp decrease of the nearest neighbouring crack distance. These results are the consequence of the shielding effect associated with matrix cracks (the matrix stress decreases in the neighbourood of a crack). A lower estimate of the shielding zone length, at the highest load, may be provided from the maximum distance observed for type 2 cracks (0.272 =0.135 mm). Similarly, an upper estimate (0.21 mm) may also be obtained from the minimum distance for type 1 cracks.
These first results about crack openings have been obtained on an unique tensile test and need to be reinforced with new results on additionnal tensile tests presenting a satisfying macroscopic behaviour.
Fig. 4: Evolution of some crack openings over the global strain of the gauge length(the dot size is proportional to the distance of the nearest neighbour crack; black dots correspond to cracks at the extremities of the observed length, the distance is then equal to the first distance actually measured)
4 In-situ microtomography
4.1 Experimental procedure
Fig. 5: In-situ tensile machine used on the ID19 beamline
In-situ SEM tensile tests are not sufficient to fully characterise damage and especially both ma-trix crack propagation – through the section of the minicomposite – and fibre breaking. So, an in-situ microtomography tensile test was carried out on the ID19 beamline at the ESRF to study these mech-anisms. First results focus on the matrix crack propagation.
Microtomography consists in recording a set of radiographs at various angular positions of the sam-ple according to the X-ray beam. Appropriate algorithms are then used to reconstruct the 3D image from this set of radiographs. A high resolution is necessary to observe craking and the microstructure of the tow. Such a resolution (0.28 µm, the highest provided on the ID19 beamline) could only be reached through the synchrotron radiation provided by the ESRF, which leads to a monochromatic, parallel and high intensity beam. Moreover, the classical absorption tomography does not allow to
EPJ Web of Conferences
distinguish materials with neighbouring densities. So the holotomographic mode, based on phase con-trast obtained by combining images recorded at four different distances from the sample, was used to increase the contrast between fibres and matrix.
A specific light tensile machine, designed at the INSA Lyon (Institut National des Sciences Ap-pliqu´ees, Lyon, France), was used to load manually the specimen (see fig.5). The minicomposite was glued into aluminium tabs, like for the SEM tests, and had a gauge length of 15 mm. Six loadings were successively applied to the specimen : 50, 68, 74, 86, and 92 N. For each loading, three images (four scans at four different distances by image) were acquired to observe a total length of 1.65 mm of the sample in the central part.
4.2 Results
The holotomographic images were reconstructed for all loadings using the specific algorithm proposed by [9, 10]. The absorption contrast images were also reconstructed for the first two distances of acqui-sition. The total volume studied contained six matrix cracks at the highest loading level (92 N). In fact, fig.6 shows the effects of the crack on both reconstruction type, absorption and holotomography. On this slice, several zones within the minicomposite are affected by the cracking. The crack effect is, in a first visual observation, more pronounced on absorption contrast images but there is also more arte-facts in healthy zones due to the crack. Finally note that the contrast between fibres and matrix is not better in holotomograhic reconstructions than in absorption reconstruction. In fact, the beam energy was not optimized for holotomography with a quartz tube around the sample.
(a) Distance 1 (b) Distance 2 (c) Holotomography
Fig. 6: Reconstruction of a transverse slice in absorption (first two distances) and holotomographic mode within a crack
In order to study their propagation inside the minicomposite, an automatic procedure was used to detect the cracks in the 3D image. A small volume containing one of them has been isolated to make easier and faster the image analysis. It is 262 pixels – ie about 73 µm – in the longitudinal direction Z. The detection procedure is based on the processing of the grey level evolution in the Z direction. An example of a such an evolution (for (X,Y) located in a matrix crack) is given in fig.7a. The crack is responsible for an important variation of the grey levels on a relatively short length. The aim of the automatic procedure is to spot this fluctuation, in reducing the detection of artefacts such as evolutions of the microstructure (matrix/pore interface) in the fibre direction. The variation detection is based on the study of the ratio of the derivative to the average derivative on a neighbourhood (see fig.7a). An example of this filtering is presented in fig.7b. A crack is detected when the three reconstructions global maxima match. Otherwise, the material is considered healthy.
A combination of the three reconstructions allows to reduce the detection of artefacts. Indeed, those are not always noticeable on the three grey level evolutions, unlike a matrix crack. Moreover, the image noise was reduced in the porosity using a threshold image of a healthy holotomographic slice.
(a) Grey level evolution through a matrix crack (b) Filtering Fig. 7: Crack detection in the Z direction(the height is in pixels)
The procedure was computed for each loading level. Fig.8 presents the crack projection onto the transverse plan. It clearly shows three propagation states at 50, 68 and 80 N. The initiation of the crack is observed at 50 N. From 50 N to 68 N, the crack propagates on the minicomposite periphery, following a spiral shape. Then from 74 N to 80 N, the crack goes to the center of the minicomposite. Moreover, there is no evolution between 68 and 74 N. That reveals a discontinuous propagation. These results contradict the classical 1D modelling of minicomposite [5, 11], which assumes that the matrix cracks suddenly cross the whole section.
Fig. 8: Propagation of a crack over a tensile load(the color scale corresponds to the average height in pixels where the crack is detected)
EPJ Web of Conferences
5 Conclusion
In order to validate a multiscale damage modelling of SiC/SiC composites at the scale of the tow, dam-age mechanisms need to be fully characterised. Two innovative experiments are proposed to observe damage evolution in minicomposites.
First, in-situ SEM tensile tests lead to a surface observation of the matrix cracking at various strain states. Monitoring of crack positions along the sample shows that they tend to appear in groups preferably located in healthy parts. Besides, an automatic procedure was established to measure the opening of some cracks on the base of SEM images acquired at each step of the tensile test. The first results highlight the effect of inter-crack distance on crack opening. Indeed, in this test, as a consequence of the shielding effect, a crack opens less if it has a near neighbour. A deeper analysis will have to be conducted on additional tensile tests.
Second, a 3D microtomographic observation of a minicomposite under tensile load was performed using the X-ray synchrotron source provided by the ESRF. Images of a short tow segment have been reconstructed, using absorption and holotomographic modes, at six loading states and reveal some cracks. A specific procedure was applied on the three types of reconstructions to extract a crack of the minicomposite. Unlike what is often assumed, the matrix crack slowly propagates within the bundle of fibres, at first on the peripheral zone, and then through the center of the section. Further analysis also are under development to study the density of fibre failures.
References
1. L. G´el´ebart, C. Colin, J. Nucl. Mater. 386, (2009) 82
2. L. G´el´ebart, C. Chateau, M. Bornert, J. Cr´epin, E. Boller, Int. J. Appl. Ceram. Technol. (to be published)
3. L. Guillaumat, J. Lamon, Compos. Sci. Technol. 56, (1996) 803
4. S. Bertrand, P. Forio, R. and Pailler, J. Lamon, J. Am. Ceram. Soc. 82, (1999) 2465 5. N. Lissart, J. Lamon, Acta Mater. 45, (1997) 1025
6. G.N. Morscher, J. Am. Ceram. Soc. 80, (1997) 2029
7. J. Martinez-Fernandez, G.N. Morscher, J. Am. Ceram. Soc. 20, (2000) 2627 8. C. Sauder, A. Brusson, J. Lamon, Int. J. Appl. Ceram. Technol. (to be published) 9. M. Langer, P. Cloetens, J.P. Guigay, F. Peyrin, Med. Phys. 35, (2008) 4556 10. M. Langer, P. Cloetens, F. Peyrin, IEEE T. Image Process. (to be published) 11. S. Bertrand, R. Pailler, J. Lamon, Compos. Sci. Technol. 61, (2001) 363