Computation of economic rebound effect in different sectors of the U.S.
economy
By
Suganth Kumar Kalakkad Jayaraman
B.E, Mechanical engineering
Anna University, India, 2007
Submitted to the Department of Mechanical Engineering in Partial
Fulfillment of the Requirements for the Degree of
Master of Science in Mechanical Engineering
at the
Massachusetts Institute of Technology
A,,, .... - ffo
tlugust LVVu
@2008 Suganth Kumar Kalakkad Jayaraman. All rights reserved
The author hereby grants to MIT permission to reproduce and to distribute
publicly paper and electronic copies of this thesis document in whole or in
part in any medium now known or hereafter created.
Signature of Author:
v
Department of Mechanical Engineering
-r-
ugust
08,2008
Certified by:
.
Timothy G. Gutowski
Professor of echanical Engineering
Thesis Supervisor
Accepted by:
r
r
Lallit Anand
Professor of Mechanical Engineering
Chairman, Committee for Graduate Students
' a . 1 MASSACHUSETTS iNSTITUTE OF TECHNO L(,' V
DEC 0
7
2008
LIBRARIES
I-,MFVVFWRComputation of economic rebound effect in different sectors of the U.S. economy By
Suganth Kumar Kalakkad Jayaraman
Submitted to the Department of Mechanical Engineering on August 08, 2008, in Partial Fulfillment of the
Requirements for the Degree of Master of Science in Mechanical engineering
ABSTRACT
Economic rebound effect is the phenomenon in which price reduction in products and services, induced by energy efficiency increase will cause more consumption leading to an "eat away" of the potential decreases in energy usage. Several researchers have expressed their views on the existence of the effect and the related consequences of such an effect in the micro economic scale. It is recognized that the microeconomic rebound effect will depend on how the price of a good will vary when an efficiency increase is brought about and also on how the quantity consumed may vary when the price changes by a certain amount. A mathematical formulation for this effect is then developed and the two parameters required are found separately for two relevant sectors of the economy. In the first case, the rebound effect is evaluated for the US Aluminum production sector taking into consideration both primary and secondary production. Several models for determining the price elasticity of demand are developed and the share of energy cost in total costs is also found in order to estimate the rebound. The values indicate very low rebound effect in the aluminum industry. A similar trial is conducted for system wide U.S air travel and the rebound estimates are arrived at. Low to moderate take back is observed in this case due to the increased price elasticity unlike the aluminum case where a very low price elasticity of demand pulled down rebound values. In the final sections of the report, discussions including the future trends in rebound effect in the wake of the higher fuel prices and low cost product introduction etc are made. A qualitative description of the macroeconomic rebound effect is also made and conclusions regarding the presence and significance of this effect are drawn. In summarizing it is inferred that even if the rebound effect is statistically significant, it cannot be big enough to completely mask the gains in efficiency improvement. Hence efficiency improvement is inferred as a definite method to decrease energy usage despite the fact that it has its own effectiveness limit set by the rebound.
Thesis Supervisor: Timothy G. Gutowski Title: Professor of Mechanical Engineering
Acknowledgements
I would like to thank my advisor, Prof. Tim Gutowski, for providing me with the guidance to complete this research. I also wish to recognize the role played by Prof Panle Jia of the Department of Economics, MIT in helping me formulate the model for price elasticity.
I also wish to thank Prof Tim Considine, of Pennsylvania State University, for having provided with information on the estimation of price elasticity.
My special thanks to Prof. Peter Belobaba of Department of Aeronautics and Astronautics, MIT for his valuable suggestions on collecting data on the airline industry
Table of Contents
Chapter 1. Introduction to Economic Rebound Effect ... ... 9...
Trends in energy consumption and efficiency ... 9...
Rebound effect defined ... ... 11
Sectors of the economy for which rebound is evaluated in this study ...16
Principal objectives of the study ... 17
Chapter 2. Literature Survey ... ... 18
The concept and development of the theory ... 18
Opinion of the conservationists ... ... 20
Inferences from the literature ... 23
References ... 24
Chapter 3. Rebound in the US aluminum industry ... 27
General Methadology for computing rebound: Aluminum production in US... 28
Price elasticity of demand ... 28
Price elasticity of demand derived purely from the theory of consumer behaviour ..37
Estimation of Efficiency elasticity of price ... 49
Computation of Rebound Effect ... 55
Conclusions ... 59
R eferences ... .. 60
Chapter 4. Rebound effect in the US Airline industry ... 63
Introduction ... 63
Industry Service Classification ... .64
Fuel efficiency issues in airline industry ... 66
Price elasticty of Demand ... 67
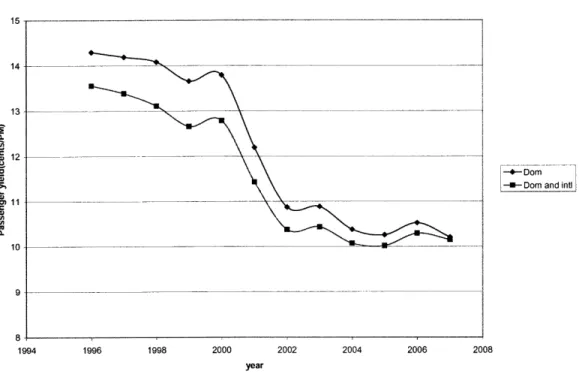
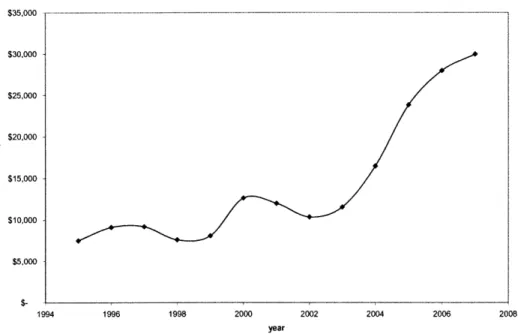
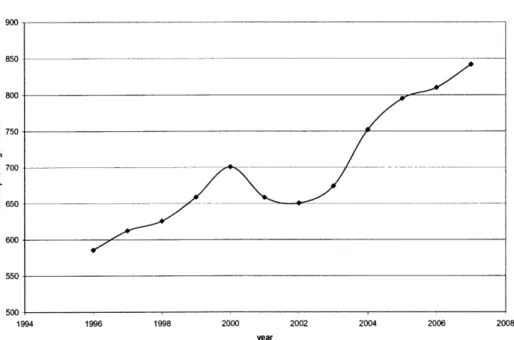
General Trends in the Airline Industry: Revenues and Fuel costs ... 69
Literature backing for the system wide price elasticity... ... 81
References ... 86
Chapter 5. Discussion on the rebound estimates and possible future trends 88 Revenues and Profits for firms under different demand elasticity conditions ... 88
Caveats in Price elasticity computation ... 91
Effect of fuel price on the value of rebound estimate ... 94
Macroeconomic rebound effect estimates ... 96
References ... 98
Chapter 1. Introduction to Economic Rebound Effect
Trends in energy consumption and efficiency:
The word "Energy" is the buzz word in every country's economy today. The bulk of the energy required for keeping the world alive is derived from fossil fuel sources. Increasing concerns of green house gas emissions from fossil fuel energy sources, and in general our increased dependence on fossil fuel derived energy has always pushed technologists to seek methods in order to increase energy efficiency, in every process using energy. It may be known that most of the efforts in the technological frontier are motivated by economic needs, the whole effort to increase the energy efficiency of any process, has economic implications as well, which will ultimately reduce the cost involved in the process. This trend in increasing the energy efficiency through technological change has been prevalent since the very beginning of the industrial revolution. During the early periods of industrial revolution, energy efficiency increase and noxious emissions control was less of a concern as technologists mostly concentrated on developing the newer equipment and gadgets which the world then asked for. With the progress of time, and the realization of the scarcity of fossil fuel resources, increased attention was given to improving energy efficiency.
Another phenomenon which has been widely observed is the perpetual penchant for firms to increase production quantity and hence obtain the many benefits of adopting economies of scale. With increase in production, the fixed costs and one time expenses for the firm get distributed over increased volumes of output thus decreasing prices of the products. In the micro level, this will better the financial position of the profit maximizing firm and hence a firm will prefer to produce more quantity whenever the demand at the offered price increases. The basic law of demand theorizes that with increase in demand from the customer, the supplier will offer every additional product output at a lower price than the price for the previous product. This implies that for a firm whose production has increased, its own raw material suppliers will provide the firm with necessary raw material stock, at lower and lower price per product with increase in the quantity. This will further add to the benefits obtained from achieving economies of scale.
Given that the trend in the production is generally increasing due to increases in population and affluence, the question arises as to whether the net energy usage for all the activities under macroeconomic boundaries, decrease in order to reduce the impact on environment. The answer to the question may be given based on the knowledge of the magnitude of the increase in production compared to the magnitude of increase in the energy efficiency. The famous IPAT identity gives a decomposed representation of the eco impact in terms of population, affluence and technology parameters:
Production Impact
Impact = Population x x
Population Production
The final term in the identity gives an idea of the technology factor which describes the energy used or greenhouse gas emitted per unit production. The 2 nd term describes the economic affluence or the consumed quantity per head. The identity gives a convenient way to split the effect into its constituent causes and hence focus more on the individual
aspects of sustainability.
At this juncture, it may be useful to make a mention about the term eco-efficiency (energy efficiency in the present case). Efficiency in this context is defined as
production
Efficiency = . It is a measure of how much production is achieved for
energy usage
every unit input of energy. The inverse of this efficiency may be the impact parameter which describes the amount of energy consumed for achieving a desired number of units production.
Using these defined terms, the IPAT identity previously mentioned can be re written in a different form:
1 Impact = Production x
Efficiency
If the objective is the reduction of impact over time, then it can be mentioned that it would be achieved only when the rate of increase of production is less than the rate of increase in efficiency. It is to be noted that both the terms are in fact not independent, but are linked to one another through the bridge of economics.
By the words "bridge of economics" we mean that the energy efficiency will influence the price of any good or service, and that the price of the good has a decisive role in
determining the consumption as the consumers make their decision of how much to consume only based on the price often and rarely based on environmental damage indicators. It needs to be acknowledged that the pace with which the efficiency and production increases depends on the individual good or service. Hence the trends in the eco impact for a product or service boils down finally to the economic parameters which define demand and the energy use parameters which determine the price of the good or service.
Rebound effect defined:
It is only at this point we can clearly understand the phenomenon of economic rebound. The concept stems from an attempt to answer the question "Can efficiency improvement lead to truly decreased energy consumption?" Energy efficiency increase, apart from decreasing the impact per product produced also decreases the cost of the product. In a market economy setting with perfect competition, the energy cost decrease will motivate the individual firms to decrease the price in order to leverage on the market potential. The price decreases may hence cause further purchase of the goods and services by the customers. The increase in demand when price is decreased occurs due to two effects on the consumers: 1. The income effect, 2. The substitution effect.
The income effect is the phenomenon in which new classes of potential customers are created due to the price decrease thus increasing the net consumption. As an example, when the air travel ticket price decreases by the introduction of low cost carriers, people who have previously not had a chance to travel by air start to purchase airline services as now air travel is affordable and within their budget constraints. The second effect which is the substitution effect explains that people who consume similar goods change their preferences when one of the good's price changes. They consume less of the costly good and more of the cheaper good. As an example in a substitution scenario in the metals market, Aluminum and steel are competing goods in several cases like automotive applications. Any increase in steel price will lead the consumers to switch over to using more aluminum and vice versa. Thus the consumption of aluminum increases due to
Noting the presence of these two phenomenons in characterizing demand, it may be possible to define economic rebound effect in more formal terms. It is the increase in production and energy consumption due to decreases in price which is brought about because of efficiency improvements. It is sometimes referred to as the "take back" effect as it decreases the potential savings in the energy due to increased consumption and eats away some of the good effect even if it doesn't dominate the good effect of decreasing energy consumption.
It is essential to distinguish between the various forms of rebound in order to better understand the concept. Any increase in the energy efficiency will lead to cost savings and hence price discounts to the consumers. The rebound effect now depends only on how the savings in the price appearing as extra money with the customers is spent. If the saved money is spent on purchasing more of the same good or service, then it is termed as direct rebound. In another case, the saved money may be spent on purchasing more of another good or service belonging to a sector which consumes more energy. In this case the net energy consumption may increase even more leading to what is known as the indirect rebound. A similar economy wide increase in the energy consumed due to price discounts and savings as a sum total is classified as the macroeconomic rebound effect. It often is difficult to characterize the macroeconomic rebound effect as predicting where the saved money will end up is an onerous task. Although possible by observing and characterizing the general spending patterns, it may be difficult to predict the flow of the saved money and its recirculation in system wide context. Hence attempts in estimating the rebound are often made in the microeconomic scale and predictions on macroeconomic effects are then stated based on the magnitude of the microeconomic values.
A similar attempt is tried in the present work. In the first place a formulation is developed for finding the microeconomic rebound effect. As it was mentioned, the microeconomic rebound effect depends on how an efficiency increase will decrease the price and also on the manner in which a decrease in price will increase the demand. Consider the case when the energy efficiency of a process to produce a good or service is doubled from its previous value, owing to technological changes. If we know what the change in the cost is for the producing firm after the efficiency improvement, we can get an idea of the price
discount that the firm might offer under a given set of market conditions. Ideally in a perfect competition amongst producing firms, it can be assumed that all the cost reductions may be offered to the consumers as price reduction as it can be assumed that the technology change is quickly adapted by competing firms too, who may decrease the price in a future date to leverage market potential. As the firms in perfect competition decrease the price, the consumers may buy more of the product or service, in accordance with the markets demand function for that product. The demand function is an expression which relates the quantity consumed by the market under a given set of conditions such as price of the product, price of the competing substitutes, people's tastes, and consumers' income or spending power etc. The important econometric parameter used for explaining the change in the demand as the price varies is the price elasticity of demand. It is the ratio between the percentage change in the quantity demanded when there is a unit percentage change in the price of the good or service keeping all other variables such as consumer tastes, substitute product pricing, consumer income etc constant.
Thus by using these two parameters namely, the price elasticity of demand and the measure of change in the price for a given change in the efficiency, the rebound effect in the economy can be estimated in the micro scale. The formula for rebound hence becomes:
dQ/ Q * dP- P =Microeconomic Rebound effect
dP/ P dq / r
This formulation implicitly makes a few assumptions:
1. All decreases in costs for the firm are transferred to the consumers as decreases in price, under the condition of perfect competition amongst producing firms.
2. All decreases in price of the product are used for buying more of the same product or service. This assumption is made on the basis of axioms of consumer preference which gives the non-satiation and utility maximization under a given budget constraint as its
salient points.
3. There exists no other change in the demand conditions such as variations in the consumers' income, or price changes in the substitutes etc, which will shift the demand curve.
Thus the rebound effect in the microeconomic scale can be evaluated with the help of the formula given above. As both the terms have negative signs, the net rebound term has a positive sign, indicating that any increase in the efficiency will increase the quantity consumed. Further it may be good to note that, the term corresponding to the variation of the price with increase in efficiency can be found by using a methodology of finding the fuel cost and the revenue. A doubling of the energy efficiency will decrease the fuel bill to half of the initial value when the production quantity is the same. Thus the change in price of the product or service is one half of the fuel cost per unit output. From this the percentage change in the price of the product can be found by dividing the change in price by the original price of the product. This value represents the percentage change in the price of the product when the efficiency is doubled .ie., when the efficiency change is
100%. Thus the formula for rebound stated above can be re written in a different form:
1 Initial fuel cost
price elasticity* (- ) = Micro economic Rebound effect
2
Initial revenue
In a more general sense, the rebound definition can be given for any amount of percentage increase in efficiency, apart from just the doubling. Let us define the following variables and their symbols:
p = price per unit
f = fuelcost per unit output e = cost per unit(except fuelcos t)
q = ecoefficiency, measured in units of output per unit fuel input
x = percentage efficiency improvement frominitial = 2 - q1 771
k = total fuel price per unit fuel
the state before the efficiency improvement is 1 and the state after efficiency improvement is '2'
here, p = f + e hence, Ap = Af as 'e' is constant, as they are all other costs other than fuel cost per unit output.
Dividing the above two relations, = Af ... [eqn 1.1]
It is also to be noted that,
k fuel price per unit of fuel
f = -; here the total fuel cos t per unit= fuelpriceperunitoffuel
q output unit of fuel consumed
percentage change in fuel cos t after efficiency increase- = 2
f f k k 772 rll k k if772-71 x, ten k , as q2 = (1+ ), 1 1 hencef2 - f (1+ x)71 q 1-1-x -x Af 1 l+x 1+x f ' 71 -X hence Af = f 1+x from eqn 1.1, Ap Af Ap - x f p f+e p l+x f+e -x* f* Aq Ap/p l+x f+e -1 f; given that, = x, A-7 A 77/q x 1+x f+e
This can be multiplied with the price elasticity of demand for obtaining the rebound effect. If we substitute x=1 for the case of the doubling of the efficiency, then the relation
Ap/p- 1 , reduces to - 1, fuel cos t initial which is the
Aq 1 1+x f +e 2 total cos t of the product'
representation of the previous relation made for the special case.
It is also important to note that this product is only the increase in the quantity consumed and is not representing the change in the energy consumed. To find the change in the energy consumed the following calculation should be performed. If the initial impact per unit production was I1 and the impact per unit output after the efficiency doubling is 12,
subscript 1 indicates the initial condition before the efficiency improvements, and subscript 2 indicates the condition after the increase in the efficiency is brought about for all the variables
The total energy consumed initially is QiI1
The increase in the demand quantity when the price falls due to efficiency decrease is R
-indicating rebound effect
This implies that (1+R)QI will be the quantity after efficiency increase. The total energy consumed after the efficiency increase is (1+R)Q1 * 11/2
1+R
1±R *Qj
2
Actually, if there was no rebound, the energy usage would have been: Q111/2.
Hence there is an R% eat away of the potential benefit, which is termed as the rebound. Thus if the value of R is greater than 1 then the net consumed energy would have effectively increased. This implies that the effect of rebound has swallowed the effect of th
e efficiency improvement thus resulting in a net energy consumption increase.
Sectors of the economy for which rebound is evaluated in this study
As it was mentioned earlier, the microeconomic rebound effect varies with the price elasticity of demand and the share of the total costs spent towards energy. These two parameters vary widely between the products and services in an economy. Thus the rebound effect should be calculated separately for different sectors. Further it may be noted that the rebound effect will be high in the case where the price elasticity of demand and the share of energy cost in the total cost both are simultaneously high. There exist sectors of the economy where both of these quantities may be high enough. The airline travel may be one of the examples. Air travel is said to be quite elastic in its demand at least in the domestic leisure travel market where the bulk of the traveling is made. Moreover, fuel expenses constitute a major share of the costs for an airline firm as the aircrafts consume fuel in high quantities and given that the fuel price is constantly increasing. Owing to these reasons, air travel is considered as one of the sectors for which the rebound is computed.
Apart from air travel, the Aluminum production industry is also a sector which may potentially satisfy the conditions necessary for the existence of high enough rebound. It is known that primary aluminum production is a very energy intensive step and the bulk of the costs for the industry are constituted by energy expenses. Although the price elasticity for aluminum is not expected to be too high, an attempt is made to observe how much the rebound effect may be in some similar situations.
Several other sectors like electricity generation from fossil fuel sources, motor vehicle transport, Nitrogen fertilizer making and iron smelting and steel making, etc have a bulk of their expenses attributed to fuel costs, not many of the sectors may have high enough price elasticity of demand for the rebound effect to be significantly high. Thus the rebound in the sectors other than the air travel and aluminum industry is discussed briefly
in the final part of the work.
Principal Objectives of the study:
The primary aim of the study is to clearly ascertain if the rebound effect if at all exists as a statistically significant figure. Although the theoretical integrity of the concept is proven, it needs to be found out whether in the present scenario and in the future, the rebound effect may ever exists and if so to roughly what extent. It is understood that the computation of macroeconomic rebound effect may in itself be a difficult task to accomplish, predictions and the general trend in the macroeconomic effect can be made. The initial part of the work will include a thorough analysis of the literature and the various economists' and conservationists' opinions on the effect. The work will also include the detailed analysis of the airline and aluminum industries and estimation of microeconomic rebound effect in these two sectors.
Further several discussions on different topics pertaining to the accuracy of the price elasticity of demand estimates, and the trends price elasticity of demand may take in the future etc are made.
In essence, the study strives to make an authoritative summary of the rebound effect and give logically sound estimates under different conditions in order to aid policy making strategies.
Chapter 2. Literature Survey
Several heated arguments supporting and opposing the very fact of existence of the rebound effect have been made in the past two decades. The side supporting the existence of rebound effect, the economists have put forward ideas which explain that any increase in the efficiency will only increase the energy usage in the long run, citing the empirical evidence suggested by the increases in energy consumption and energy efficiency in the past. On the other hand, the conservationists who are mostly technologists and engineers have opposed the existence of rebound as they consider that the energy conservation has the potential to reduce energy needs considerably although they do acknowledge the fact that allied cost savings would increase consumption to a small extent. They have argued that the rebound effect even if theoretically existent will be statistically insignificant and will only lead to trivial changes. The main speakers on this topic have been, Daniel Khazzoom, Leonard Brookes, Harry Saunders and Herbert Inhaber, all supporting the existence of rebound effect. Several other expert publications by researchers like Loma Greening and David Greene commissioned by Oak Ridge National Laboratory, USA, have given mixed feelings about the phenomenon along with some important results. The conservationists group on the other hand consists of researchers like Michael Grubb, Amory Lovins, Richard Howarth and Lee Schipper etc. It is also to be recognized that, most senior economists, policy makers and energy conservation experts have not involved themselves in the discussion and many others remain clueless about whether rebound ever exists or not. However it is for sure that the idea has come a long way from showing itself only in obscure energy journals a few decades back to being more widely known today. The result of the discussion has produced some polemics such as the US book by Herbert Inhaber entitled Why Energy Conservation Fails, which argues, with the aid of an extensive bibliography, that mandated energy efficiency programs are a waste of time and effort. Discussions on the rebound effect have also taken the center stage in several energy economics conferences in the past several years.
The conception and development of the theory:
It may be interesting to look at the very conception of this idea and its spread in order to trace back the different opinions of the two sides in support of their arguments and hence
see how their results can help the present study. The concept was first observed by Stanley Jevons in his classic work "The Coal Question", first published in 1865[Ref 1.2]. Jevons in his paper argues that
'it is a confusion of ideas to suppose that the economical use of fuel is equivalent to diminished consumption. The very contrary is the truth'. He points out that 'the reduction of the consumption of coal, per ton of iron, to less than one third of its former amount, was followed, in Scotland, by a ten fold increase in total consumption, between the years 1830 and 1863, not to speak of the indirect effect of cheap iron in accelerating other coal-consuming branches of industry'
After a rather long hiatus in the discussion, interest was renewed in the late 1970s when it was tried to answer the question if the promotion of energy efficiency (at the micro level) reduce energy consumption (at the macro level)'? By micro level and macro level here we mean the firm level and the national aggregate level respectively.
It was in 1979 and 1980 when Khazzoom [Ref 2.2] and Len Brookes [ref 3.2] attempted to explain that the energy efficiency increases may not always lead to net decreases in the energy consumption in the macro scale. They were guided by historical data which showed that the energy efficiency in most of the sectors of the economy was rising and yet the energy consumption was also on the increase. From several other subsequent publications by Khazzoom and Brookes through out the 1980s and 1990s [Ref 4.2, 5.2, 6.2, 7.2, 8.2], the idea of the existence of rebound effect was well understood by many. In spite of the fact that Jevons, Khazzoom and Brookes had put forward the idea, it was the introduction of Harry Saunders in 1992[ref 9.2] with the publication of his seminal papers, that the idea brought in newer thoughts into the debate. The major difference between the original thinkers namely, Khazzoom and Brookes and Saunders was that the latter had dealt with explaining the phenomenon through more intuitive and logical explanations whereas Saunders was more mathematical in his approach. The mathematical dealing brought in economists like Richard Howarth into the debate with his several arguments denying the existence of any such effect. Saunders was the first to name the rebound effect as Khazzoom-Brookes Postulate recognizing the fact that the duo was the first to pioneer in the research of the phenomenon. The KB postulate may be described as "those energy efficiency improvements that, on the broadest considerations,
are economically justified at the micro level lead to higher levels of energy consumption at the macro level than in the absence of such improvements". Saunders' paper claimed to show that postulate was consistent with neo-classical growth theory which he had applied, over a wide range of assumptions. The KB postulate argued against the views of conservationists - those promoting energy efficiency as a means of reducing energy consumption -that one can identify every little benefit from each individual act of energy efficiency and then aggregate them all to produce a macroeconomic total. In essence, the postulate adopts a macroeconomic (top down) approach rather than the microeconomic (bottom up) approach used by conservationists. It warns that although it is possible to reduce energy consumption through improved energy efficiency it would be at the expense of loss of economic output. In other words, the proponents of the rebound idea suggest that the net decreases in the energy consumption can be achieved not just by increasing energy efficiency but also by the use of the correct market instruments by governing bodies like the introduction of taxation and cap and trade systems for limiting the increase in the consumption of any good or service upon price decrease due to efficiency improvement. After all, the good or service consumption increase may be treated as the reason for the increase in the energy consumption and the good or service consumption is increased only due to the decreases in product price brought about by efficiency increases. Hence if it is possible to prevent the product price from falling in spite of the cost decrease due to efficiency increase, the consumption may stay the same accompanied with an efficiency increase leading to a real net reduction in the total energy usage. The mechanism of preventing the prices from falling as suggested by the rebound proponents is, by the use of appropriate taxes and cutting of subsidies.
Opinion of conservationist:
The KB postulate is vigorously disputed by environmentalists. The major clashes have been of Michael Grubb [Ref 11.2, 12.2] with Len Brookes [ref 5.2,6.2]; Amory Lovins [Ref 13.2] with Daniel Khazzoom [Ref 7.2]. Grubb and Lovins have argued that the shift towards the service economy and the large technical potential for energy efficiency (Lovins [Ref 14.2], Olivier [ref 15.2]; Weizsacker [ref 16.2]) will result in reduced national energy use in the future.
In reflecting on the idea of rebound, Richard Howarth who made important expressions denying the existence of rebound, writes[Ref 17.2] that Brookes has put forward this
hypothesis as a general claim without accompanying caveats, and that it does not hold
under most conditions. Similarly he disagrees with the conclusions of Saunders' [ref 9.2] analysis, saying that Saunders does not consider the distinction between energy use and
energy services.... The conclusion of Howarth's analysis is that ...the macroeconomic feedbacks of energy efficiency may be less substantial than Saunders' initial study suggests...
Howarth in his 1997 paper builds a mathematical model to distinguish between the effects of energy services and energy use. By the use of his model he goes to prove that Saunders' estimate of the rebound (1992) from Ref 9.2 is an overestimate and the actual rebound values are far less and are statistically insignificant. However in replying [Ref 18.2] to Howarth's comments on his previous paper, Saunders acknowledges the veracity of Howarth's logic in the discussion. However Saunders suggests a better modification to the modeling method used by Howarth to model energy services and energy use. As reported by Saunders, when the modification is made, the rebound effect re appears as a significantly large effect. Hence it can be learnt that there exists differences between the two groups on even the method that may be used for estimating the effect.
Also in this dialogue are researchers like Schipper, Lorna Greening, and David Greene who are more interested in finding empirical evidence to support their theory that the rebound effect is negligible. Schipper in his 1998 paper [Ref 19.2] with Grubb points out that there exists very little importance of feedback effects in mature sectors of the economy and the main reasons for increase in the energy consumption are the increase of population and affluence of the people. The role of energy efficiency improvement in increasing the consumption is small and owing to this they conclude that energy efficiency improvement has only done more good than bad. In the same paper, Schipper and Grubb think that the emphasis given to energy efficiency policies may be mistaken. They conclude:
More generally, our observations, suggest that the whole rebound debate may have overestimated the importance of energy in determining the mix of human and economic activities in an economy...
If energy and climate matters, it seems better to internalize our concerns, however difficult they are to express as prices, in carbon and other green taxes...
Greening and Greene [Ref 20.2] have also conducted a similar study by using several methods to view the trend in the consumption of various energy intensities. They state the
following in support of the existence of rebound:
...gains in the efficiency of energy consumption will result in the effective reduction in the per unit price of energy consumption for both firms and consumers. As a result,
consumption of energy should increase, partially offsetting the impact of the efficiency gains on fuel use
However after looking at extensive evidence on the micro level and highly uncertain evidence at the macro level, they conclude that:
"...most or all of any reductions in energy use or carbon emissions are not lost to changes in behavior. This leads us to the conclusion that the rebound is not high enough to mitigate the importance of energy efficiency as a way of reducing carbon emissions. However, climate policies that rely only on energy efficiency technologies may need reinforcement by market instruments such as fuel taxes and other incentive mechanisms. Without such mechanisms, a significant portion of the technological achievable carbon and energy savings could be lost to the rebound"
In their 2000 paper in energy economics, Greening and Greene [Ref 21.2], look for empirical evidence for rebound for different sectors of the economy. In certain sectors like Residential space heating, their rebound estimates are around 8-12%. In other residential end use sectors like residential cooling, the rebound estimates are even as high as 50%. This may be attributed to the higher price elasticity of demand for residential cooling when compared to residential heating. Whereas heating may be considered as essential, cooling more often falls in the category of optional luxury product in the residential energy use sector. In other energy use areas such as personal transportation, they predict rebound values anywhere between 20-50% based on a Meta analysis taking several studies made in the US into consideration. They also attempt to estimate an
economy wide energy increase due to the increase in the efficiency. Their estimate is a tiny 0.48% even after considering the return of saved money into sectors of the economy which are too energy intensive. Hence they conclude in their latest study that the system wide energy increase may be negligibly small that the rebound effect cannot potentially lessen the importance of energy conservation.
Inferences from the literature:
The debate between the two groups namely the energy economists who believe that there exists significant rebound in the economy; and the conservationists who support the efficiency improvement policies, has been so fierce only because of the fact that the presence of the rebound effect and its magnitude is not something that can be obtained from social experimentation. Typically in several economy related quests, social scientists conduct societal experiments which may be anything from observing the effect of a policy change to critically designed experiments with multiple effect bearing groups. Unfortunately there exists no known method in economic Meta experimentation which can be applied to find the material and energy consumption behavior and the effect of energy efficiency in changing the energy intensity.
Further it should be learnt that the presence of rebound effect in the economy cannot be generalized for all the sectors. The treatment of the study should be more sector-specific in the likes of the study conducted by Greening et al (2000) [ref 21.2].
Apart from all of the mentioned seminal works in the field of Economic rebound, there are several other recent articles which discuss the issue in a more detailed manner.
Another important consideration is that the energy economists supporting the argument that rebound exists, stress on the fact that the calculation should be based on macro economic approaches, as microeconomic rebound may not predict the exact magnitude. A discussion on the more recent studies on the macroeconomic rebound effect and the possible inferences of the macro scale effects from the current study in hand are made in
References:
[1.2] Jevons, Stanley, 1865, The Coal Question - Can Britain Survive? Macmillan
[Extracts in Environment and Change 1974]
[2.2] Khazzoom, J Daniel, 1980, Economic Implications of Mandated Efficiency
Standards for Household Appliances, Energy Journal, Vol. 1, No.4, pp2 1-3 9
[3.2] Brookes, Len, 1979, A Low Energy Strategy for the UK by G Leach et al: a Review and Reply, Atom, No.269, March, pp3-8
[4.2] Brookes, Len, 1990, Energy Efficiency and Economic Fallacies, Energy Policy, Vol. 18, No.2, pp1 9 9-2 0 1.
[5.2] Brookes, Len, 1992, Energy Efficiency and Economic Fallacies -A Reply, Energy Policy, Vol.20, No.5, pp3 9 0-3 92.
[6.2] Brookes, Len, 1993, Energy Efficiency Fallacies - The Debate Concluded, Energy Policy, Vol.21, No.4, pp3 4 6-34 7
[7.2] Khazzoom, J Daniel, 1987, Energy Savings Resulting from the Adoption of More Efficient Appliances, Energy Journal, Vol.8, No.4, pp8 5-8 9.
[8.2] Khazzoom, J Daniel, 1989, Energy Savings from More Efficient Appliances: A Rejoinder, Energy Journal, Vol.10, No.1, pp1 57-16 6
[9.2] Saunders, Harry, 1992, The Khazzoom-Brookes Postulate and Neoclassical Growth, Energy Journal, Vol.13, No.4, pp1 3 1-14 8.
[10.2] Saunders, Harry, 1992, Does Energy Conservation Worsen Global Warming? in Fesharaki, Fereidun & James Dorian, 1992, International Issues in Energy Policy, Development and Economics, Boulder, Co. Westview.
[11.2] Grubb, Michael, 1990, Energy Efficiency and Economic Fallacies - A Reply, Energy Policy, Vol.18, No.8, pp7 83-7 8 5.
[12.2] Grubb, Michael, 1992, Reply to Brookes, Energy Policy, Vol.20, No.5, pp3 92-3 9 3.
[13.2] Lovins, Amory, 1988, Energy Savings Resulting from the Adoption of More Efficient Appliances: Another View, Energy Journal, Vol.9, No.2, pp1 5 5-1 62.
[14.2] Lovins, Amory, 1977, Soft Energy Paths, Penguin
[15.2] Olivier, David et al, 1983, Energy Efficient Futures: Opening the Solar Option, London: Earth Resources Research
[16.2] Weizsacker, Ernst von, Amory & Hunter Lovins, 1997, Factor four: doubling wealth -halving resource use, London: Earthscan
[17.2] Howarth, Richard, 1997, Energy Efficiency and Economic Growth, Contemporary Economic Policy, Vol.XV, Oct 1997, pp1-9.
[18.2] Saunders, Harry, 2000, Does predicted rebound depend on distinguishing between energy and energy services?, Energy Policy, Vol 28, 2000, p4 9 7-5 0 0
[19.2] Schipper, Lee & Michael Grubb, 1998, On the rebound? Using Energy Indicators to measure the Feedback between Energy Intensities and Energy Uses, Paper to IAEE Conference, Quebec, Canada
[20.2] Greening, Lorna & David Greene, 1998, Energy Use, Technical Efficiency, and the Rebound Effect: A Review of the Literature, Hagler Bailly Services, Colorado, USA. Final Report, Proceedings of the 21st International Association for Energy, January 1998
[21.2] Loma A. Greening, David L. Greene, Carmen Difiglio , Energy efficiency and consumption -the rebound effect -a survey, Energy Policy, Vol 28, 2000, p3 8 9-4 0 1
Chapter 3. Rebound in the US aluminum industry:
Economic rebound effect is a measure of how the production of a commodity increases when a price cut due to energy efficiency increase is brought about. The computation of rebound hence involves the knowledge of how a general price decrease will increase production, ie., the measure called price elasticity of demand. It also involves information regarding how the price of a commodity will change when the energy efficiency of production increases. In general the rebound effect can be quantified as the product of these two terms, price elasticity of demand and the efficiency elasticity of price:
dQ/ Q dP/ P* dPIP here Q=production, P=price, eta=efficiency dP/ P dq/ q
several initial assumptions are involved in the computation of this rebound:
1. All decrease in cost due to change in producer's efficiency are transferred to the consumer in the form of price decrease. This happens in the case of perfect competition as the competing companies will also attain similar levels of efficiency increase and will decrease price to leverage on the market potential.
However if there are cartels amongst producers, all the cost reduction to the producers will not be transferred as price reduction. In that case the predicted rebound will be an overestimate of the actual rebound as the price will not reduce as much as expected for a given efficiency increase. As the price does not decrease due to cartel formation, the purchase quantity will not increase despite the efficiency increases and cost reductions at the producer end. Hence the rebound estimate predicted will be a maximum possible value.
2. The consumer behavior and demand curves data available are applicable to the values of decreased prices also. In effect we assume that there is no shift in the demand curve when the price decreases due to efficiency increases. This happens
when all the other parameters such as raw material costs, labor costs etc are kept constant and the energy cost alone decreases due to efficiency increase.
3. The quantity supplied and quantities demanded are equal. That implies that there is no excess stock and all products made are sold.
Other assumptions made are explained where ever they applied.
General Methadology for computing rebound: Aluminum production in US
As mentioned earlier, the two terms price elasticity of demand and the efficiency elasticity of price are to be evaluated separately and then multiplied to obtain the rebound:
Price elasticity of demand:
Price elasticity measure can generally be computed with the knowledge of the price and quantity data for a commodity over time. A simple cost function such as a Cobb Douglas model, can be assumed for relating the price and quantity data.
The definition of price elasticity requires that all the parameters except price to be kept constant and observing the demand at different price levels. However this cannot be assured in the time series data, as this case is not a designed experiment, rather it is a social experiment in which other factors such as consumer taste and income; input prices and related factors also vary along with time. Hence the other variations should be accounted for in the quantity demanded due to factors other than the price change.
The assumed Cobb-Douglas form is
Price=Marginal Cost of production= A =
C
1 *L
QY
B
rE
8N
oHere L = labor cost index, Q= demand quantity, B=bauxite price, E=Electricity price,
N=natural gas price Cl is a constant. A is aluminum price. Several other parameters may also influence the cost to a firm making aluminum, however only these parameters are assumed in our model as these are the most significant ones. Other factors such as fuel oil price, diesel price etc which are minor inputs in the production process are neglected.
We can now transpose the Q and P between the lefthand and right hand sides of the equation and get a generalized form of the quantity produced as a function of the other variables.
Q= C *
L ABbEN
... [1]
Here l,a,b,e,n are the elasticities of variation in quantity with variation in labor cost, aluminum price, bauxite cost, electricity cost, and natural gas cost respectively. The price elasticity of demand will hence be the exponent 'a'
It follows from intuition, that a firm manufacturing aluminum in the case of a perfect competition will decide how much to produce based on these parameters. The firm being in a perfect competition, will be a price taker. The price of aluminum 'A' at any instant will determine how much the firm can afford to produce. The different other factor inputs namely, the labor cost, the raw material cost and the energy costs are also considerations when the firm decides on the quantity that it plans to produce.
It is critical to note here the usage of some of the important assumptions:
1. A profit maximizing firm will set its marginal revenue equal to the marginal cost. This assumption is validated by the following explanation. The marginal profit is defined as the difference between the marginal revenue and the marginal costs. Thus if the marginal revenue for a firm is more than the marginal cost then the marginal profit is more than zero leading to the conclusion that the profit in that regime increases with increasing quantity.
Further if the marginal revenue is less than the marginal cost, then the marginal profit is negative and that means the profit is decreasing with every extra unit that is produced. Hence these two cases suggest that the marginal revenue should be set to the marginal cost so that the profit is maximized as the point of local maxima exists when the derivative changes from positive to negative. This is illustrated in the schematic graph below:
profit
Qty
Fig [1.3]: Explanation of the fact that marginal revenue=Marginal cost for profit maximization
The following points are also to be noted with regard to this formulation:
1. The actual costs to the producer are not required in this case and only an index of the cost is required as the constant C takes care of the scaled up or scaled down factor, and hence the values of elasticities are not affected during computation if scaled values for the inputs are used. However it is assumed that the scale factor is constant with time.
As an example, the actual labor cost for the aluminum industry per unit of output is not an easy quantity to obtain. Hence indices of the labor cost keeping labor cost of year 1997 as 100 can be obtained from ref[1.3] and thus the computation can be performed. The scale factor which is a scalar number can be accounted for by the presence of the constant in the Cobb-douglas model and it is assumed to be invariant with any changes in the labor price.
2. Units and dimensions on the right hand side and the left hand sides of the equation cannot be effectively estimated as a) the powers are unknown before computation, b) even after computation, the unit of the constant term is indeterminate and hence this empirical formulation cannot be used for checking the dimensions on both sides.
3. In answering a question on how a measure of production can be introduced in the equation, it is obvious that only the quantity term there gives the ability for the equation to estimate the price elasticity of demand. Explaining further, there are effects of economies of scale, in this case where the marginal cost is expected to fall as the quantity demanded increases. Hence we may expect initially that the exponent 'a' be negative. The expectation that the marginal cost falls with increase in demand is stemming from the fact that all the inputs are expected to be obtained at lower costs when bought in bulk quantities. Further, Considine[2] in his publication has assumed a generalized cost function for defining the relationship with the price and quantity variations to determine elasticity. In his formulation of the cost function, quantity data is also used and is input in the cost function as a parameter. Although the form of the cost function in the present case is different from that of considine[2], the idea that the quantity can be included in the cost function has been taken reference from that publication.
4. Here the assumption that price and marginal cost of production are equal is made, in accordance with the fact that there exists perfect competition in the market and there are no cartels. If the price is set above the marginal cost of production, then there is incentive for another similar firm to reduce the price and gain more market share. Hence in a perfect competition, it is possible to assume that the marginal cost and price are equal.
Hence from the above mentioned assumptions, it follows that the marginal cost=marginal revenue= price of the product. Thus it is legitimate to theorize that the quantity produced by each firm is dependent on the price and the input cost factors and so the quantity can be written in the functional form as mentioned in equation[ 1].
Further the elasticity parameter 'a' that we obtain, which is the exponent of the aluminum price factor in equation [1] is actually the price elasticity of demand and not the supply elasticity. This is because, the equation now explains how the quantity produced (which is also the quantity consumed) changes when the price changes. This is precisely the definition of the price elasticity of demand.
Table [1.3] : The data used for the computation of the elasticity is shown here below:
Deflated
Labor cost ($/ton) Bauxite pr Deflated electr pr
($/ton)[ref4.3] 33.50 [ref3.3] 5,470,000 5,370,000 4,960,000 5,260,000 5,040,000 5,720,000 6,610,000 6,880,000 6,300,000 6,610,000 6,720,000 7,090,000 7,770,000 7,530,000 6,230,000 6,320,000 6,130,000 6,590,000 (cents/kWh)[ref5.3] 6.52 6.21 6.01 5.81 5.72 5.59 5.49 5.28 5.06 4.9 4.75 4.64 4.53 4.64 4.93 4.68 4.8 4.8 Al prodtn (tons)
The data set used represents the factor input values for the years 1987-2004 all collected from different data sources. The labor price index is a measure of how much the labor cost has changed relatively over the years for the aluminum industry in particular. For this purpose the comparative labor cost for the year 1997 has been indexed to 100. The data for the quantity of aluminum consumed is computed as the apparent consumption which is calculated from data on the net primary and secondary production, net imports and exports in a particular year. The aluminum price data used is the average price of ingot aluminum in the US market. Similarly electricity and natural gas prices are computed as yearly average price for industrial delivery of the respective goods with the
Deflated
Al price Deflated Natl gas pr ($/Mcf)[ref6.3] 4.218 4.065 3.891 3.654 3.219 3.3 3.463 3.355 2.898 3.553 3.646 3.14 3.053 4.212 4.823 3.642 5.218 5.635 Year index[refl.3] [ref3.3]
32.90 35.30 34.00 36.30 33.20 31.40 28.20 25.10 27.90 25.00 22.70 21.10 21.90 21.40 18.40 17.30 19.40 2,280 3,350 2,550 2,030 1,570 1,480 1,330 1,730 2,020 1,630 1,730 1,440 1,420 1,550 1,400 1,300 1,330 1,600 CPI value for deflation, from ref[8.3] 0.696933 0.725767 0.760736 0.80184 0.835583 0.860736 0.886503 0.909202 0.934969 0.962577 0.984663 1 1.022086 1.056442 1.086503 1.103681 1.128834 1.158896
average taken from all the US states. In a similar method, bauxite prices are also computed as yearly averages. The prices for aluminum, bauxite, electricity and natural gas have been deflated using CPI for year 1998 [data from Ref 7.3].
It is in fact true that the aluminum producer, be it primary smelter or secondary melter gets the above mentioned input commodities like bauxite, electricity, natural gas etc at a lower price than the market price. It is natural to reason out that the individual firm's contract price will be lower than the market price as the firms may get volume discounts. Further electricity which has by far the most value amongst the inputs for aluminum smelting may be produced in house in a typical large scale smelter. The firm will generally exploit hydroelectric power resources, by funding the building of such sources. It will hence acquire much needed electricity in large amounts at far lower costs.
However, as mentioned earlier, only an indicator or index of the actual cost is necessary for finding the exponents in equation [1]. It is assumed implicitly here that the contract price for the firm for these input commodities, although lower than the market price, will follow the same trend in the market price. This implies that the contract price subject to short term revisions will be highly correlated to the general market price. A proposition that the trend followed by the two prices will be same to a large extent is assumed in this case. The difference between the cost to the firm and the market price for the commodities shows up in the constant term and does not affect the exponent.
The original equation for the Cobb-Douglas function [1] has been modified to log linearize by taking natural logarithms on both sides.
In Q = In C+ ]ln L + aln A + bln B+ eln E+ nln N ... [2] The terms in eqn [2] are similar to the terms in eqn [1]
A regression fit is then performed to obtain the value of 'a' which is the price elasticity of demand for aluminum. After performing the analysis, it is found that a=-0.07341
The values of the other parameter estimates are:
I -1.12237
a -0.07341 b 0.264544
e -1.98005
n 0.01805
c 19.21948*10^9
Table [2.3] regression parameter estimates
The coefficient of determination of the regression, R2 is equal to 0.7882. The value of the
adjusted R2 is 0.7004 and is obtained after taking into account the number of independent
variables and the number of observations. In this case the number of independent variables, p is 5 and the observations, n are 18 in number.
AdjR2 =- (-R2)
n-n-p-1
This value of the price elasticity of demand which is -0.07341 indicates that a 100% decrease in the price of aluminum will result in a 7.34% increase in the consumption quantity. It may further be noted that the values of the estimates for the coefficients are
subject to a prediction error. It is only meaningful to present these values as maximum likelihood estimates and not exact predictors. However a standard error window for all of these estimates can be computed from the principles of regression analysis. It may be interesting to note the magnitude of the error window and the resulting bounds in which these coefficients may lie for a required amount of confidence.
For the current model given in equation [2] an estimate of the variance of the model is given by the following expression:
s2 SR where SR is given by (Yobserved Yedictd)2 ; s2is now an estimate of U2,
n-p
the model variance.
In general, for any multivariate regression model, involving n observations and p+1
parameters(including 1 constant and p independent variables) , the variance-covariance
matrix can be computed with the formula: [Ref 8.3]
V(b) =[XTX]- a2
Here X is the n * p matrix of the independent variables, and V(b) is the variance of the estimate. The term XTX is a square matrix and its inverse multiplied by the scalar
quantity 02 gives the variance in the estimates. The diagonal values of this matrix yields
the variance for the respective parameter estimates. A square root of this variance gives the standard error involved in the coefficient. A (I- a) confidence interval can be then
constructed so as to predict the likely occurrence of the coefficient. The following formula can be used in this regard:
Interval = estimate+ ta!/2V(b), where ta/2 represents the percentage points of the
t-distribution with a area under the curve lying to the right. The number of degrees of freedom is n-p+1.
Here for the number of degrees of freedom to 12 and the corresponding t statistic of 1.356 for an 80% confidence interval, the values of the standard error can be found and hence the lower and upper bounds can be evaluated:
Lower Upper Estimate bound of bound of from regression regression V(b) SE=sqrt(V(b)) table[2.3] coefficient coefficient
I 0.251104 0.501103 -1.12237 -1.80187 -0.44287 a 0.011651 0.107939 -0.07341 -0.21978 0.072951 b 0.05303 0.230283 0.264544 -0.04772 0.576808 e 0.368555 0.607088 -1.98005 -2.80326 -1.15684 n 0.020421 0.142901 0.01805 -0.17572 0.211825 Ln(c) 8.623466 2.936574 23.67919 19.6972 27.66118
Table [3.3] standard errors in the coefficients and 80% confidence interval
For higher levels of confidence the intervals will be wider and will hence imply poorer accuracy in the coefficients. It can be observed from table [2.3] that the estimates of the coefficients 'n' and 'b' indicating the natural gas and bauxite price elasticities of aluminum demand to be positive meaning that the aluminum demand will increase with increase in the two commodity prices. Although the indication is only weak in the case of natural gas price, this situation is not physically possible. This is explained by the likelihood of the two estimates to lie more close to their respective lower bounds which are negative numbers. Hence the error table [3.3] and the computation of the lower and upper limits of the coefficients serve as an indicator of the meaningful values of the coefficients. A similar approach to the price elasticity of the demand of aluminum indicates that it can be anywhere between a maximum of 0.0729 and a minimum of -0.2197 where in this case the upper bounds are impossible situations.
On the whole the demand is said to be quite inelastic for aluminum in this time interval as the value of the estimate is quite low.
Considine[2] in his publication has arrived at a value of -0.299 for the year 1960 and -0.197 for 1985. In that time interval it is worth to note that smaller price variations
triggered larger demand changes. Hence it is natural that the elasticity was higher. However in the years that followed the market became more insensitive to price changes and the elasticity value dropped. Thus our present value is a good estimate of the
elasticity.
The price-quantity trend during those times has been shown graphically below. It is to be visually identified from the two graphs for the two different time intervals that the general trend of the price-quantity curves is more flat in the former case than in the latter case. Although the fitted lines in the two graphs do not represent any physical measure, it guides to indicate the general nature of consumer behavior in the two study periods. The second graph indicates a steeper curve implying more inelastic demand.
1960-78 with trnd line 8.1 8.05 8 7.95 7.9 7.85 7.8 7.75 7.7 7.65 7.6 * In P n model value
-Linear (model value)
14.2 14.4 14.6 14.8 15 15.2 15.4 15.6
1980-2004 8.2 8 7.8 7.6 7.4 7.2 7 * Series1 * Series2 -Linear (Series2) 15.2 15.7 16.2 16.7 17.2 17.7 18.2 In Q
Fig [2.3] Aluminum Price-quantity data for two different time intervals data from retf3.3]
Price elasticity of demand derived purely from the theory of consumer behaviour:
The method used in the previous section, uses a cost function approach to obtain the nature of variation of the cost to a producing firm which in effect also describes the nature of variation of the consumed quantity when the price is changed. The problem in hand which is to find the demand elasticity can also be solved by following a purely
consumer theory approach. In this methodology, it is asserted that the consumer of a good does not observe the various costs the producing firm may incur in any way other than the price of the product. Hence the consumer's level of purchase or the quantity consumed will depend on the price of the product. Further the consumer will also face a decision problem in choosing amongst the available goods all of which may suit his need. Hence the quantity of one good purchased will depend on the price of the competing and complementing goods too. Moreover, the quantity will also depend on the net amount of resources in hand which the consumer can exchange with the producer. In other words the quantity consumed will be dependent on the income and purchasing power of the
![Fig [1.3]: Explanation of the fact that marginal revenue=Marginal cost for profit maximization](https://thumb-eu.123doks.com/thumbv2/123doknet/14430241.515030/30.918.144.456.111.356/fig-explanation-fact-marginal-revenue-marginal-profit-maximization.webp)
![Table [1.3] : The data used for the computation of the elasticity is shown here below:](https://thumb-eu.123doks.com/thumbv2/123doknet/14430241.515030/32.918.132.879.161.796/table-data-used-computation-elasticity-shown.webp)
![Table [4.3] Data used for regression](https://thumb-eu.123doks.com/thumbv2/123doknet/14430241.515030/42.918.126.694.176.850/table-data-used-for-regression.webp)
![Fig [5.3] Correlation between aluminum and steel prices](https://thumb-eu.123doks.com/thumbv2/123doknet/14430241.515030/43.918.148.684.474.814/fig-correlation-aluminum-steel-prices.webp)
![Table [11.3] Computation of total fuel cost and % of cost towards energy expenditure.](https://thumb-eu.123doks.com/thumbv2/123doknet/14430241.515030/55.918.143.758.110.310/table-computation-total-fuel-cost-cost-energy-expenditure.webp)
![Fig 1.4. Passenger miles flown for US Domestic, passenger flights. Data from ref 1.4]](https://thumb-eu.123doks.com/thumbv2/123doknet/14430241.515030/69.918.150.640.628.938/fig-passenger-miles-flown-domestic-passenger-flights-data.webp)
![Fig 3.4. Graph illustrating air travel depends on GDP percapita. Adapted from ref [2.4].](https://thumb-eu.123doks.com/thumbv2/123doknet/14430241.515030/71.918.154.606.133.460/fig-graph-illustrating-travel-depends-gdp-percapita-adapted.webp)