HAL Id: hal-01024813
https://hal.archives-ouvertes.fr/hal-01024813
Submitted on 16 Jul 2014
HAL is a multi-disciplinary open access
archive for the deposit and dissemination of
sci-entific research documents, whether they are
pub-lished or not. The documents may come from
teaching and research institutions in France or
abroad, or from public or private research centers.
L’archive ouverte pluridisciplinaire HAL, est
destinée au dépôt et à la diffusion de documents
scientifiques de niveau recherche, publiés ou non,
émanant des établissements d’enseignement et de
recherche français ou étrangers, des laboratoires
publics ou privés.
Microwave phase noise properties of optical links
involving small signal and gain saturated optical
amplifiers
Vincent Auroux, Arnaud Fernandez, Olivier Llopis, Pierre-Henri Merrer, A.
Vouzelaud
To cite this version:
Vincent Auroux, Arnaud Fernandez, Olivier Llopis, Pierre-Henri Merrer, A. Vouzelaud. Microwave
phase noise properties of optical links involving small signal and gain saturated optical amplifiers.
28th European Frequency and Time Forum - EFTF 2014, Jun 2014, Neuchâtel, Switzerland. pp.NC.
�hal-01024813�
Microwave phase
small signal
V. Auroux
1,2, A. Fernandez
1,3, O.
1 CNRS, LAAS, Univ. de Toulouse, 3 Univ. de Toulouse, UPS, LAAS, Toulo7 avenue du Colonel Roche ; BP 54200 ; 31 France
Abstract—Phase noise of optical links i
amplifiers is investigated. The amplifier ap significant contributor to the link phase noise aims at determining in which conditions the op noiseless. A comparison between Erbium Amplifiers and Booster Optical Amplifiers evolution of noise floor is finally related measurements.
Keywords—phase noise; optical amplifiers BOA; noise figure; optical links; microwave opti
I. INTRODUCTION Noiseless optical links have widespread the telecommunications field, such as optica a frequency standard [1] or high spectral distribution in satellite [2]. In some cases, the with a classical optical link (laser + modulato is weak and the result is a strong degradation noise ratio. This is the case when a clock performed on a large number of receivers distance. In these cases, the use of an optic help in retrieving a high signal level on the Moreover, the optical amplifier is an essentia some high quality frequency sources, su optoelectronic oscillators [3] in which a mod coupled to a microwave oscillation. In thi high gain and strong saturation power help amplifier-free devices [4]. However, wh amplifier is involved in an optical link, or optical system, it adds its own noise compon be the main contributor to phase noise bot away from the carrier frequency.
It is thus essential to investigate o techniques to reduce this noise contribution the choice of the optical amplifier and th operating conditions. Several types of op technologies are today commercially availab we will focus on two amplifiers: an Erbiu Amplifier (EDFA) and a Booster Optical Am which is a high power Semiconductor Op (SOA). These devices are generally describe small signal gain, saturation output power a and we have investigated their phase noise relation with these parameters.
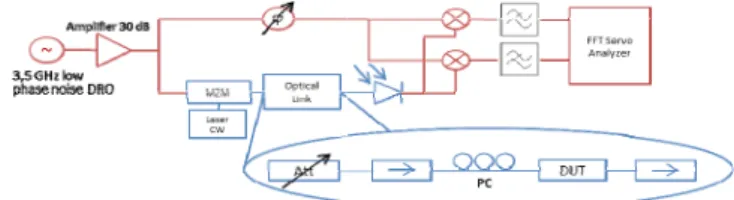
Figure 1 : Residual phase noise attenuator, MZM : Mach Zeh controller)
e noise properties of optical links
and gain saturated optical ampli
Llopis
1 France ouse, France 1031 Toulouse,P.H. Merrer
2,
2 O 16 avenue Didier Da nvolving optical ppears to be a e and this paper ptical amplifier is m Doped Fiber is drawn. The to noise figure s; EDFA; SOA; ics d applications in al distribution of l purity signals e signal received or + photodiode) n of the signal to k distribution is s, or on a long al amplifier can e photodetector. al component of uch as coupled de locked laser is is specific case, ps to design RF hen an optical r a microwave-nents, and it can th close and far n the possible n, which include he choice of its ptical amplifiers le. In this paper, um Doped Fibermplifier (BOA), ptical Amplifier ed through their and noise figure, performance in
Phase noise performan degraded by optical amplitu photodiode. Specific studies this conversion [4]. Thus, i power on the photodiode ha this conversion factor.
Finally, a theoretical appr evolution of the phase noise f of the amplifier noise figure a the carrier to noise ratio (C phase noise floor at the photo II. PHASE NOI
A. Measurement setup
The investigations have link using sucessively two other elements of the link be residual phase noise of the l the measurement setup detail A 3.5 GHz low phase no dielectric resonator oscillato cross correlation phase detec A delay on the RF path has a to the delay introduced by th a possible parasitic detection microwave phase noise add measured in saturated and u amplifiers.
B. Amplitude to phase noise
The first phase noise res phase noise level close to th EDFA. Hence, to determine t measured the amplitude nois
e measurement setup (Att : variable nder Modulator, PC : polarization
involving
ifiers
, A. Vouzellaud
2OSAT
aurat, Toulouse, France
nces in optical links can be ude to RF phase conversion on
have been carried out to avoid in our experiments, the optical as been controlled to minimize roach is presented to predict the floors regarding to the variations and gain. It enables to determine CNR) which corresponds to the
odiode output. ISE IN OPTICAL LINKS
been performed on an optical different optical amplifiers, the eing unchanged. The microwave ink has been characterized with led in [5] and depicted in Fig. 1. oise and low amplitude noise or (DRO), together with and a ction technique, have been used. also been adjusted to correspond he optical link, in order to cancel n of the DRO phase noise. The ed to the optical link has been unsaturated conditions for both
e conversion
ults have revealed an important he carrier (below 1 kHz) for the the source of this noise, we have se of this amplifier at baseband.
Figure 2 : Amplitude (blue) and 3.5 GHz phase noise ( for an EDFA
Phase noise
Figure 3 : Phase noise for an EDFA with (10 mW) and cancellation of amplitude to phase conver W
With cancellation
The low frequency amplitude noise and the m noise of this EDFA are displayed together shape of both spectra is very similar (with t the noise floor which is different at RF) conclude that amplitude to phase conversio for the bump observed on the 3.5 GHz phase to the carrier.
A previous study had been carried out t amplitude to phase conversion on the photod on the technique described in [4]. It consists optical power for which the photodiode ha fluctuations regarding to optical power fluc case, this specific optical power level has be be close to 10 mW. Therefore, in all the presented hereafter, the photodiode is used optical power. The effect of such an optimiza in Figure 3: the optical link with the EDFA i an attenuator inserted between the amp photodiode, and the phase noise is plotted power conditions (10 mW and 16 mW). An phase noise up to 15 dB has been observed a slope of the photodiode. This method wa efficient with the BOA. The RF phase fluc amplifier may result from a different proc amplitude to phase conversion at the ph However, also for the EDFA, the phase noi suppressed by optimizing the amplitude to p at the photodiode level.
(red) measurement
Amplitude noise
without (16 mW) rsion
Without cancellation
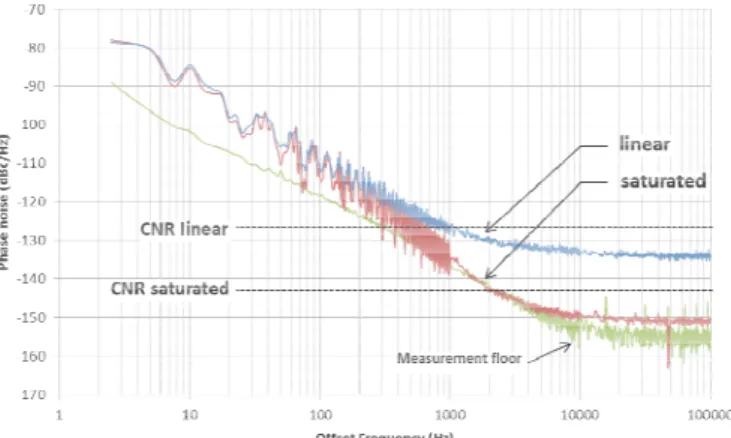
Figure 4 : Phase noise of EDFA i reg microwave phase on Fig. 2. The the exception of ). We can thus n is responsible noise plot close to minimize the diode [6], based in adjusting the as no RF phase ctuations. In our een measured to e measurements d with 10 mW ation is depicted s measured with plifier and the
in two different improvement in at the zero phase as however not ctuations in this ess than simple hotodiode level. ise is not totally phase conversion
III. EDFA VS B Operating conditions of phase noise performances of part of the study is to dete amplifier is noiseless. Ther characterized in two regimes corresponds to the small sign
A. Optical amplifier-free no
To distinguish the phase amplifier itself, it is necessa contributions from the other residual phase noise of the o has thus been measured w measurement represents the reported on both Fig. 4 and F noise floor of -155 dBc/Hz This phase noise level corresp used. Besides, the slope cor below 1 kHz is higher than 1/
B. Amplifiers phase noise
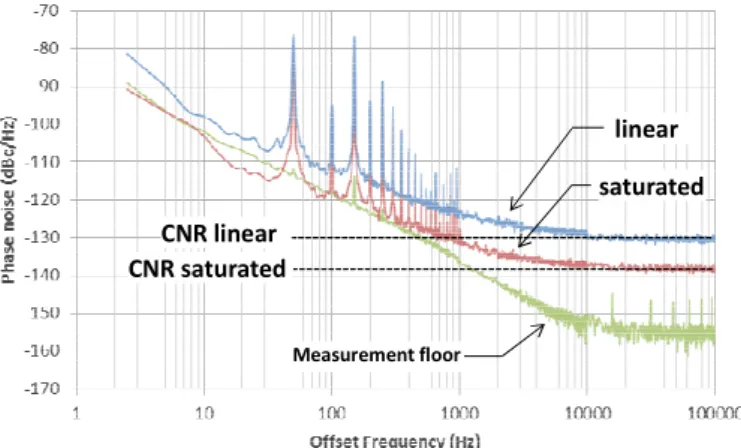
In order to be able to co biased (BOA) or pumped (E small signal gain. Firstly, which is added by the amp sources, it is necessary to eli Measurements for linear and and the BOA are reported on On the one hand, the ED the carrier phase noise leve whereas the BOA phase nois One can notice that the BOA is lower than the EDFA phas more than 10 dB at 10 Hz. O the EDFA have roughly the noise floors. Both amplifiers of their noise floors in the s due to the decrease of the g additive noise: as we reduc amplifier, the noise floor dec has been observed for the ED
in saturated (red) and linear (blue) gimes
BOAPERFORMANCES
an optical amplifier can affect f the optical link. The aim of this ermine in which condition the efore, each amplifier has been : a linear regime, where the gain nal gain, and a saturated regime.
ise floor
e noise which is added by the ary to eliminate the phase noise
optical link’s components. The optical link without the amplifier with the same technique. This
experiment noise floor, and is Fig. 5. One can observe a phase
above 10 kHz from the carrier. ponds to the RIN of the laser we rresponding to the measurement
/f.
ompare both amplifiers, they are EDFA) in order to get the same to distinguish the phase noise lifier itself from the other noise iminate any other contributions. saturated regimes for the EDFA Fig. 4 and Fig 5.
DFA presents the same close to l whether it is saturated or not e is reduced in saturated regime. A phase noise close to the carrier se noise, with an improvement of On the other hand, the BOA and e same behavior towards phase s present an important reduction saturated regime. This is mainly gain. This noise contribution is ced the CNR by saturating the creased. A reduction up to 15 dB
Figure 5 : Phase noise of BOA in saturated (red) and linear (blue) regimes linear saturated Measurement floor CNR linear CNR saturated
BOA. Besides, EDFA’s noise floors are lower than BOA’s, with more than 10 dB improvement at 100 kHz. This could be explained by the difference of noise figure between the two amplifiers. The evolution of the noise floors can be correlated to the variation of the noise figures and gain of the amplifiers. This behavior is detailed in the following section.
Concerning the comparison between EDFA and BOA for time and frequency applications, there is a tradeoff between their respective performances whether one looks for close to the carrier or far from carrier performance.
C. Noise floors evolution
There are several techniques to measure the noise figure of an optical amplifier. We have used the optical way to measure this parameter, as detailed in [8]. The evolution of the noise figure with respect to the input power has been measured for both amplifiers. The noise figure can be expressed as follow:
· · (1) where PASE is the average power of spontaneous emission
integrated on the optical spectral analyzer’s resolution bandwidth Δν and G is the amplifier gain.
Then, it is necessary to express the amplifier phase noise density on the photodiode. This phase noise floor can be related to the optical CNR, which depends on the noise figure, the photodiode current IPD and the optical input power
Pin as follow [8]:
2 · 2·
(2)
From this equation, we can finally express the carrier to noise ratio for the optical link:
10
· · · (3)
where RIN stands for the relative intensity noise of the laser, m the modulation depth, 4kT/Rd and 2qIPD represent
respectively the thermal noise and the shot noise on the photodiode.
Using equation (3), we can compute the noise floor of the measurements described in previous section. Those CNR floors are reported (dashed lines) for each measurement in Fig. 4 and Fig. 5. We can observe that for the BOA, both measurements floors match the calculated CNR associated. It confirms that the major phase noise contribution comes from the amplifier. Indeed, the ratio F/Pin decreases as we saturate
the amplifier since the noise figure is stable in linear regime and slightly increases with the saturation. However, results for the EDFA do not fit the measurements. As one can see on Fig. 4, CNR floors are several dB higher than measured noise floors. Yet, the variation of noise floors with respect to noise figure and gain evolution is well predicted.
IV. CONCLUSION
Microwave phase noise performances of optical links including two types of optical amplifiers, an EDFA and a BOA, has been presented. A correlation between amplitude noise and phase noise close to the carrier for the EDFA has been shown. It led us to adjust the optical power on the photodiode to minimize the amplitude to phase conversion. Then, a study of saturation state for both amplifiers has been carried out to determine the optimal operating conditions. It has been highlighted that there is a tradeoff between EDFA and BOA whether one seeks for an optimization of close to carrier performance or of the far from carrier noise floors. The BOA presents a low 1/f phase noise close to the carrier while the EDFA features a better noise floor due to its lower noise figure. Finally, a model has been presented to predict the variation of the noise floors for both amplifiers.
REFERENCES
[1] F. Narbonneau, M. Lours, S. Bize, A. Clairon, G. Santarelli, O. Lopez, C. Daussy, A. Amy-Klein, et C. Chardonnet, « High resolution frequency standard dissemination via optical fiber metropolitan network », Rev. Sci. Instrum., vol. 77, no 6, p. 064701,
2006.
[2] B. Onillon, B. Bénazet, et O. Llopis, « Advanced microwave optical links for LO distribution in satellite payloads », in Microwave
Photonics, 2006. MWP’06. International Topical Meeting on, 2006,
p. 1–4.
[3] X. S. Yao, L. Davis, et L. Maleki, « Coupled optoelectronic oscillators for generating both RF signal and optical pulses », J.
Light. Technol., vol. 18, no 1, p. 73, 2000.
[4] W. Loh, S. Yegnanarayanan, J. J. Plant, F. J. O’Donnell, M. E. Grein, J. Klamkin, S. M. Duff, et P. W. Juodawlkis, « Low-noise RF-amplifier-free slab-coupled optical waveguide coupled optoelectronic oscillators: physics and operation », Opt. Express, vol. 20, no 17, p.
19420–19430, 2012.
[5] D. Eliyahu, D. Seidel, et L. Maleki, « RF Amplitude and Phase-Noise Reduction of an Optical Link and an Opto-Electronic Oscillator »,
IEEE Trans. Microw. Theory Tech., vol. 56, no 2, p. 449‑456, 2008.
[6] G. Cibiel, M. Régis, E. Tournier, et O. Llopis, « AM noise impact on low level phase noise measurements », Ultrason. Ferroelectr. Freq.
Control IEEE Trans. On, vol. 49, no 6, p. 784–788, 2002.
[7] Z. Abdallah, A. Rumeau, J. Maxin, A. Fernandez, L. Morvan, O. Llopis, et G. Cibiel, « Photodiode nonlinear modeling and its impact on optical links phase noise », EFTF proceeding, 2014.
[8] D. M. Baney, P. Gallion, et R. S. Tucker, « Theory and measurement techniques for the noise figure of optical amplifiers », Opt. Fiber