HAL Id: hal-02060576
https://hal.laas.fr/hal-02060576
Submitted on 25 Jun 2019
HAL is a multi-disciplinary open access
archive for the deposit and dissemination of
sci-entific research documents, whether they are
pub-lished or not. The documents may come from
L’archive ouverte pluridisciplinaire HAL, est
destinée au dépôt et à la diffusion de documents
scientifiques de niveau recherche, publiés ou non,
émanant des établissements d’enseignement et de
Astigmatic multifocus microscopy enables deep 3D
super-resolved imaging
Laura Oudjedi, Jean-Bernard Fiche, Sara Abrahamsson, Laurent Mazenq,
Aurélie Lecestre, Pierre-François Calmon, Aline Cerf, Marcelo Nollmann
To cite this version:
Laura Oudjedi, Jean-Bernard Fiche, Sara Abrahamsson, Laurent Mazenq, Aurélie Lecestre, et al..
Astigmatic multifocus microscopy enables deep 3D super-resolved imaging. Biomedical optics express,
Optical Society of America - OSA Publishing, 2016, 7 (6), pp.2163. �10.1364/BOE.7.002163�.
�hal-02060576�
Astigmatic multifocus microscopy enables deep
3D super-resolved imaging
Laura Oudjedi,1 Jean-Bernard Fiche,1 Sara Abrahamsson,2 Laurent Mazenq,3,4 Aurélie Lecestre,3,4 Pierre-François Calmon,3,4 Aline Cerf,3,4 and Marcelo Nöllmann1,*
1Centre de Biochimie Structurale, CNRS UMR5048, INSERM U1054, Université de Montpellier, 29 Rue de Navacelles, 34090 Montpellier, France
2Lulu and Anthony Wang Laboratory of Neural Circuits and Behavior, The Rockefeller University, New York, NY 10065, USA
3CNRS, LAAS, 7 Avenue du Colonel Roche, F-31400 Toulouse, France 4Université de Toulouse, LAAS, F-31031 Toulouse, France
Abstract: We have developed a 3D super-resolution microscopy method that enables deep imaging in cells. This technique relies on the effective combination of multifocus microscopy and astigmatic 3D single-molecule localization microscopy. We describe the optical system and the fabrication process of its key element, the multifocus grating. Then, two strategies for localizing emitters with our imaging method are presented and compared with a previously described deep 3D localization algorithm. Finally, we demonstrate the performance of the method by imaging the nuclear envelope of eukaryotic cells reaching a depth of field of ~4µm.
© 2016 Optical Society of America
OCIS codes: (180.6900) Three-dimensional microscopy; (050.1380) Binary optics; (050.1950) Diffraction gratings; (110.1080) Active or adaptive optics; (180.2520) Fluorescence microscopy; (100.6640) Superresolution.
References and links
1. E. Betzig, G. H. Patterson, R. Sougrat, O. W. Lindwasser, S. Olenych, J. S. Bonifacino, M. W. Davidson, J. Lippincott-Schwartz, and H. F. Hess, “Imaging intracellular fluorescent proteins at nanometer resolution,” Science 313(5793), 1642–1645 (2006).
2. M. J. Rust, M. Bates, and X. Zhuang, “Sub-diffraction-limit imaging by stochastic optical reconstruction microscopy (STORM),” Nat. Methods 3(10), 793–796 (2006).
3. S. T. Hess, T. P. K. Girirajan, and M. D. Mason, “Ultra-High Resolution Imaging by Fluorescence Photoactivation Localization Microscopy,” Biophys. J. 91(11), 4258–4272 (2006).
4. B. Huang, W. Wang, M. Bates, and X. Zhuang, “Three-dimensional super-resolution imaging by stochastic optical reconstruction microscopy,” Science 319(5864), 810–813 (2008).
5. I. Izeddin, M. El Beheiry, J. Andilla, D. Ciepielewski, X. Darzacq, and M. Dahan, “PSF shaping using adaptive optics for three-dimensional single-molecule super-resolution imaging and tracking,” Opt. Express 20(5), 4957– 4967 (2012).
6. S. R. P. Pavani, M. A. Thompson, J. S. Biteen, S. J. Lord, N. Liu, R. J. Twieg, R. Piestun, and W. E. Moerner, “Three-dimensional, single-molecule fluorescence imaging beyond the diffraction limit by using a double-helix point spread function,” Proc. Natl. Acad. Sci. U.S.A. 106(9), 2995–2999 (2009).
7. M. F. Juette, T. J. Gould, M. D. Lessard, M. J. Mlodzianoski, B. S. Nagpure, B. T. Bennett, S. T. Hess, and J. Bewersdorf, “Three-dimensional sub-100 nm resolution fluorescence microscopy of thick samples,” Nat. Methods 5(6), 527–529 (2008).
8. B. Hajj, J. Wisniewski, M. El Beheiry, J. Chen, A. Revyakin, C. Wu, and M. Dahan, “Whole-cell, multicolor superresolution imaging using volumetric multifocus microscopy,” Proc. Natl. Acad. Sci. U.S.A. 111(49), 17480–17485 (2014).
9. S. Abrahamsson, J. Chen, B. Hajj, S. Stallinga, A. Y. Katsov, J. Wisniewski, G. Mizuguchi, P. Soule, F. Mueller, C. Dugast Darzacq, X. Darzacq, C. Wu, C. I. Bargmann, D. A. Agard, M. Dahan, and M. G. L. Gustafsson, “Fast multicolor 3D imaging using aberration-corrected multifocus microscopy,” Nat. Methods 10(1), 60–63 (2012). 10. S. Geissbuehler, A. Sharipov, A. Godinat, N. L. Bocchio, P. A. Sandoz, A. Huss, N. A. Jensen, S. Jakobs, J.
Enderlein, F. Gisou van der Goot, E. A. Dubikovskaya, T. Lasser, and M. Leutenegger, “Live-cell multiplane three-dimensional super-resolution optical fluctuation imaging,” Nat. Commun. 5, 5830 (2014).
11. S. Ram, E. S. Ward, and R. J. Ober, “3D single molecule tracking and superresolution microscopy using multifocal plane microscopy,” Proc. IEEE Int. Symp. Biomed. Imaging 2012, 914–915 (2012).
12. S. Abrahamsson, M. McQuilken, S. B. Mehta, A. Verma, J. Larsch, R. Ilic, R. Heintzmann, C. I. Bargmann, A. S. Gladfelter, and R. Oldenbourg, “MultiFocus Polarization Microscope (MF-PolScope) for 3D polarization imaging of up to 25 focal planes simultaneously,” Opt. Express 23(6), 7734–7754 (2015).
13. S. Wolter, A. Löschberger, T. Holm, S. Aufmkolk, M.-C. Dabauvalle, S. van de Linde, and M. Sauer, “rapidSTORM: accurate, fast open-source software for localization microscopy,” Nat. Methods 9(11), 1040– 1041 (2012).
14. A. G. York, A. Ghitani, A. Vaziri, M. W. Davidson, and H. Shroff, “Confined activation and subdiffractive localization enables whole-cell PALM with genetically expressed probes,” Nat. Methods 8(4), 327–333 (2011). 15. F. Mueller, A. Senecal, K. Tantale, H. Marie-Nelly, N. Ly, O. Collin, E. Basyuk, E. Bertrand, X. Darzacq, and C.
Zimmer, “FISH-quant: automatic counting of transcripts in 3D FISH images,” Nat. Methods 10(4), 277–278 (2013).
16. L. Schermelleh, P. M. Carlton, S. Haase, L. Shao, L. Winoto, P. Kner, B. Burke, M. C. Cardoso, D. A. Agard, M. G. L. Gustafsson, H. Leonhardt, and J. W. Sedat, “Subdiffraction multicolor imaging of the nuclear periphery with 3D structured illumination microscopy,” Science 320(5881), 1332–1336 (2008).
17. B. J. Beliveau, N. Apostolopoulos, and C.-T. Wu, “Visualizing genomes with Oligopaint FISH probes,” Curr. Protoc. Mol. Biol. 105, 23 (2014).
18. B. J. Beliveau, E. F. Joyce, N. Apostolopoulos, F. Yilmaz, C. Y. Fonseka, R. B. McCole, Y. Chang, J. B. Li, T. N. Senaratne, B. R. Williams, J.-M. Rouillard, and C.-T. Wu, “Versatile design and synthesis platform for visualizing genomes with Oligopaint FISH probes,” Proc. Natl. Acad. Sci. U.S.A. 109(52), 21301–21306 (2012). 19. S. Abrahamsson, R. Ilic, J. Wisniewski, B. Mehl, L. Yu, L. Chen, M. Davanco, L. Oudjedi, J.-B. Fiche, B. Hajj,
X. Jin, J. Pulupa, C. Cho, M. Mir, M. El Beheiry, X. Darzacq, M. Nollmann, M. Dahan, C. Wu, T. Lionnet, J. Alexander Liddle, and C. I. Bargmann, “Multifocus microscopy with precise color multi-phase diffractive optics applied in functional neuronal imaging,” Biomed. Opt. Express 7(3), 855–869 (2016).
1. Introduction
Fluorescence microscopy has proven to be a powerful tool in biology and physical sciences. The use of visible light as a probe enables direct, non-invasive observation of the organization of biological structures or materials at the micrometer scale with high specificity. However, the maximum resolution attainable in standard fluorescence microscopy is intrinsically limited by the diffraction limit of light and is several orders of magnitude lower than for X-ray or electron tomography (typically ~250 nm). In recent years, a new method termed single-molecule localization microscopy (SMLM) that relies on the direct detection of single molecules was able to increase the resolution of conventional fluorescence microscopes by a factor of ~10 in the lateral direction [1–3].
In conventional SMLM, the gain in resolution arises from the precise localization of single emitters labeling the structure of interest, thus enabling the reconstruction of images in 2D with a resolution of ~10-20 nm. Most of the biological structures are, however, three-dimensional. Several strategies have been developed to extend the gain in resolution of SMLM to the third dimension.
The axial symmetry of the microscope point spread function (PSF) and its slow variation around the focal point prevent the accurate axial localization of single emitters. A family of 3D-SMLM methods, usually referred to as PSF engineering, rely on the use of asymmetric PSFs to enable axial localization. Two methods have been introduced to break the axial symmetry of the PSF and thus overcome this limitation. The first implementation used a long focal length cylindrical lens positioned along the imaging path of the microscope to introduce astigmatism in the emission wavefront [4]. This astigmatism results in an elongation of the PSF in one direction below the focal plane and in the perpendicular direction above the focal plane. The axial depth of imaging using astigmatism is limited to ~800 nm [4]. Alternative systems rely on a deformable mirror able to compensate for aberrations (adaptive optics) and in addition introduce a controlled degree of astigmatism to image deeper into diffusive samples [5]. The second implementation of PSF engineering used phase masks or phase-only spatial light modulators to modify the PSF of a single emitter into a double helix rotating in the z direction [6]. In the imaging plane, the two lobes of the double-helix are oriented in a direction that depends on the axial position of the emitter. Double helix PSF SMLM showed up to 2 µm deep imaging.
Another family of strategies takes advantage of the slow variation of the PSF width along the axial direction. The biplane approach consists in imaging emitters on two different planes, slightly defocused one with respect to the other. By simultaneously imaging a single emitter within the two imaging channels, one can measure the (axial) PSF cross section ratio between the images and determine the axial position of the emitter on a depth around 1 µm [7]. This technique has been recently extended to multiple planes imaging by means of multifocus microscopy (MFM) [8] to reach an unprecedented imaging depth of 4 µm. The multifocus microscope based on diffractive optics was first described in 2013 by Abrahamsson et al. [9]. This technology enables the simultaneous imaging of multiple (typically 9 and up to 25) equally-spaced focal planes on a single camera. A different 3D super-resolved multi-plane imaging method was also demonstrated recently using a combination of beam-splitters to enable simultaneous imaging of several planes with multiple cameras [10,11]. Multiple plane detection for SMLM requires the localization of single emitters in 3D stacks after alignment of images from different panels. This process is time and memory consuming.
In this letter, we demonstrate the effective combination of multiple plane imaging using MFM and axial localization of single emitters by PSF engineering (3D-MF-SMLM). This implementation enables deep 3D super-resolved imaging with high localization precision in the three directions with fast localization algorithm processing.
2. 3D-MF-SMLM optical setup
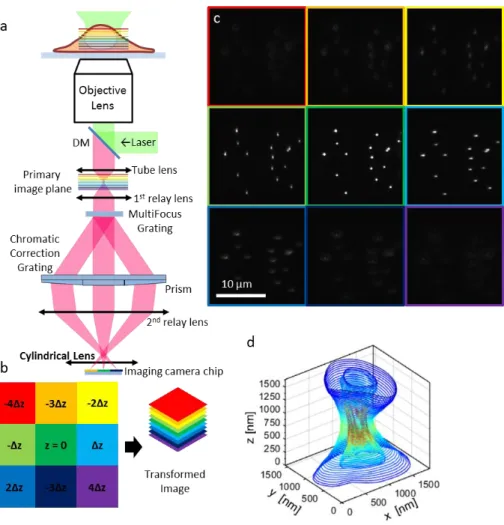
The optical system is positioned at the imaging output of a standard inverted microscope (Zeiss Axiovert 200) in wide field fluorescence microscopy configuration (Fig. 1(a)). A first relay lense L1 (f = 150 mm) is used to form a secondary Fourier plane, conjugate of the objective pupil plane, where the multifocus grating (MFG) is positioned. The MFG splits the fluorescence signal coming from the sample into a set of diffractive orders, their number and intensity being defined by the shape of the diffraction pattern. To create a multifocus image, a geometrical distortion is applied to the grating pattern in order to get a constant focus step dz between each diffraction order. However, due to its diffractive nature, the MFG also introduces chromatic dispersion and is therefore not by itself suitable for high-resolution broadband imaging. This effect is compensated by adding a chromatic correction grating (CCG) after the MFG. The CCG is placed at a distance where the diffractive orders are well separated, without overlap, and each diffraction order goes through a different blazed grating, specifically designed to reverse the dispersion introduced by the MFG. Finally, a multifacet prism is positioned right after the CCG and, combined with a second relay lens L2 (f = 200mm), enables the refocusing of each diffractive order to its corresponding position on the chip of an emCCD camera (IXON DU-897, Andor, Ireland) thus creating an instant focal series (Fig. 1(b)).
In our implementation of the multiple focus microscope, a long focal length (f = 1000 mm) cylindrical lens is positioned in front of the em-CCD camera. This optical element introduces astigmatism in the emitted light wavefront and enables to break the axial symmetry of the PSF [4] (Fig. 1(c) 1(d)). The diameter of the cylindrical lens has to be larger than the space occupied by the different beams coming from the different focal planes in order to induce the same amount of deformation to each diffractive order.
For STORM experiments, a 561 nm excitation laser (Sapphire 561-100 CW, Coherent, UK) and a 405 nm activation laser (Stradus 405-100, Vortran, USA) were combined and collimated by a series of dichroic mirrors and achromatic lenses, individually controlled by an acousto-optic tunable filter (AOTFnC-400.650-TN AAoptics, France) and focused onto the back focal plane of the objective through the rear port of the microscope. The fluorescence signal emitted from the sample was collected by the objective lens, separated from the excitation wavelengths through a four-band dichroic mirror (zt405/488/561/638rpc - Chroma, USA) and filtered using a bandpass filter (ET600/50m, Chroma, USA).
Fig. 1. (a) Schematic illustration of the 3D-MF-SMLM optical setup. The MFG (multifocus grating) splits the fluorescence light into 9 diffractive orders. The chromatic correction module composed of the CCG (chromatic correction grating) and a multifacet prism compensates for chromatic dispersion induced by the MFG and redirects light to the camera. The cylindrical lens introduces astigmatism on the PSF of the emitters imaged on the camera chip. (b) The 9 panels of the camera chip correspond to 9 planes at different axial positions along the optical axis and can be aligned to form a 3D image. (c) Camera image of a sample of fluorescent beads imaged by the 3D-MF-SMLM microscope. The PSF is elongated in different directions in the panels below and above the focal panel of the beads (central panel on this image). (d) 3D shape of the asymmetric PSF of a fluorescent bead. This 3D PSF was acquired by z scanning the bead in the axial direction.
3. MFG fabrication and characterization
The MFG is the key element of the MFM. Its design and performance control the spacing between the imaged planes and the transmission efficiency in a specific spectral range. For the purpose of this study, a binary grating adapted for SMLM was designed and fabricated. The grating function was optimized for an equal distribution of light between 9 different diffraction orders using the pixel flipper algorithm previously reported in [9] and [12]. The grating pattern was then calculated, taking into account the emission range of Cy3b and the desired focus step separating each of the 9 planes.
The numerically generated grating pattern file was sent to the mask printer (DWL 200, Heidelberg, Germany) that uses direct laser writing on a chrome plate coated with photoresist to generate the photolithography mask. After development, this mask was loaded into a
Stepper (FPEA-3000 i4, Canon, Japan) and the grating pattern was transferred onto a fused silica wafer (500 µm thick) coated with 1µm-thick ECI positive photoresist by UV exposition. The wafer was then developed and etched by RIE-ICP with CHF3 gas. The etching time was adjusted to reach the exact design depth according to the spectral range selected for the MFG.
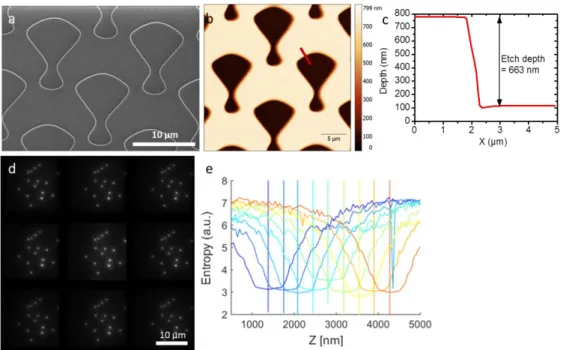
The newly fabricated MFG was characterized by scanning electron microscopy to ensure that the dimensions and aspect ratio of the grating pattern correspond to the expected theoretical values (Fig. 2(a)). In addition, AFM microscopy was used to confirm SEM observations (Fig. 2(b)) and estimate with a nanometer precision the etch depth of the grating (Fig. 2(c)). In the present example, we measured a depth of 663 nm that corresponds to a phase shift of 𝜋 at 606 nm, very close to the center of our emission filter (600 +/ 25 nm).
Fig. 2. Characterization of the multiple focus grating. (a) Scanning electron microscopy and (b) atomic force microscopy (height) images of the binary MFG designed for 9 planes microscopy. The red line indicates the position where the depth profile was acquired. (c) Depth profile of the grating pattern. (d) Axial projection of the image stack acquired during calibration. (e) The entropy in an ROI containing a bead was calculated as a function of axial position for each panel of the camera image. Each panel is represented by a different color. Minimum in the entropy profile represents the piezoelectric stage position at which the plane is in focus.
In order to evaluate the diffraction efficiency of the grating and the homogeneity of the light distribution, a HeNe laser was shined through the grating and intensities in the different diffractive orders were measured. The diffraction efficiency was 63%, close to the maximal theoretical diffraction efficiency of 67% for binary gratings [9]. The light distribution heterogeneity was 5%, and was calculated as the ratio between the standard deviation of the intensities of diffractive orders and the mean intensity of diffractive orders. The homogeneous distribution of light between diffractive orders was confirmed by the homogeneity of intensity of a sample of beads imaged in different panels in Fig. 2(d). This figure is the z projection of a stack of images acquired while scanning a sample of fluorescence beads (Invitrogen TetraSpeck 0.1 µm, Thermo Fisher Scientific, USA) along the optical axis using a piezoelectric stage (Nano F-100, Mad City Labs, USA). The entropy of the images in the different panels during z scan was measured. The axial position of the minimum entropy in each panel corresponds to the focal plane of each panel. The average distance between minimum entropy positions gives the average distance between planes imaged by the microscope: 360 nm.
Careful microfabrication enabled the fabrication of a MFG with transmission properties optimized for single Cy3b imaging and axial spacing optimized for deep 3D super-resolution imaging.
4. Image analysis
The cylindrical lens positioned before the camera modifies the wavefront of fluorescence light of single emitters. As stated before, this translates in an asymmetric PSF in the imaging plane, the ratio between the PSF width in x (wx) and y (wy) is directly related to the axial position of
the emitter.
The position of single emitters was determined by fitting their PSF with an asymmetric 2D Gaussian. The center of this Gaussian corresponds to the lateral position of the emitter, while the axial position is encoded in the PSF asymmetry. In order to establish the relation between the PSF asymmetry and the z position of single emitters, a careful calibration was performed by scanning a sample of fluorescent beads immobilized on a glass slide along the optical axis with a piezoelectric stage (Fig. 1(c)). A bright isolated bead was then selected on each panel of the image stack (Fig. 3(a)) and RapidStorm [13] was used to infer the widths along the x and y directions of its asymmetric PSF (wx and wy). The variation of wx and wy as a function
of the position of the piezo-scanner is represented on Fig. 3(a) for each panel. Data were fitted by a polynomial function of the 3rd degree. These fitted functions were used as calibrations to compute the z position of every emitter localized in each plane. The localizations of a large number of beads (>10) from the calibration stack also enabled the calculation of the geometrical transformation (translation, rotation etc.) between the different panels. Once this transformation is calculated, it can be used to align the localizations extracted from the stack of images acquired during the axial scanning of the beads sample. The reconstructed trajectories recorded along ~4 µm are presented in Fig. 3(b), and show that our method was able to localize emitters over an extended axial depth of field.
An alternative 3D localization algorithm was also implemented in this study. Although, this method still relies on fitting the asymmetric PSF to determine the lateral position of the emitter, the axial localization principle is different. Adapted from the algorithm presented in [14], our method relies on the cross correlation of the PSF with a library of PSF acquired during calibration and corresponding to different axial positions of the emitter (Fig. 3(c)). Each acquired PSF is cross-correlated with all the PSFs in the library to obtain a profile of the cross-correlation coefficient as a function of z position (Fig. 3(d)). The axial position of the emitter is inferred by finding the maximum in the cross-correlation profile by interpolation. During the calibration acquisition, a library of PSF was recorded for every panel. The reconstructed image was then calculated with our localization algorithm. As reported for RapidStorm analysis, the transformation between different panels can be calculated using the calibration stack and used to align localizations from different panels. The trajectories of the beads during the calibration scan reconstructed using the cross correlation algorithm span ~4 µm (Fig. 3(e)).
Fig. 3. (a) RapidStorm calibration curves. Width of the PSF in x (wx ) and y (wy + ) as a
function of the axial position of the fluorescent bead. Solid lines represent the fitted functions used for axial position computation. Each color represents the wx and wy calibration profiles for
a different plane. (b) Reconstructed localizations of the beads positions during z scan. These localizations were computed using RapidStorm. Beads can be continuously followed in an imaging depth of just over 4 µm. Each color corresponds to a different imaging panel. (c) Cross correlation map of the PSF library with itself used for our cross correlation localization algorithm. Colorbar represents degree of cross-correlation (a value of 1 representing complete correlation). Each profile correlated perfectly with itself and reasonably well with profiles at nearby z-positions. (d) Cross-correlation coefficient of the image of a bead with the PSF of the library as a function of the axial position of the PSF of the library (inset: image of the bead). The maximum of this profile corresponds to the axial position of the imaged bead. (e) Reconstructed localizations of the beads during a z-scan. These localizations were computed with our cross-correlation localization algorithm. Each color corresponds to a different imaging panel. As for RapidStorm fitting, beads could be continuously followed in an imaging depth of > 4 µm.
5. Localization precision
Next, we evaluated the performance of multiple-plane detection [8] and 3D-MF-SMLM by imaging fluorescent beads on a glass slide at different excitation powers (Fig. 4(a)-4(c)). 200 frames were acquired for each condition using a 50 ms integration time. The localization precisions were computed as the standard deviation of localized positions for the same emitter for multiple localizations. These acquisitions were done in two different experimental conditions. First, we imaged beads with 3D-MF-SMLM and localized single emitters by nonlinear fitting of the astigmatic PSF using RapidStorm (see Fig. 3(a)-3(b)). Second, we imaged beads with the classical MFM apparatus and analysed them by fitting their 3D position on the 3D image stack by using the FISH-Quant algorithm [15]. This second method required the localization of the same emitter in several planes. The lateral localization precision is comparable in both approaches for different numbers of photons collected (Fig. 4(d)-4(e)), despite the localization of emitters in a single plane in 3D-MF-SMLM as opposed to multiple-plane detection in conventional MFM. The analysis time for 3D-MF-SMLM was five times shorter than for conventional MFM, independently of the number of frames analyzed (from 10 to 10000).
The axial localization precision is slightly degraded in 3D-MF-SMLM as compared to conventional MFM (Fig. 4(f)-4(g)). This degraded localization (~40%) precision can be
explained by the use of a single plane for the former method and the signal from multiple planes for the latter [8]. To improve the axial localization precision of our methods, we applied a cross correlation localization algorithm (see Fig. 3(c)-3(d)) [14] and obtained axial localization precisions comparable to those obtained by 3D-MFM but using a single plane for detection (Fig. 4(g)).
Fig. 4. (a-c) 3D-MF-SMLM images of fluorescent beads at 3 different excitation powers P1 (a) < P2 (b) < P3 (c). Only the plane (i.e. panel) corresponding to the position closest to the emitters focal plane is displayed. The colormap corresponds to the log of the signal. All images are represented using the same color scale. (d-g) Comparison of localization precisions for conventional MFM, asymmetric gaussian fit and x cross correlation localization methods. (d) Lateral localization precision as a function of excitation power. Arrows indicate the powers corresponding to the images shown in (a-c). (f) Axial localization precision as a function of excitation power.(e) Lateral localization precision as a function of the number of detected photons. (g) Axial localization precision as a function of the number of detected photons. In panels e and g, filled symbols represent localization precisions measured for single Cy3b molecules, and grayed areas symbolize the typical range of detected photons associated to single molecule emission.
To get an estimate of the localization precision in biological imaging conditions, we measured the localization precision of antibodies labelled with single Cy3b dyes by STORM with and without the cylindrical lens. Antibodies (anti-rabbit, 2 nM final concentration) were immobilized on a clean coverslip and immersed in a freshly prepared STORM buffer. We estimated the localization precision to be ~20 nm in the lateral direction (Fig. 4(e)) and ~70 nm in the axial direction (Fig. 4(g), filled red circle) with the 3D-MF-SMLM setup. Comparable values were obtained with 3D-MFM (Fig. 4(e), 4(g), filled triangles). These values of the localization precision should enable SMLM in biological samples.
6. Biological imaging using 3D-MF-SMLM
In order to ensure the robustness and test the performance of 3D-MF-SMLM, we performed 3D super-resolution imaging of the nuclear envelope of Drosophila S2 cells by labeling the nuclear lamina. S2 Drosophila cultured cells were seeded onto coverslips coated with poly-L-lysine. Cells were labeled post fixation and permeabilization with a primary mouse anti-lamina antibody (ADL101, DSHB, USA) and a secondary anti-mouse antibody labelled with a single Cy3b molecule. Figure 5(a) shows a typical camera frame during acquisition. Excitation was performed at 561 nm, and photoactivation at 405 nm. The acquisition time was 50 ms and we acquired 4000 frames. The images were analysed with RapidStorm [13] and aligned with our alignment Matlab routine. Drift correction was performed post-acquisition by 3D tracking a fluorescent bead attached to the surface of the coverslip. The reconstructed image shows a homogeneous distribution of lamina around the nuclear envelope of a S2 cell (Fig. 5(b)-5(c)). Spots of higher density already described in [16] appear on this image. Importantly, the imaging depth was over 4 µm (see color bar in Fig. 5(b)-5(c)).
Fig. 5. (a) Raw image of lamina-Cy3b during 3D-MF-SMLM acquisition. Yellow arrow on the top left panel indicates the bead used for drift correction. (b) Axial projection of the 3D image of lamina Cy3b in the cell indicated by the white rectangle on the different panels of the raw image. (c) Projection of the same image in the longitudinal plane. Scale bar, 1µm. Color bar represents axial position.
From this data, we measured a localization precision of ~30 nm in the lateral direction and ~70 nm in the axial direction. This estimate is in good agreement with the localization precision measured for single Cy3b molecules deposited on a coverslip (Fig. 4(e), 4(g)).
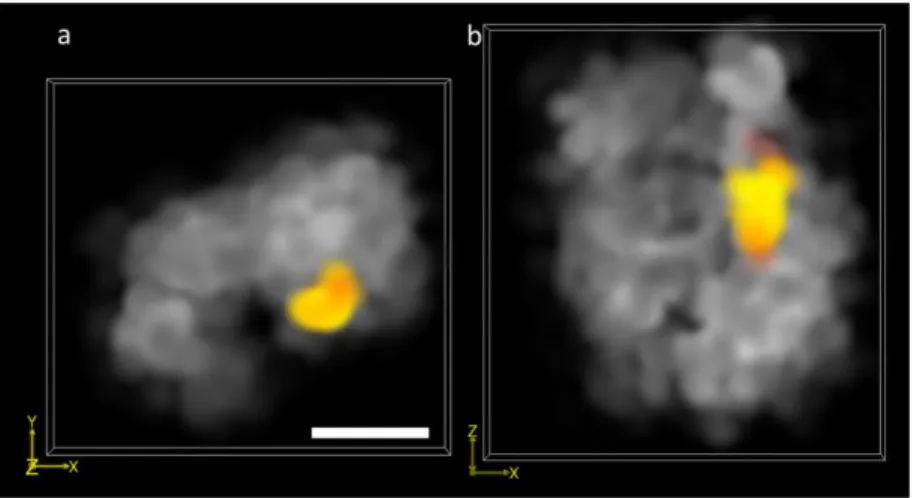
In order to obtain an independent estimation of resolution in our experimental setup, we performed two-color 3D-MF-SMLM imaging of the Fab-7 genomic locus in chromosome 3R in S2 cells and of a large, extended (~300 kbp) chromatin domain called the bithorax complex (BX-C). Fab-7 was labelled with Cy3b using a 4 kbp FISH probe. BX-C was labeled with Alexa 647 using the oligopaint DNA hybridization method [17,18]. The Fab-7 sequence is part of BX-C, thus it would be expected to appear within the volume defined by BX-C. Cy3b imaging was performed using the same experimental conditions as the ones described in the last section. Alexa 647 was excited at 643 nm and activated at 405 nm. 10000 frames were sequentially acquired for each color. As expected, the two different genomic targets exhibited very different sizes and shapes (Fig. 6(a)-6(b)). BX-C was ~500 nm in size, consistent with previous measurements (Beliveau, 2015). Fab-7 was within the BX-C volume, as expected. From line profiles on the images of Fab-7, we measured a size of ~60 nm in the lateral direction and ~100 nm in the axial direction. The size of the Fab-7 locus imaged under identical conditions but with conventional 2D STORM is ~60 nm (data not shown). Thus, the resolution of our setup under real biological conditions is at least 60 nm lateral and ~100 nm axial.
Fig. 6. Two-color 3D-SM-SMLM images of the bithorax complex domain (grey) and the Fab-7 locus (orange). (a) Axial projection of the 3D reconstruction and (b) projection in the (x,z) plane of the same reconstruction. Scale bar, 200 nm.
7. Conclusions and discussion
In this letter, we have combined multifocus microscopy with PSF engineering (3D-MF-SMLM) to enable the fast detection of single emitters in thick samples. We demonstrated the ability of this method to detect single-emitters over an extended axial imaging depth (> 4µm) while maintaining high lateral and axial localization precisions even for low emitter intensities.
General methodologies to design and construct MFGs were described before [12,19]. Here, we presented the construction and characterization of a binary grating with ~400 nm spacing, ideal for 3D-MF-SMLM cellular imaging with organic dyes. With this configuration, we were able to image the nuclear envelope of eukaryotic cells with an imaging depth of over 4 µm. The use of multi-phase gratings with higher transmission efficiencies (from 67 to 92%) [12] and with larger inter-plane distances (e.g. 800 nm) should enable the further extension of the imaging depth to up to ~10µm. We used Cy3b super-resolution imaging of antibody-labeled lamin to demonstrate 3D super-resolution imaging with 3D-MF-SMLM, even though it is well-known that this dye is not the best suited for super-resolution. Further optimization of the MFG and CCG for far red dyes (i.e. Alexa647 or cy5) should thus improve the performance of 3D-MF-SMLM and allow for better resolution. Overall, these improvements will be key for numerous biological applications.
Previous multifocus microscopy method used the detection of single-emitters in multiple planes to achieve 3D nanometer localization. This method is computationally intensive, as it requires the alignment and assembly of the nine imaging planes into a 3D volume, and the non-linear fitting of the PSF of each detected emitter. Instead, 3D-MF-SMLM requires only the detection and localization of emitters in a single imaging plane, this allows for an increase in the distance between MFM planes to reach thicker axial imaging depths. Importantly, this method also allows for a considerable increase in image reconstruction speed without sacrificing localization precision, as it requires the fitting of the emitter PSF in a single plane to yield a 3D localization.
Finally, our development opens the door to further combination of MFM and other PSF engineering methods. Combination of MFM with adaptive optics would enable 3D super-resolution imaging at high penetration depths, and will further lead to an improvement in the photon budget to increase localization precision and extend imaging depth. Use of other PSF engineering methods such as the double helix PSF [6], or adaptations to use other sensors (e.g. sCMOS cameras) could lead to a considerable increase in the axial and lateral imaging
ranges. Excitingly, these future improvements have the potential to further empower super-resolution methods by enabling the imaging of a larger variety of biological specimens. Acknowledgments
We thank F. Bantignies, D. Chamousset, and Mariya Georgieva for help with imaging of BX-C and Fab-7, and B. Hajj for providing Matlab routines. This research was supported by funding from the European Research Council under the 7th Framework Program (FP7/2010-2015, ERC Grant Agreement 260787). We acknowledge France-BioImaging infrastructure supported by the French National Research Agency (ANR-10-INBS-04, « Investments for the future »). S.A. is a Leon Levy Fellow at the Rockefeller University. Authors acknowledge the French RENATECH network.