Comprehensive Geometric Modeling of Human Cerebral
Vasculature for Quantitative Vascular Analysis
by
Changyang Linghu
B.E. Electrical Engineering (2013)
Tsinghua University
Submitted to the Department of Electrical Engineering and Computer Science
in Partial Fulfillment of the Requirements for the Degree of
Master of Science in Electrical Engineering and Computer Science
at the
Massachusetts Institute of Technology
February 2016
2016 Massachusetts Institute of Technology
All rights reserved
Signature of Author
MASSACHUSETTS INSTITUTE OF TECHNOLOGYAPR 15 2016
LIBRARIES
ARCHIVES
Signature redacted
Department of Electrical Engineering and Computer Science
September 29, 2015
Signature redacted
If- I rEdward S. Boyden
Associate Professor, MIT Media Lab
Thesis Supervisor
Accepted by
Signature redacted
;'
-V jLeslie
A. Kolodziejski
Chair, Department Committee on Graduate Students
Certified b
Comprehensive Geometric Modeling of Human Cerebral
Vasculature for Quantitative Vascular Analysis
by
Changyang Linghu
Submitted to the Department of Electrical Engineering and Computer Science
On September 29, 2015 in Partial Fulfillment of the
Requirements for the Degree of Master of Science in
Electrical Engineering and Computer Science
Abstract
In this work we developed a comprehensive and structured geometric model of
human cerebral vasculature for quantitative anatomical analysis. We first proposed a
general and structured geometric representation of the interconnected vascular network as
a framework. We then described an image processing pipeline for the segmentation of
vascular anatomy from discrete scalar field images, and applied the pipeline to segment the
anatomical structures of cerebral vasculatures from whole brain magnetic resonance
angiography (MRA) scans of healthy adult subjects. Next, we employed the proposed
geometric representation to generate the comprehensive geometric model of human
cerebral vasculature from those segmented anatomies. In the end, we performed
quantitative anatomical analysis to the anterior cerebral arteries (ACA) and internal carotid
arteries (ICA), and characterized their varying size and tortuosity in the cerebral arterial
circulation.
Thesis Supervisor: Edward S. Boyden
Title: Associate Professor, MIT Media Lab
Table of Contents
List of Figures ... 4
SIntroduction ... 5
2. Geom etric Representation of Vascular N etw ork... 6
2.1. Introduction ... 6
2.2. Skeletonization... 7
2.3. D iscretization ... 8
2.4. Local vessel geom etric characterization ... 8
3. Segmentation of Human Cerebral Vasculature from MRA Scans ... 9
3.1. Introduction ... 9
3.2. Skull rem oval ... 10
3.3. Pre-segm entation edge preserved sm oothing ... 12
3.4. Segm entation... 12
4. Generation of Geometric Model of Human Cerebral Vasculature... 15
5. Quantitative Analysis of V ascular A natom ies... 17
5.1. Introduction ... 17
5.2. G eom etric analysis of ICA-ACA pathw ay... 19
6. Conclusion ... 21
Appendix: M ethods... 22
List of Figures
Figure 1 The schematic of the geometric representation of a vessel segment...7
Figure 2 The axial maximum intensity projection image of a TOF-MRA scan ... 10
Figure 3 Removing the skull in the M RA image ... 11
Figure 4 Pre-segmentation edge preserving smoothing using a 3D bilateral filter...12
Figure 5 Segm entation process flow ... 13
Figure 6 A segmented cerebral vasculature ... 14
Figure 7 Visualizing the geometric model of human cerebral vasculature...16
Figure 8 The cerebral arterial system and the anterior cerebral arteries...18
1. Introduction
Cerebral vasculature, the circulation system supplying the brain through the
network of blood vessels, is involved in a variety of neurological disorders and
cerebrovascular diseases [1]-[3]. Analysis of the anatomical structure of cerebral
vasculature, including the cerebral arteries and veins, plays an important role in the
diagnosis and evaluation process for these diseases [4],
[5].
In addition, for vascular
intervention as treatment for these diseases, the anatomical structure of cerebral vasculature
partially determines the choice and potentially design of vascular interventional tools [6].
A variety of tools have been developed to image the cerebral vasculature in both health and
disease, including fluoroscopy, Doppler ultrasonography, computed tomography
angiography (CTA) and magnetic resonance angiography (MRA) [7], [8]. Studies based
on these tools show noticeable anatomical variations across individuals [9], [10] and within
the same individual over time [11]. To quantitatively analyze the anatomical structure of
individual cerebral vasculature, a geometric model that represents the geometries and
connections of the vessels in cerebral vasculature is desired. Here we present a
comprehensive and structured geometric model of human cerebral vasculature for
quantitative vascular analysis, and perform quantitative vascular analysis based on the
model as demonstration.
In the following sections, we first introduce a general and structured geometric
representation of the interconnected vascular network as a framework. Then we describe a
3D image processing pipeline for the segmentation of vascular anatomy from discrete
scalar field images, and apply the pipeline to segment the anatomical structures of cerebral
vasculatures from whole brain magnetic resonance angiography (MRA) scans of healthy
adult subjects. After that, we employ the proposed geometric representation to generate the
comprehensive geometric model of human cerebral vasculature from those segmented
anatomies. In the end, we perform quantitative anatomical analysis to the anterior cerebral
arteries (ACA) and internal carotid arteries (ICA), and characterize their varying size and
tortuosity in the cerebral arterial circulation.
2. Geometric Representation of Vascular Network
2.1. Introduction
To be computationally analyzed, the anatomical structure of vasculature must be represented into a geometric model from raw images. Ideally, the geometric model would provide the information about the geometry and connection of all vessels in the cerebral vascular network in a structured manner. This information include the geometric information of individual vessel segments, such as vessel diameter and coordinates, and the information of the connection of the vessels, such as the upstream and downstream neighbor vessels. Here we introduce a skeleton-based vectorized representation of vascular network, where the geometries of vessels are discretized into arbitrarily thin segments and then abstracted as interconnected nodes. Each node contains the geometric information of the corresponding segment as well as the information about the connection to other segments (Figure 1). The geometric information include the center point coordinates of the segment and the radius of the segment. The information about the connection provides the upstream and downstream neighbor segments of the current segment.
b)
d)
Node info: Coordinate Radius Connection info:Parent node list Child node list
Figure 1 The schematic of the geometric representation of a vessel segment. a) A vascular segment from raw data. b) The skeletonization of the vascular segment, the center lines of which are shown as black lines. c) The discretization of the vascular segment. Each black dot indicates a virtual node. d) The final geometric representation of the vascular segment.
2.2. Skeletonization
The original idea of using skeleton to represent three-dimensional objects was first introduced by Blum [12]. and then it has been widely applied to represent vascular segments [13], [14]. The skeleton, also known as center line, is defined as a line inside a tubular structure that connect the two outermost sections with maximal local distance to the vessel boundary at every point. It can be computed by finding the line along which the
a)
integral of the radius of maximal inscribed spheres is minimal on the Voronoi diagram of the vessel [15]. By repeatedly applying this calculation to all the vessels, the skeletons of the vascular network can be extracted [16]. When a vascular branch exists (Figure 1(a)), two skeletons overlap partially. The overlapped portions of the two skeletons are merged into one, and the end point on the overlapped skeleton is noted as a bifurcation point.
2.3. Discretization
The resulting skeleton, or center line, is then discretized into a set of a finite number
of individual points, termed nodes, and each node is the basic unit in the geometric representation of vasculature. Generally, denser discretization would result in more nodes within a certain vascular segment, and therefore less error. Here we choose the discretization density so that the distance between adjacent nodes is one-tenth of the local vessel diameter. Note a bifurcation point would always become a node to accurately characterize the vascular bifurcation, and it has multiple parent nodes and/or child nodes.
2.4. Local vessel geometric characterization
After skeletonization and discretization, the vascular network is now represented as interconnected nodes, and the last step is to assign the local geometric properties to the nodes, such as vessel diameter, cross-sectional shape and area, etc. In this work we focus on the computation of local vessel diameter. Since the cross-sections of vessels are often not in a perfect round shape, the diameter or radius of a vessel would have to be concretely defined to characterize the cross-sectional size of a vessel. The radius of the maximal inscribed sphere at each node characterizes the size of the intravascular space, and could serve as a definition of the vessel radius.
3. Segmentation of Human Cerebral Vasculature from MRA
Scans
3.1. Introduction
Here we introduce a 3D image processing pipeline for the segmentation of vascular anatomy from discrete scalar field images, and apply the pipeline to segment the anatomical structures of cerebral vasculatures from whole brain magnetic resonance angiography scans of healthy adult subjects. The image processing pipeline includes skull removal, 3D edge preserving smoothing, and vascular segmentation.
The MRA scans of healthy adult volunteers were acquired with a 7-Tesla magnetic resonance imaging (MRI) scanner. To better capture both the cerebral arteries and veins, both time-of-flight (TOF) MRA and phase-contrast (PC) MRA [8] were performed on each subject. An additional T1 -weighted MRI scan of brain tissue was also performed on each subject for subsequent tissue-related analysis [17], [18]. The TOF- MRA scans have spatial resolution of 200 microns or 300 microns, and the PC-MRA scans and MRI scans have spatial resolution of 500 microns. The format of the acquired MRA and MRI data is 3D matrix (or three-dimensional discrete scalar field), where each element in the matrix represents a scanned voxel with corresponding signal intensity from the MRI scanner.
Figure 2 The maximum intensity projection of a discrete scalar field image from TOF-MRA scan, with spatial resolution of 300 micron.
3.2. Skull removal
The raw MRA scans contain not only the signals from the cerebral vasculature. but also those from the skull and from the vasculature and tissue on the skull. Before the segmentation of the cerebral vasculature. the unwanted signals of the skull have to be
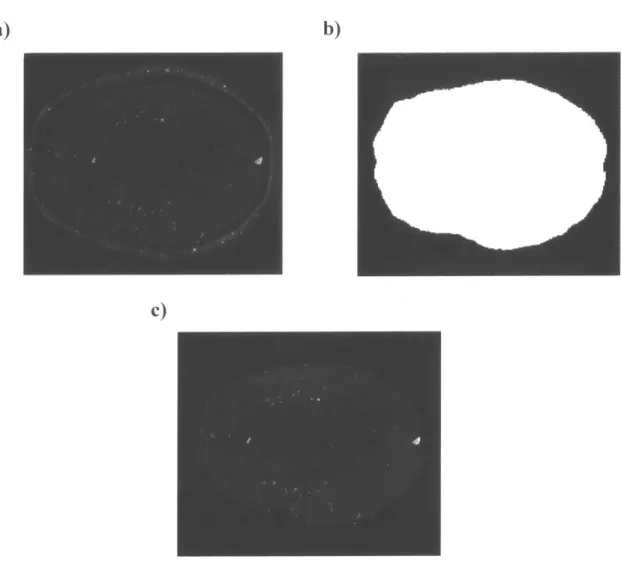
removed due to their potential interference with the segmentation algorithm. Here we took the Ti-weighted MRI scans and generated the masks of the whole brain by binary thresholding. After that, the skull removal was performed by subtracting the signals outside the corresponding brain masks in MRA (Figure 3). The skulls were effectively removed in the MRA scans while keeping the signals from cerebral vasculature intact.
a)
b)
c)
Figure 3 Removing the skull in the MRA image by the brain mask generated from
Ti-weighted MRI image. a) The original MRA image. b) The brain mask from the corresponding Tl -weighted MRI image. c) The MRA image after skull removal.
Pre-segmentation edge preserved smoothing
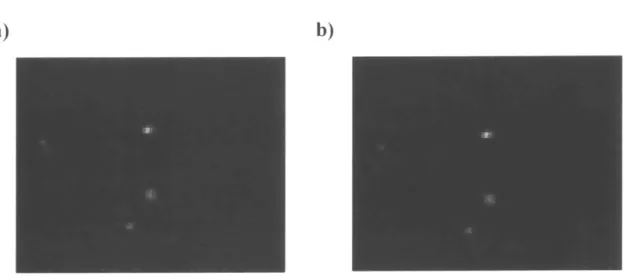
The smoothing of MRA images is another important step before segmentation. The presence of noise in the images would significantly increase the segmentation error, and ideally we would like to reduce the noise while keeping the signals from vasculature intact, especially the edges from bright to dark which contain the information of the boundaries of vessels. Thus. a 3D edge preserving smoothing (EPS) process that increases the signal-to-noise ratio (SNR) of the MRA image is desired. Using the 3D bilateral filter [19]. the background noise is significantly reduced., while the signals from the vessels are kept intact (Figure 4).
a)
b)
Figure 4 Pre-segmentation edge preserving smoothing using a 3D bilateral filter. a) A
zoomed-in region from the original MRA image: b) The same region after the edge preserving smoothing of the whole MRA image. The background noise is significantly reduced while the signals from the vasculature are kept intact.
3.4. Segmentation
The goal of segmentation is to find the boundaries of the vessels for the subsequent geometric representation. After the pre-segmentation processing. the noise and unwanted signals from the MRA scans are largely reduced. and the boundaries of the vessels can be
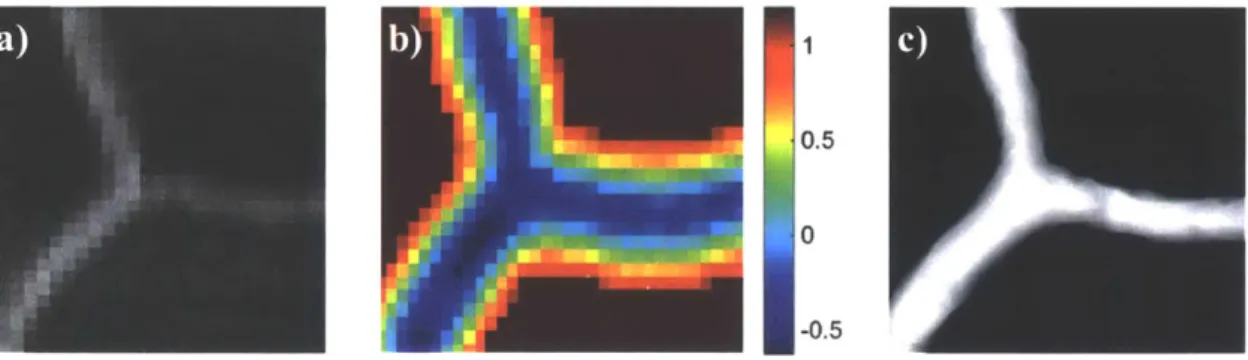
now computed based on the intensities of the voxels in the images. This voxels-to-boundaries conversion can be achieved by the Marching Cubes algorithm. a popular algorithm for the visualization and modeling of medical images originally proposed by Lorensen and Cline [20]. To use the Marching Cubes algorithm to generate the boundaries. a threshold value that defines the intensity of the boundaries must be provided. Note that the optimal threshold value often varies across the whole MRA image, due to the inhomogeneity of the MRI scanner across the whole brain and the dependence of measured signal intensities on vessel size or blood flow rate. To overcome this issue, we used the level set method [21]. [22] to determine the local optimal threshold values and re-assigned the intensity of each voxel in the image so that the local optimal threshold is always zero before applying the Marching Cubes algorithm [15]. The outcome of segmentation is a surface model of the vasculature in the form of polygonal mesh (Figure 5). Figure 6 shows a polygonal mesh model of a segmented cerebral vasculature from a MRA scan with 300 um spatial resolution. It shows that vessels with diameters much larger than the spatial resolution are well segmented through the segmentation pipeline, while smaller vessels whose diameters are close to the resolution limit are sometimes disconnected or missing.
a)i
0.5U
Figure 5 Segmentation process flow, taking a segment of vascular bifurcation for illustration. a) The discrete scalar field image to be segmented. b) The resulted image after applying level set method (positive value: outside the vessel: negative value: inside the vessel: values of the voxels away from vessel boundary are neglected in calculation to decrease computational expensiveness). c) The segmented surface of vessel boundary after applying the marching cubes algorithm to the image in b) with a threshold of zero.
Axial view -I Sagittal view 10mm Corona s view
4. Generation of Geometric Model of Human Cerebral
Vasculature
In this section we discuss the generation of comprehensive geometric models of human cerebral vasculature from segmented images, by applying the previously discussed geometric representation. As mentioned previously, for every segmented image, the maximal inscribed sphere radius was calculated at every spatial point inside the vessels, resulting in a Voronoi diagram. After that, the center lines of all the vessels in the segmented image were calculated. Then the center lines were discretized into interconnected nodes, and in the end the local vessel geometric characterization was performed to extract the local geometric properties like the vessel diameter. Figure 7 shows the visualization of the geometric model of the cerebral vasculature from a subject. In this figure, we can see the diameters of major arteries and veins matched the corresponding vessel size range reported from literature, including the internal carotid artery (ICA), anterior cerebral artery (ACA), middle cerebral artery (MCA), and superior sagittal sinus
(SSS) [23]. We also notice two major artifacts in the model: the missing or disconnected
of vessels, which mostly occur for vessels with size close to the voxel size of the original MRA data; and the presence of non-existing vessels, which is mostly resulted from the segmentation artifacts. The former issue can be overcome by post-segmentation processing methods such as tensor voting [24] or by applying novel imaging methods for higher resolution vascular data [25]; the latter issue can be overcome by increasing the signal-to-noise ratio of vascular imaging [26] or by better pre-segmentation smoothing algorithms.
axial sagittal
5
view view 14.5-4
-3.5
3
12.5
2
1.5
0.5
Vessel
coronal
diameter
view (mm)Figure 7 Visualizing the geometric model of human cerebral vasculature, showing the maximum projection along the axial, sagittal and coronal views, respectively. Color indicates vessel diameter in the images. Vessels with diameters smaller than 300 urn are not included in the model due to the resolution limit of MRA.
5.
Quantitative Analysis of Vascular Anatomies
5.1. Introduction
In this section, we use the geometric model of cerebral vasculature to perform quantitative anatomical analysis for clinically relevant vascular systems. We focus our analysis on the characterization of vessel size, local curvature and integrated turning angle along vessels to characterize the local size, local tortuosity and global tortuosity of vessels [27], [28]. These quantities serve as important metrics in diagnosis and evaluation of cerebrovascular disease such as aneurysm, the abnormal dilation of vessels, and Moyamoya syndrome, the constriction of arteries and the development of small and tortuous collateral arteries around them [11], [29]. With the geometric model, we are able to perform these analyses on all the vessels in the cerebral vasculature, especially for those under intensive clinical and scientific research. For example, the pair of anterior cerebral arteries (ACA) and their branches, which are the major arteries supplying the blood for frontal lobes and superior medial parietal lobes, are involved in a variety of neurovascular diseases including stroke and aneurysm [30], [31]. Arising from the internal carotid arteries (ICA) at the lower part of the head, the ACA arteries show considerable anatomical variations across individuals, which are shown to be correlated with neurovascular diseases
[32]-[35]. Here we focus the analysis on the ACA related vascular pathway as a
i 'V i J - -dfl
Aanc b ra n c)es
c)
b) ACA-A3ACA-A2
ACA-A1
ICA
ACA-A3
ACA-A2
ACA-A1IMCA-MI
ICAFigure 8 The cerebral arterial system and the anterior cerebral arteries. a) Axial view of the three major arterial circulations of the cerebral arterial system: anterior cerebral arteries (ACA). middle cerebral arteries (MCA) and posterior cerebral artery (PCA). b) Sagittal view of anterior cerebral arteries and their branches in the anteromedial aspect of the brain. c) Vascular segments of right ICA, MCA and ACA. The center line of the vessels to be analyzed is highlighted.
a)
5.2. Geometric analysis of ICA-ACA pathway
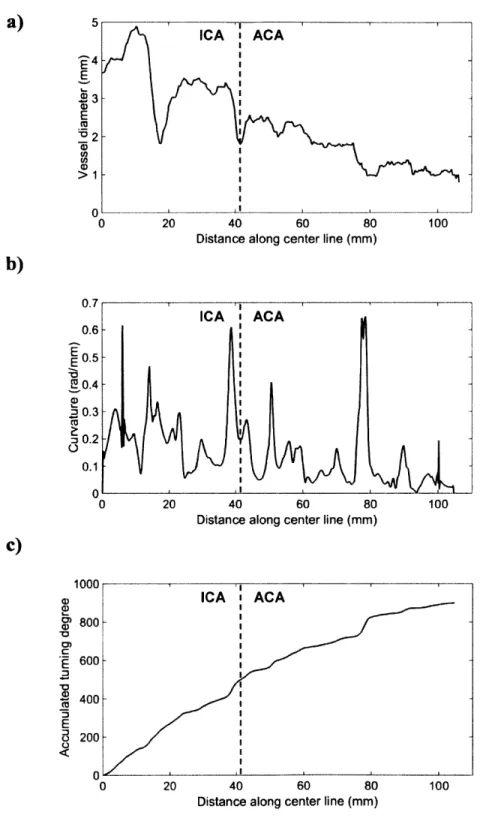
The vascular pathway to be analyzed consists of the Al, A2, and A3 segments of the right ACA and the right ICA that supply the ACA at the bottom of the brain. We first computed the vessel size along the pathway, using the information of radius of maximum inscribed sphere in the geometric model (Figure 9a). To calculate the local curvature along the vascular pathway, the coordinates of the nodes in the pathway were extracted from the model, and were interpolated, smoothed, and parameterized into a space curve. If we let c(t) indicate the space curve, then the local curvature k can be calculated by:
k(t) =
IC'(t)
x C"(t)|
IC'(t)P
where C'(t) and C"(t) are the first and second derivative of C(t) with respect to the parameter t, (Figure 9b). Finally, the integrated turning angle can be calculated by integration of local curvature along the pathway (Figure 9c).
The plot of vessel size along the pathway shows that the vessel size is decreasing as it goes further along the 100 mm long ICA-ACA pathway, with some fluctuations at specific locations such as the bifurcation of ACA and MCA. In the result of local curvature analysis, the ICA-ACA pathway shows varying curvature from 0 to 0.65 rad/mm (or 1.54 mm radius of curvature), with the relatively high tortuosity at several locations. The integrated turning angle calculation shows the whole pathway is turning in space with a relatively steady rate of about 10 degrees per mm.
a)
E E 02 >1 ca >1 0 20 40 60 80Distance along center line (mm)
0 20 40 60 80
Distance along center line (mm)
1000 a) E) 0) 800 600 400 200 A 0 20 40 60 80
Distance along center line (mm)
100
Figure 9 Geometric analysis of the Al, A2, and A3 segments of the right ACA and the right ICA supplying them. a) Vessel size analysis. b) Vessel tortuosity analysis in terms of the local curvature of center line. c) The integrated turning angle of the vessels.
b)
100 0.7 0.6 E0.5 T0.4 .20.3 S0.2 0.1 ICA ACAc)
100 'I ICA i ACA ICA ACA -C C6. Conclusion
In this work we developed a comprehensive and structured geometric model of human cerebral vasculature for quantitative analysis. A general geometric representation of the interconnected vascular network was proposed as a framework, and was applied to the production of whole-brain human cerebral vasculature from segmented vascular anatomies. In addition, we described an image processing pipeline to smooth and segment the anatomy of cerebral vasculature from the MRA scans, and used the MRA scans of healthy adults to generate the geometric model of human cerebral vasculature. In the end, we performed the vascular analysis on the anterior cerebral arteries, showing the vessel size, local curvature and integrated turning angle along the ICA-ACA pathway.
We envision several major improvements of the cerebral vasculature model coming in the future. Firstly, higher resolution whole brain vascular data may be achieved by novel imaging methods, preferably at micrometer scale. Secondly, better segmentation and error correction algorithms could boost the accuracy of the model. Thirdly, generating and collecting the cerebral vasculature models of a large number of individuals from their MRA,
CTA, etc. scans into digital databases could enable the statistical study of cerebral
vasculature anatomy, and potentially could lead to new scientific and therapeutic discoveries.
Appendix: Methods
Data acquisition: The TOF-MRA, PC-MRA and MRI scans of healthy adult volunteers were acquired by Dr. Jonathan Polimeni with a 7-Tesla magnetic resonance imaging (MRI) scanner at the MGH/HST Martinos Center for Biomedical Imaging in Charlestown, MA. All three scans were performed within the same scan session for each subject, with each
session about three hours.
Pre-segmentation processing: performed in Matlab (Mathworks) and FreeSurfer (Martinos Center for Biomedical Imaging).
Segmentation, skeletonization, and discretization: performed in VMTK (OROBIX) and Matlab (Mathworks).
Geometric analysis: performed in Matlab (Mathworks) on the OpenMind computing cluster of McGovern institute, MIT.
References
[1] R. Ross and J. Glomset, "The pathogenesis of atherosclerosis," N. Engl. J Med., 1976. [2] M. M. Esiri, Z. Nagy, M. Z. Smith, L. Barnetson, and A. D. Smith, "Cerebrovascular
disease and threshold for dementia in the early stages of Alzheimer's disease.," Lancet
(London, England), vol. 354, no. 9182, pp. 919-20, Sep. 1999.
[3] M. Riverol, J. T. Becker, 0. L. L6pez, C. A. Raji, P. M. Thompson, 0. T. Carmichael, H. M. Gach, W. T. Longstreth, L. Fried, R. P. Tracy, and L. H. Kuller, "Relationship between Systemic and Cerebral Vascular Disease and Brain Structure Integrity in Normal Elderly Individuals.," J. Alzheimers. Dis., vol. 44, no. 1, pp. 319-28, Jan. 2015.
[4] W. T. Longstreth, "Brain Vascular Disease Overt and Covert," Stroke, vol. 36, no. 10, pp. 2062-2063, Sep. 2005.
[5] W. Powers, "Cerebral hemodynamics in ischemic cerebrovascular disease," Ann. Neurol., 1991.
[6] F. Viuela, G. Duckwiler, and M. Mawad, "Guglielmi detachable coil embolization of acute intracranial aneurysm: perioperative anatomical and clinical outcome in 403 patients.," J. Neurosurg., vol. 86, no. 3, pp. 475-82, Mar. 1997.
[7] A. Leffers and A. Wagner, "NEUROLOGIC COMPLICATIONS OF CEREBRAL ANGIOGRAPHY: A retrospective study of complication rate and patient risk factors,"
Acta radiol., Jul. 2009.
[8] C.-K. Kang, C.-A. Park, Y.-B. Lee, C.-W. Park, S.-M. Hong, Y.-B. Kim, and Z.-H. Cho, "Micro-vascular imaging experiences of time-of-flight MRA at 7T for cerebrovascular diseases," Int. J. Imaging Syst. Technol., vol. 24, no. 2, pp. 121-128, Jun. 2014. [9] H. M. Duvernoy, S. Delon, and J. L. Vannson, "Cortical blood vessels of the human
brain," Brain Res. Bull., vol. 7, no. 5, pp. 519-579, Nov. 1981.
[10] K. N. Kayembe, M. Sasahara, and F. Hazama, "Cerebral aneurysms and variations in the circle of Willis," Stroke, vol. 15, no. 5, pp. 846-850, Sep. 1984.
[11] J. Suzuki and N. Kodama, "Moyamoya disease--a review," Stroke, vol. 14, no. 1, pp. 104-109, Jan. 1983.
[12] H. Bium, "A transformation for extracting new descriptors of shape," 1967. [13] D. Attali and A. Montanvert, "Computing and simplifying 2D and 3D continuous
skeletons," Comput. Vis. Image Underst., 1997.
[14] P. Blinder, P. S. Tsai, J. P. Kaufhold, P. M. Knutsen, H. Suhl, and D. Kleinfeld, "The cortical angiome: an interconnected vascular network with noncolumnar patterns of blood flow," Nat. Neurosci., vol. 16, no. 7, pp. 889-897, Jun. 2013.
[15] L. Antiga, "Patient-specific modeling of geometry and blood flow in large arteries,"
Politec. di Milano, 2002.
[16] G. Pizaine and E. Angelini, "Vessel geometry modeling and segmentation using convolution surfaces and an implicit medial axis," IEEE Int. Symp. Biomed. Imaging, 2011.
[17] J. R. Polimeni, B. Fischl, D. N. Greve, and L. L. Wald, "Laminar analysis of 7T BOLD using an imposed spatial activation pattern in human VI.," Neuroimage, vol. 52, no. 4, pp. 1334-46, Oct. 2010.
[18] K. Fujimoto, J. R. Polimeni, A. J. W. van der Kouwe, M. Reuter, T. Kober, T. Benner, B. Fischl, and L. L. Wald, "Quantitative comparison of cortical surface reconstructions from MP2RAGE and multi-echo MPRAGE data at 3 and 7 T.," Neuroimage, vol. 90, pp. 60-73, Apr. 2014.
[19] S. Paris and F. Durand, "A fast approximation of the bilateral filter using a signal processing approach," Eur. Conf Comput. Vis., 2006.
[20] W. Lorensen and H. Cline, "Marching cubes: A high resolution 3D surface construction
algorithm," ACM siggraph Comput. Graph., 1987.
[21] J. Sethian, "Curvature and the evolution of fronts," Commun. Math. Phys., 1985. [22] S. Osher and R. Fedkiw, "Level set methods: an overview and some recent results," J
Comput. Phys., 2001.
[23] M. J. Cipolla, "The Cerebral Circulation." Morgan & Claypool Life Sciences, 2009. [24] G. Medioni, C. Tang, and M. Lee, "Tensor voting: Theory and applications," Proc. RFIA,
Paris, Fr., 2000.
[25] F. Chen, P. Tillberg, and E. Boyden, "Expansion microscopy," Science (80-.)., 2015. [26] T. W. Redpath, "Signal-to-noise ratio in MRI.," Br. J. Radiol., vol. 71, no. 847, pp. 704-7,
Jul. 1998.
[27] E. Bullitt, G. Gerig, S. M. Pizer, W. Lin, and S. R. Aylward, "Measuring tortuosity of the intracerebral vasculature from MRA images.," IEEE Trans. Med Imaging, vol. 22, no. 9, pp.1163-71,Sep.2003.
[28] E. Bullitt, K. E. Muller, I. Jung, W. Lin, and S. Aylward, "Analyzing attributes of vessel populations.," Med. Image Anal., vol. 9, no. 1, pp. 39-49, Feb. 2005.
[29] M. Fukui, S. Kono, K. Sueishi, and K. Ikezaki, "Moyamoya disease," Neuropathology, 2000.
[30] D. Longo, A. Fauci, D. Kasper, and S. Hauser, "Harrison's Principles of Internal Medicine 18th edition," 2011.
[31] J. Beck, S. Rohde, J. Berkefeld, V. Seifert, and A. Raabe, "Size and location of ruptured and unruptured intracranial aneurysms measured by 3-dimensional rotational
angiography.," Surg. Neurol., vol. 65, no. 1, pp. 18-25; discussion 25-7, Jan. 2006. [32] P. B. Kardile, J. M. Ughade, S. V. Pandit, and M. N. Ughade, "Anatomical variations of
anterior communicating artery.," J. Clin. Diagn. Res., vol. 7, no. 12, pp. 2661-4, Dec. 2013.
[33] S. Gunnal, R. Wabale, and M. Farooqui, "Variations of anterior cerebral artery in human cadavers," Neurol. Asia, 2013.
[34] S. Paul and S. Mishra, "Variations of the anterior cerebral artery in human cadavers: a dissection study," JAnat Soc India, 2004.
[35] A. Zurada, J. S. Gielecki, and R. Tubbs, "Three-dimensional morphometry of the Al segment of the anterior cerebral artery with neurosurgical relevance," Neurosurgery, 2010.