HAL Id: hal-00734406
https://hal.archives-ouvertes.fr/hal-00734406
Submitted on 21 Sep 2012HAL is a multi-disciplinary open access
archive for the deposit and dissemination of sci-entific research documents, whether they are pub-lished or not. The documents may come from teaching and research institutions in France or abroad, or from public or private research centers.
L’archive ouverte pluridisciplinaire HAL, est destinée au dépôt et à la diffusion de documents scientifiques de niveau recherche, publiés ou non, émanant des établissements d’enseignement et de recherche français ou étrangers, des laboratoires publics ou privés.
FOCI Future Orientation for Cities
Moritz Lennert, Gilles van Hamme, Catherine Patris, Maciej Smętkowski,
Adam Ploszaj, Grzegorz Gorzelak, Marek Kozak, Agnieszka Olechnicka,
Katarzyna Wojnar, Janusz Hryniewicz, et al.
To cite this version:
Moritz Lennert, Gilles van Hamme, Catherine Patris, Maciej Smętkowski, Adam Ploszaj, et al.. FOCI Future Orientation for Cities. 2010. �hal-00734406�
FOCI
Future Orientations for CIties
Applied Research 2013/1/1
This report presents the final results of an Applied Research Project conducted within the framework of the ESPON 2013 Programme, partly financed by the European Regional Development Fund.
The partnership behind the ESPON Programme consists of the EU Commission and the Member States of the EU27, plus Iceland, Liechtenstein, Norway and Switzerland. Each partner is represented in the ESPON Monitoring Committee.
This report does not necessarily reflect the opinion of the members of the Monitoring Committee.
Information on the ESPON Programme and projects can be found on www.espon.eu The web site provides the possibility to download and examine the most recent documents produced by finalised and ongoing ESPON projects.
This basic report exists only in an electronic version.
© ESPON & Université Libre de Bruxelles, 2010 Printing, reproduction or quotation is authorised provided the source is acknowledged and a copy is forwarded to the ESPON Coordination Unit in Luxembourg.
List of authors
Coordination: IGEAT - Moritz Lennert, Gilles Van Hamme, Catherine Patris Contribution:
EUROREG: Maciej Smętkowski, Adam Płoszaj, Grzegorz Gorzelak, Marek Kozak, Agnieszka Olechnicka, Katarzyna Wojnar, Janusz Hryniewicz, Roman Szul Géographie-cités: Marie-Noëlle Comin, Denise Pumain
GeoVille: Stefan Kleeschulte, Mirko Gregor
IGUL: Céline Rozenblat, Daniele Ietri, Alexandre Liechti
NTUA: Minas Angelidis, Gabriella Karka, Epameinondas Tsigkas, Kostas Santimpantakis
TERSYN: Jacques Robert
UAB: Jaume Fons, Alejandro Simon
Université Paris-Est, LVMT, Inrets: Sandra Bozzani-Franc, Alain L’Hostis, Laurent Terral
Table of contents
Introduction ...6
Cities as objects of study: a general review of the state and perspectives of cities based on the scientific literature...7
Introduction...7
Evolving demographic and spatial structures of cities ...7
Cities as focal points of economic growth ...9
Urban competitiveness ...9
Future perspectives ... 11
Cities as motors of growth for their hinterlands, their countries and Europe13 A growing social polarization ... 14
The drivers of polarization ... 14
Future perspectives ... 15
Cities concentrating emissions and pollution ... 16
Air... 16 Noise ... 16 Waste ... 16 Land... 17 Future perspectives ... 17 Inter-urban cooperation... 19
Cities as objects of policies: a review of policy visions and policies on cities in Europe ... 20
Changes in metropolitan regions and related policies ... 21
Intra-urban issues and related policies ... 22
New knowledge on cities: Attempts at furthering the empirical knowledge on European cities ... 24
Introduction... 24
Urban extension and urban form ... 24
Introduction... 24
A typology of population development between core cities and LUZ ... 24
A typology of urban spatial development based on Corine Land Cover ... 27
How reliable is Corine Land Cover for analysing urban sprawl ? ... 29
The impact of urban form on urban “performance” ... 29
Social cohesion... 31
Introduction... 31
The relation between economic wealth and social cohesion ... 31
Socio-spatial polarisation ... 33
Conclusions ... 34
Economic development ... 35
Introduction... 35
A typology of the sectoral structure of European cities ... 35
The hierarchy of cities according to their participation in global and European networks... 37
Intermediate cities at the inter-continental level ... 40
Cities in networks of contactability ... 42
Economic differentiation of cities in national and European contexts... 44
Conclusions ... 45
City-hinterland relationships... 46
Introduction... 46
Is there a relation between cities and their hinterland in terms of economic and demographic evolutions ? ... 46
Mechanisms underlying metropolis-region relations ... 50
Cooperation ... 52
Introduction... 52
Measuring functional polycentricity: an impossible quest ?... 52
The future of cities: Scenarios to assess the upcoming challenges for cities ... 57
Scenario hypotheses ... 57
The impacts of the scenarios and possible conclusions... 58
Policy conclusions ... 59
General policy messages... 59
Territorial messages... 60
Future perspectives... 61
Research recommendations... 62
Figures
Figure 1. Typology of intra-urban dynamics in European LUZ, in the years 2000 26 Figure 2. Typologies of urban development (1990-2000) ... 28Figure 3. District inequalities in European cities ... 34
Figure 4. A typology of European cities in terms of sectoral structure 2006 (6 sectors, NUTS 3 approximations of cities) ... 36
Figure 5. Hierarchy of cities according to their participation in global and European networks ... 38
Figure 6. FUAs according to their participation in global and European networks and their population ... 39
Figures 7. Position of European cities as intercontinental (a) gatekeepers, (b) representatives and (c) platforms... 41
Figure 8. City network daily accessibility by rail, air or a combination of air and rail between large European cities between 5h and 23h ... 43
Figure 9. Change of disparities in the development level between the metropolis and its regional hinterland in 1995-2004 ... 47
Figure 10. Typology of metropolitan macroregions (selected types) ... 49
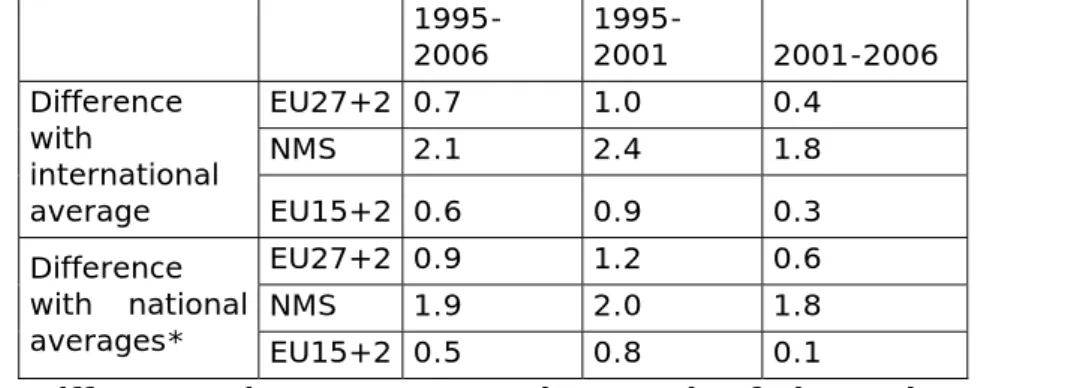
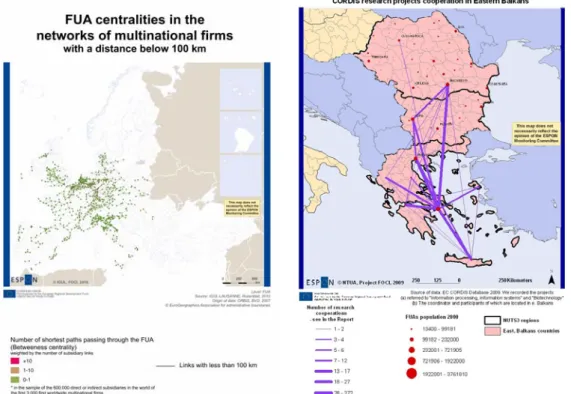
Figure 11. The degree of divergence (correspondence analysis: total inertia) based on NUTS3 sectoral structure in PP urban networks in the ESPON territory 53 Figure 12. a) FUA centralities in the network of multinational firms with a distance below 100km; b) Selected CORDIS research projects cooperation in Eastern Balkans ... 54
Tables
Table 1. The relevance of the city level for different factors of competitiveness . 10 Table 3. Relationship between typologies of city compacity and transport mode to work, and air quality parameters. Data source: Urban Audit ... 30Table 4. Correlation (R Pearson) between economic wealth and unemployment rates, in the years 2000, in static and dynamic terms... 32
Table 5. Correlation (R Pearson) between economic wealth (GDP/head) and some social indicators, in the years 2000... 33
Table 7. Share (%) of the variance in GDP/inhabitant (pps) between cities in 2005 Source: Eurostat... 44
Introduction
“In this economy we need to pay particular attention to our cities. They are challenges and key to solutions at the same time. Challenges, because they waste a lot of energy and resources and generate up to 70% of all CO2 emissions and are often places where problems of social exclusion and poverty accumulate. Solutions, because they offer vast possibilities for innovation and integration, and their compact structure gives a huge potential to save energy. With over 70% of Europeans living in cities we need to focus on a smart and sustainable urban policy.”
Johannes Hahn, Commissioner for Regional Policy “The Future of Cohesion Policy”, Speaking points - Press Conference on the
5th Cohesion Report, Brussels, 10th November 2010
Interest in cities is growing again in Europe. Theories of “growth poles” forgotten since the 1960s re-emerge, although in different form, without the idea of building new cities in the desert. Metropolitanisation, although sometimes difficult to grasp empirically, is recognized as a post-fordist phenomena, with a gain of the importance of large cities, linked to the increasing need for size-based agglomeration effect in the global, networked knowledge economy. And European policy makers are once again discussing the need of and the form for new urban policies at European (as witnessed by the above quote), but also at national scale. From the outset, this project has had two, complementary, but not always easily reconcilable orientations: provide a broad overview of the current and future issues relevant to urban development in all of Europe, advance scientifically beyond the established and well-known data and analyses, provide innovative research. As this report was elaborated in parallel to the new State of European Cities report to be published by DG Regio, we also aimed at complementarity with that report, not wanting to repeat the same analyses based on the same data.
In this project, we, therefore, worked in three parallel strands. First, all teams went through the current literature to extract the knowledge about trends, perspectives and, most importantly, driving forces for urban development in their thematic fields. Second, each of the teams focused on one or two innovative empirical research questions, generally tapping new data sources. Finally, our scenario team has taken the work of the other teams, and substantially augmented it through additional literature review, aiming at covering an even larger horizon and to provide a complete knowledge base on urban development, necessary for integrated prospective thinking. On this basis the scenarios were developed. The structure of the report reflects these three strands, adding a fourth, new strand, which consists in an assessment of the current national policy visions on urban issues across Europe. Details of all the literature reviews and analyses are presented in the scientific report.
Cities as objects of study: a
general review of the state
and perspectives of cities
based on the scientific
literature
Introduction
Urbanisation has been a secular process shaping the European settlement structure heterogeneously in time and space, so that the present, synchronic observation reveals a patchwork of quite different situations, reflecting both the various phases of the process and the geographic and historical peculiarities of the areas concerned.
We intend here to show, based on the current literature, what have been the major trends of urban development in recent years as well as the geographical differences at macro-regional scale in these trends.
Evolving demographic and spatial structures of
cities
The demography of cities – especially when not considering the biggest ones – is very much in accordance with the regional and national trends in which they are embedded.
However, cities in general – at least beyond a certain level of the urban hierarchy – have a specific position in the migratory process. They attract young populations (students, young active and foreign immigrants) and expulse older active (active adult’s households with children, old active people, and young pensioners). According to the position of the cities in the urban hierarchy, this process occurs at the different scales: major cities such as London or Paris and many other capital cities play this role at the national and growingly at the international level (migration of
Considered at intra-regional scale, the long-term “urbanisation cycle” started a long time ago with a phase called “urbanisation phase”, driven by rural-urban migrations and industrialisation. It was followed by the “suburbanisation phase”, mainly after WWII, during which the suburbs of agglomerations grew faster than the core areas. During the third phase, suburbanization has intensified and has sometimes been called counter-urbanization, a process mainly observed in the most urbanized and dense parts of Europe. In this phase, the shifts take place to the urban periphery and beyond towards the small and medium-sized towns of less urbanised metropolitan surroundings, while the core areas loose more people and jobs than the suburbs gain. The last phase is generally one of re-urbanisation, driven by revitalisation policies of inner cities and socio-cultural evolutions. In the present period, suburbanisation trends are still very topical in southern and Eastern Europe, while re-urbanisation is progressing in the cities along an axis stretching from northern England to northern Italy where core cities often show higher population growth than suburban areas. However, even in this part of Europe, it does not necessarily mean the slowing down of suburbanization process, notably in terms of land use.
The demographic results of the current intra-urban migratory movements can be synthesized as follows:
1. A younger population in the city centres, especially in the most central areas where a gentrification process has taken place;
2. A higher share of active households with children in the suburban areas. These middle class populations are the most concerned by the urban sprawl process through suburbanization;
3. Poor immigrants – new comers as well as the second or third generation of ancient immigration – are concentrated in some specific areas of the cities. Two types of geographical structures can be observed regarding the location of immigrant in the cities: concentrations near to the centres (case in Belgium, Germany, UK…) or in specific parts of the suburbs (France, Mediterranean countries).
Given the current age structure, demographic evolutions are well predictable at the European, national and regional level. The number of European regions where population will stagnate and then decline will be growing. The ageing process, which will generally be slower in large cities than elsewhere, will generate growing demand for health care and other services.
Within this context migratory trends are much more unpredictable. For Western Europe as a whole, the question is whether, in the context of the crisis, the extra-European immigration will continue in the next years. However, we may suppose that the most attractive countries for immigration, except for family reunification, will not be the same as in the last decades because most of these countries have been more severely hit by the crisis (Spain, Greece, Ireland and, to a lesser extent, the UK).
Cities as focal points of economic growth
Literature on the economic development of cities is generally based on approximations by NUTS 3 or even NUTS 2 regions. Thus, most of the information available is very similar to general analyses on regional economic development. We will not, therefore, relate here the many studies on regional development across Europe (see, for example, the ESPON 2006 projects 3.3 and 3.4.2, but also the many studies elaborated for DG Regio), but we will look at the implications for cities of the general regional development literature. In a second step, we focus on some of the urban specificities in terms of economic development, notably their insertion as nodes into international economic networks, and the economic relationship to their hinterland.
Urban competitiveness
Competitiveness is one of the fundamental notions in European policy making, as witnessed by the Europe 2020 strategy. In its territorial form, as regional or urban competitiveness, it has been the main focal point of attention of territorial development policy discussions, even though the concept is contested (see chapter 4 of the scientific report for a more in-depth discussion of the issues).
Cities as regions
In first approximation, we build on existing work about regional competitiveness to see the implication for cities. ESPON 3.4.2 identified nine “key drivers of competitive performance” at regional scale. On that basis, we assess what levers exist for cities to influence them (table 1). It is important to note, however, that all the factors discussed in the table only play on one side of the economic equation: supply-side. While even on these issues national forms of economic regulations are important, national demand-side policies such as social redistribution and more generally, the distribution of revenues between labour and capital play a major role in explaining the economic evolution of regions and of cities. Even at the city-level, however, it is necessary to go beyond the
Driver Levers at city level
Economic
diversity / specialisation
The mix of activities in a city is difficult (and some would argue even dangerous) to steer politically. State-aid rules have reduced the ability of public authorities to lead industrial policies. The literature can show some success stories of cluster-oriented policies, but there are just as many failures, and factors of success can often only be identified a posteriori, making the formulation of clear policy recommendations difficult, as path dependency seems to play an important role here.
Human capital The main lever concerning human capital is the general education system, and with the exception of a few city-states, this is not the competency of city level governance structures. Cities may attract better qualified people, for example through housing policies, but such approaches are generally to the detriment of other, more fragile parts of the population. Moving up a scale, attractiveness policies of one city might lead to the loss of population in another city or area, thus instigating a zero-sum game which higher governance levels have to be aware of.
Connectivity /
accessibility Connectivity at European and national scale is generally not decided at city-level, except of cities lobbying transportation and network companies. More local and regional connectivity can, however, often be influenced at the city level and can constitute an important factor of the integration of a hinterland, the capture of human resources, etc. Risks of backwashing have to be taken into account, though.
Quality of life This is probably one of the main factors relevant at city level. Cities can influence many factors of quality of life, be it the build and natural environment, mobility within the city, urban aesthetics, accessibility to services, etc. How much this factor actually influences competitiveness remains an open question. Ideas on the attraction of a creative class have been seriously questioned by many empirical analyses.
Innovation /
Creativity Cities that have the ability to invest in higher education and research can attempt to create the necessary momentum for launching specific research clusters. However, as already mentioned in the part on specialisation, the literature cannot at this stage identify a priori the factors determining success or failure of such attempts, as path dependency seems to play an important role.
Strategy / Vision
Mobilisation / Inclusion
On these two issues, strategy and mobilisation of actors on common projects, city governments can play a role as mediator and as animator of such visions. How much of this can actually create economic dynamics, instead of being more a consequence of it, is not clear from the literature.
Synergy / Proximity / Milieu
Issues of synergy or “milieu” are also highly path dependant and the literature is not clear on how governance can influence the creation of these characteristics. No recipe exists as these factors are highly place-specific.
Implementa-tion capability
The governance capability is an important factor, and one that seems to play an important role, notably in central and eastern Europe. The capability of a city to influence any of the above factors depends on the competencies of its civil servants in the relevant fields and in their capacity for integrated and strategic planning. Here cities obviously have a role to play in the education of their employees and the maintenance of institutional knowledge.
Table 1. The relevance of the city level for different factors of competitiveness
Urban specificities
However, urban competitiveness cannot exactly be assimilated to regional competitiveness and we need to better understand cities’ specificities. Cities are the result of agglomeration effects, with different types of externalities relevant to location:
– Localisation economies, i.e. marshallian or industrial districts or clusters.
– Activity-complex economies, i.e. subcontracting and supply networks.
– Urbanisation economies, i.e. linked to the general availability and diversity of resources in a location with high density of different activities
In this logic, the two first types of economies are not specific to cities, but can also be found in non urban districts. It is, thus, the third type of externalities which seems a particular advantage of urban agglomerations, and more so of the larger ones. However, exactly how these externalities come to play and interact and what might be critical quantitative thresholds for different elements is not known, again making the concept difficult to operationalise. This is also the conclusion of the ESPON Priority 2 project CAEE on agglomeration economies which highlights the many intangible factors and the multiscalar character of economic processes. At the same time, congestion effects may play a counter effect to agglomeration. To a large extent, these congestion effects are related to quality of life (pollution, insecurity, cost of commuting…). However, we do not really know whether or not there are certain thresholds of urban concentration which lead to a decrease in economic performance.
Future perspectives
Future perspectives for the economic development of cities depend mostly on the way crisis exit of the EU and the global economy. This will have fundamental impacts on how cities and their respective roles will evolve. However, the necessary knowledge about this crisis exit will only be available in several years.
BOX 1: The growing importance of networks in the context of
globalization
(see Chapter 8.1 of the Scientific report for more details and literature references)In the context of globalization, it is argued that the prosperity of cities and the dynamics of urban systems depend upon the level of connections of urban nodes to multiple networks as well as upon changes taking place within the networks. Networks generate cumulative effects on specific nodes and poles. In this logic, the centrality of cities in the global economic networks constitutes an important component of urban competitiveness. For example, multinational firms are supposed to confer power to cities not only through their locations but also through their connectiveness. Global centrality thus clearly denotes a positive local urban resource, and worldwide networks provide crucial resources for urban development.
Conversely, systems of cities form a set of resources for multinational firms. Cities allow multinational firms to connect and to take advantage of inter-firm and social networks, thanks to spatial proximity to other agents and to some organized sets of agents, while reducing transaction costs, fostering access to the networks, and increasing transactional mutual values. In addition, local intra-urban interactions increase the effective weight of inter-urban linkages, because they improve their efficiency. Local interactions between multinational firms consist in different levels of involvement in local networks: subcontracting, industrial or technological strategic alliances, access to markets, use of a skilled workforce and local know-how, use of services, institutions, infrastructures.
In parallel, research networks also are considered as revealing potential capacities of cities to invest in future technological and economical development. The relative position of cities in such networks can be considered a proxy of their ability to enter the next cycle of innovation through the established linkages between research centers and high tech start-ups, not only at local level (as implied in the concept of cluster) but within the whole global economic space. The position in research networks appears somehow as a pre-figuration of the position of cities in the early process of adoption of future innovation.
When looking at the functional relationships between urban entities (macro-scale), it appears that the emergence of this new paradigm materialised by the networking of metropolitan areas at wider distances and its superposition to the traditional Christallerian urban hierarchy, occurred earlier in the regions of the European pentagon (London-Paris-Milan-Munich- Hamburg) than elsewhere. This evolution reached more recently the metropolitan areas of the southern and eastern peripheries, where multifunctional networking is less intense and advanced.
Networking activities as already observed at macro-scale between metropolitan areas under the influence of multinational firms, have also emerged, from the 1980s onwards, at intra-regional scale, between metropolitan areas and the surrounding medium-sized and small towns as well as between medium-size towns themselves in a number of less urbanised regions. In numerous cases, they are publicly driven. Networking activities at intra-regional scale are more common in Western Europe than in Central and Eastern Europe, where the growth of metropolitan areas often induces of a backwash effect on the metropolitan hinterlands.
Cities as motors of growth for their hinterlands, their
countries and Europe
(see section chapters 9.1 and 9.2 of the scientific report for more details and literature references)
Metropolisation processes defined as the concentration of functions related to the generation and processing of information, handling capital flows and ensuring attractive location criteria for the headquarters of huge transnational corporations in selected metropolitan centres, coupled with the emergence of global and continental systems of cities, can have serious consequences for regional and local systems. Many authors have put forward the hypothesis that the regional hinterland is no longer needed by metropolises as it does not offer the resources that are necessary for metropolitan development, and is therefore undergoing a relative marginalisation, while the differences in the development level between the metropolis and its regional surroundings are increasing. More differentiated hypotheses about the evolution of the city-hinterland relationships exist. Certain authors see flows of services occurring in a two-level structure. The first such level is made up of global cities, for which the factor of distance does not play any considerable role, while the second relates to the national system of cities and shows the existence of a hierarchical structure in which distance adversely affects mutual interactions. Others reveal a difference between metropolises based to some extent on their position in the network of large cities. This is especially important in the case of capital cities that are far more globally connected (i.e. London, Paris, Amsterdam) than other regional cities (i.e. Stuttgart, Milan). In general, the higher the position of the city, the smaller the significance of ties with regional surroundings for development processes of the metropolis. Furthermore, the regional surroundings seem to have a greater significance in the provision of simple resources: low-processed goods, low-skilled workforce, services which do not require skilled staff or generally accessible information about information rather than processed resources.
To sum up, some differences between cases might be observed depending on city size and its function as well as the economic potential of regional hinterland. One should also have in mind that city-region relations are very complex and strongly depend on the regional and national context.
probable scenario envisages the emergence of a polycentric metropolitan area which may foster development processes across the region.
A growing social polarization
(See chapter 3.1 of the scientific report for more details and literature references)
It seems clear that in the last decades, social polarization (understood here as income disparities) has increased in nearly all rich countries, including the new member states of the EU after the collapse of communism. However, the intensity and the timing of this trend are very different from one country to another.
Because of the lack of comparable data across European cities, there is no systematic empirical assessment of these trends at the city level in Europe. However, many authors argue that this trend has been particularly dramatic in the global cities, whatever the driving forces behind this process. The box “Trends in social polarization in European cities in the introduction to chapter 3 of the scientific report presents an overview of case studies found in the literature.
The drivers of polarization
From the scientific literature, we identify several major driving forces for social polarization in the city.
The economic and labour market driving forces of social polarization in
the city
- growing demand for highly skilled labour (professionalization process) - growing demand for low qualified personal services in low unionized, female, precarious and part-time jobs
- new political form of economic regulation to restore the profit rate which has been possible because of new power relations between capital and work in a period of structural underemployment.
The socio-demographic evolutions and the impact of real estate
- three major driving forces in the socio-demographic field:
• household composition, with a general tendency of household size to decrease and the share of single-person households to increase • international immigration which concentrates in the cities and
particularly the biggest ones
• intra-urban migrations which play a major role in the socio-spatial polarization process, notably through suburbanization and gentrification
- house prices, linked to gentrification and suburbanisation
Political driving forces
- state level welfare policies and redistribution - public policies at the city level:
• social housing system: While Scandinavian or Dutch cities are less spatially polarized because of their high level of social housing, it is not the case for Belgian or French cities, where housing market is nearly entirely privatized.
• economic development policies: These policies often favour the attraction of high-level services and qualified jobs, thus reinforcing the already existing polarisation tendencies on the labour market. • place-based policies: Some authors doubt that these policies really
have an impact on the poor populations of the deprived neighbourhoods which are targeted, but rather that they are simply forced to move elsewhere, mainly through rising housing costs.
Future perspectives
What can we expect in the future according to these major trends and their driving forces?
• The crisis has changed the conditions in the past few years. It is thus very difficult to tell whether social polarization processes will continue in the near future, while it is certain that the crisis will intensify social exclusion.
• According to socio-spatial polarization, we believe that its geographic reshaping – if not its intensity – will continue in the future. This mainly concerns “urban renewal” or “gentrification”, often resulting in negative consequences for the most deprived populations.
• One of the main questions, in line with the literature, concerns the apparent decoupling between social cohesion indicators and economic evolutions. This would mean that, having reached such a high development level, social cohesion in European cities is no more related to pure economic wealth of the population.
Cities concentrating emissions and pollution
(for more details and literature references see chapters 3.1-3.3 of the scientific report)
In order to approach the state of the environment in Europe’s cities the classical approach of environmental vectors seems most adequate for an ESPON project. Relevant vectors to study are air, noise, waste and land, with energy an additional or underlying factor. Many efforts exist, notably by the European Environmental Agency, to analyse the situation along these vectors in Europe, including from an urban perspective.
Air
Despite the progress made in controlling local air pollution, urban areas show increasing signs of environmental stress and air quality is one of the major concerns. PM10, ozone NO2 and SO2 all remain very significant health concerns for many urban residents in Europe. Bad air quality seriously increased respiratory and cardiovascular diseases, in particular with young children or elderly people. These health effects are also linked to high economic losses in form of higher costs for medical treatments and losses for employers for sick workers.
Any actual reductions of emissions have resulted from implementing different policies targeted at specific point sources (e.g. industries), changing fuel types, or regulations for best technologies. However, emissions from transport are still increasing.
Noise
Noise is another environmental issue indirectly related to city form. More than 47 millions people (i.e. 52% of the population living in cities with more than 250 000 inhabitants) are exposed to daily road noise levels exceeding 55 dB Lden (the lower benchmark settled by the Environmental Noise Directive). 33,7 million people are exposed to levels exceeding 50 dB Lnight which has been identified as a dangerous threshold by the World Health Organisation.
Waste
One of the targets set in the 5th Environment Action Programme (EAP) was to reduce the generation of municipal waste per capita per year to the average 1985 EU level of 300kg by the year 2000 and then stabilise it at that level. The target was far from ever being reached and was not repeated in the 6th EAP. The average amount of municipal waste generated per capita per year in many western European countries still exceeds 550kg. Municipal waste generation rates in new Member States are lower than in western European countries.
Land
The spatial dimension of city development is a key component of land sustainability and has a strong influence on other environmental aspects. As such, land consumption, and the form of land take can be seen as an important driver for at least some of the other vectors.
European cities have been growing in the last 50 years at different pace with marked regional differences. For example Eastern countries inherited a more compact structure from the central planning system and until mid 90’s they did not start a process of clear expansion of lower dense urban areas. However, some general trends can be identified: increased homogenisation of the landscape, most of the new development is on previous agricultural land, and more and more urban development is decoupled from demography extending to the outskirts of the core city. Some measures have already been taken to limit urban development and sprawl in some countries (e.g. Germany) although it is expected that this trend will continue at lower pace. See the tables in chapter 3.2 of the scientific report for more details.
Future perspectives
The main drivers for the observed environmental trends in European cities are:
1. Positive: Good land use planning, implementation of policies related to health and air quality, environment consciousness
2. Negative: Land prices in a free market can’t be controlled and can determine to a great extent where and how cities are developed; cheap energy; poor public transport; consumption.
BOX 3 : The impact of urban structure on economic, social,
environmental performance
(see the section “Is urban form relevant for the environment” at the end of chapter 1.2 of the scientific report for literature references)
Concerns about environmental problems in cities include a more general question about the relevance of urban form and design for resource-efficiency, focussed at least in two aspects: land and energy consumption, but also social aspects.
Urban form and transport
Public transport seems to be strongly influenced, both in terms of efficiency and competitiveness, by the structural organisation of an urban area: the more dispersed and less structured the development, the lower its level of efficiency and competitiveness and, consequently, its share of the mobility market. The variables most used in the literature to describe these linkages are population density, house density, street density and mix of uses (economic-residential). Higher rates of walking and cycling are directly linked to street density, land use mix, commercial density and commercial diversity.
Use and travel time of private transport shows a greater variety of factors depending on the case analysed. However, the age of the building stock is very often identified, with the presence of recent housing development as an important factor indicating the emergence of new models of lifestyle and mobility which are very different from those of the past. Promotion of relatively compact urban structures can have positive effects on walking, cycling and the use of public transport.
Urban form and health
Housing quality and design and location of neighbourhoods have been found to have a positive impact on health, understood as a state of complete physical, mental and social well-being. In particular, the factors more relevant are as follow:
• Aesthetics, which are related to cultural factors. Very often it has been simplified considering that the dominant preference is for single detached homes. However, the aesthetical values included in the surveys provide a broader perspective like the valorisation of historical centre.
• Pedestrian friendly streets. This factor does not necessarily relate to a particular form of city, but as mentioned, compactness seems to favour walking.
• Land use mix: easy accessibility to services, shops and public amenities. The link with health has been explained by some of the following factors: engagement in local life (sense of community and well-being), higher rate of walking and cycling.
Finally, choices of people are to a great extend determined by cultural values. There are favourable conditions that will promote the more compact and efficient cities like mixed uses, quality of the space, proximity of public services and amenities. Other factors like proximity to public transport, somewhat related to density, is a precondition to reduce private transport.
Inter-urban cooperation
(see chapter 10.1-10.3 for more details and literature references)
The notion of polycentric cooperation is a prominent concept in European territorial development documents, notably since the ESDP in 1999. As many European policy concepts, however, polycentricity is such a vague and broad concept that it encompasses many different possible meanings and operationalisations, especially when approaching it at different scales. ESPON has attempted to respond to this challenge through several projects (notably ESPON 2006 1.1.1 and 1.4.3). However, many of these attempts have been limited to measuring polycentricity based on morphological or rank-size-related criteria, without being able to go into functional analyses of the actual level of linkages and cooperations between nodes of polycentric cooperation.
At the trans-European scale, such an approach might work, when polycentricity is seen as the simple balancing out of large territorial inequalities. However, when going down to the regional scale, this becomes more problematic. The policy goal of exploiting “regional polycentric potentials” aims at improving networking and complementarities between cities at the inter-regional and intra-regional levels. Generally, however, at this scale data is not available. Where an empirical (quantitative) approach exists, evidence on global cities and, even more, on lower level urban networking, remains very often based on attributes because the relevant data are abundant while data on direct links, or even flows, which could more clearly inform on the relationships among the cities as nodes of networks are poor. In this respect, recent research has attributed growing importance to the use of the internal structure of firms as a proxy to measure actual flows of information among cities. The analysis of the territorial effects of real flows through transport means (air-lines, TGV and motorways) also becomes important. However, research on all the latter has been mainly conducted on regional and national case studies, not covering the entire ESPON space.
In this context, case studies are generally the only available option. Most of the time, however, such case studies are based on interviews with stakeholders involved in the cooperation networks and very rarely provide any “objective” evidence concerning the functioning and the impact of the policy-driven cooperations. It is, thus, currently very difficult to evaluate the actual impacts of cooperation between cities in an objective and empirical manner.
Cities as objects of policies: a
review of policy visions and
policies on cities in Europe
The above literature review gives an idea of some of the main issues concerning urban development in general. However, it does not include much reference to the actual policies implemented across Europe. Based on reports elaborated in 2010 by national ministries for the Council of Europe Conference of Ministers Responsible for Spatial/Regional Planning (CEMAT) we, therefore, summarise here the vision that national policy makers have of their respective urban issues and policies. Many of them reflect the issues raised in the previous chapter. For a detailed synthesis of these reports, including a more territorially differentiated analysis, see chapter 12 of the scientific report.
Changes in settlement systems at macro-territorial scale and
related policies
Recent trends
Generally, all countries see a trend of growth in metropolitan areas, accompanied by an enlargement of their catchment areas. Some types of medium-sized cities, mostly in economically successful regions, or those that act as relays towards larger centres also show population growth. Smaller centres, however, suffer from population decline, especially those that are far away from larger metropolitan areas. Recent changes in the macro-territorial aspects of settlement systems in Central and Eastern Europe have not been significantly different in nature from Western Europe, but their intensity has generally been stronger.
Macro-territorial policies related to settlement systems
The main issues considered by policies and strategies related to settlement systems are territorial balance at national scale and polycentricity, while maintaining competitive and sustainable development, thus reflecting the general European leitmotive. The policies adopted range from very general national strategies to the designation of specific priority zones aimed at balancing the territorial development of the country. Examples of the latter include the Northern Way strategy and South-East growth areas of the former UK government (now replaced by a decrentralisation strategy) or the regional growth poles in Romania. In some countries (such as France and Norway, for example) the settlement system is addressed through thematic policies.
Many of these strategies are fairly recent, so the evaluation of their success will only be possible in a mid- to long-term future. Those strategies that exist for a certain number of years, however, often do not
show the expected results (example the “Atlantic corridor” in Ireland or the “Spatial Development Strategy” of Slovenia) often due to countering effects of market forces and limitations in the implementation capacities.
Perspectives for the macro-territorial development of urban settlements
Although the identification of common perspectives for settlement systems in their micro-territorial dimension is not easy, the following can be mentioned:
• The economic/financial crisis has accentuated the divide between urban settlements with a growing knowledge economy and others facing difficulties in modernising their production systems.
• The number of European cities with shrinking population will significantly increase during the coming decades.
• Settlements located in regions with a prosperous residential/tourist economy are likely to be more and more favoured, especially if they are capable to attract retirees and a growing number of people belonging to a higher income groups.
Changes in metropolitan regions and related policies
Suburbanisation and densification
The past 10 to 15 years have been characterised by significant trends of suburbanisation around large and medium-sized cities as well as of densification in particularly attractive areas (not necessarily urban, yet). These trends have developed at Europe-wide scale. Main differences between countries and regions are related to the intensity of the process, which itself depends, among others, upon the stage of cities in the urbanisation cycle, upon the economic situation in the respective regions and upon the type of territorial governance applied, notably the level of implementation of strict land use regulations.
Containing urban sprawl and ensuring coherent and sustainable development
Policies in the field of urban sprawl include densification of already built-up areas, the focus on concentrated growth areas in the surrounding of large cities (Italy, England), explicit linkage of development to transport and other infrastructure provisions (France, Norway) and horizontal
form of increased (network-based) agglomeration economies can be reached through such cooperation.
Perspectives for the territorial evolution of metropolitan regions and
related policies
A number of factors are now converging to slow down the process of de-urbanisation/suburbanisation: progressive population ageing and decline in a growing number of countries, the impact of the economic/financial crisis on the purchase power of citizens and on real estate speculation (Spain, Portugal, Ireland, UK, various central and east European countries) and the fact that the “catching up process” in Central and Eastern Europe in terms of de-urbanisation and suburbanisation is rather advanced and might slow down in the future.
Against this background, the tasks of public policies in the coming decades will most probably concentrate, on the one hand, on the reshaping and restructuring of suburbs and suburban areas, which have developed chaotically. The aim will be to create new centrality nodes in areas of urban sprawl, to mobilise and enhance their potentials and to improve the quality of life in terms of sustainability. In urban regions with shrinking population, the restructuring of suburbs and of urban sprawl areas will be confronted with additional difficulties, with regard to the real estate market and the shaping of new centrality nodes.
Intra-urban issues and related policies
De-urbanisation and urban devitalisation processes
In the context of the de-urbanisation phase of the urbanisation cycle, numerous European cities and metropolitan areas have been and still are confronted with the devitalisation/depopulation process of their core areas, and sometimes of the entire city. This process has started earlier in north-west Europe, so that since then re-urbanisation processes have been at work there. Similar trajectories are starting in cities of other parts of Europe. Today, much of the decline of core cities in Western Europe is happening in mid-size cities. In Eastern Europe many large cities also have declining city centres linked with strong suburbanisation.
Social polarisation in cities
Social and socio-spatial polarisation of cities is seen as an increasing issue for most European cities, linked to the accelerated development of “gated communities” and socio-spatial segregation through suburbanisation of higher-income groups.
Territorial policies addressing intra-urban regeneration and social polarisation Public policies addressing the regeneration of inner city areas and the related problems of social polarisation are progressing in numerous European countries. Such policies involve more and more the dense urban settlements of urban peripheries built in the 1960s and 1970s, subject to severe social problems and to multiple deprivation. In most European
countries such policies are place-based and often aim at some form of “integrated” development, combining policies concerning the built environment with social and economic policies. In many cities these take the form of regeneration policies, more or less explicitly aimed at changing the social composition of the concerned areas.
Perspectives for inner-city areas and related policies
In the context of growing population ageing and social polarisation, the regeneration of inner city areas is becoming an increasing task for public policies of various levels. Although public authorities largely recognise the social issues related to urban regeneration and renewal, the risk is not small that the socially most vulnerable groups will be pushed out of inner city areas towards more peripheral areas in the vicinity of cities. Private interests, for which solving social issues is not a priority, will be more and more involved in regeneration. The economic/financial crisis will have a long-lasting negative impact on urban restructuring and renewal activities, as the financial capacity of local authorities has significantly been reduced on the background of indebtedness.
New knowledge on cities:
Attempts at furthering the
empirical knowledge on
European cities
Introduction
As mentioned in the general introduction to this report, the empirical part of the project was guided by two main ideas: first of all we wanted to avoid redundancy with the many existing efforts, be they within ESPON, within the Commission (such as the Second Report on the State of European Cities), or elsewhere (e.g. the report on urban competitiveness by the OECD). Second, in light of the difficult situation in terms of data availability for cities across Europe, we wanted to tap new data sources and see how they can inform urban policies. This endeavour obviously implied that we went out into the unknown, and much still remains to be done. We, therefore, present here our empirical results both in order to assess what they tell us about policy questions, but even more so in terms of the methodological issues at hand when using these data, in the hope that future projects will profit of our experiences.
Urban extension and urban form
Introduction
As mentioned in the general overview, cities face many environmental issues, from air quality to waste management, without forgetting air quality and noise. In terms of territorial planning and development, however, the land take and the morphological form of cities is often cited as an important driver of urban environmental sustainability. We, therefore, present a typology of the spatial dynamics of cities based on Corine Land Cover data, which we then critically analyse based on Urban Atlas data. The final section then uses Urban Atlas data for a tentative analysis of the impact of urban form on different elements of urban “performance”.
Before going into the actual analysis of urban sprawl, however, it is interesting to get a general picture of the intra-urban dynamics of population development in Europe's metropolitan areas, as represented by the Urban Audit LUZ.
A typology of population development between core cities
and LUZ
(For more details about the demographic evolution of cities see chapter 2 of the scientific report.)
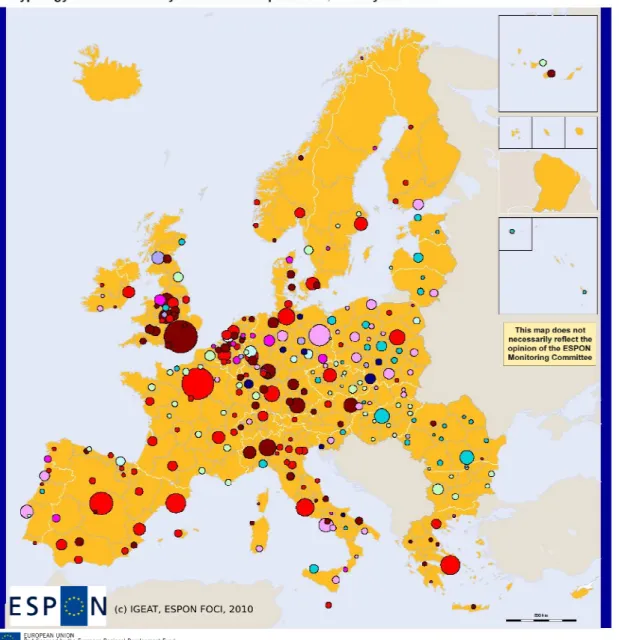
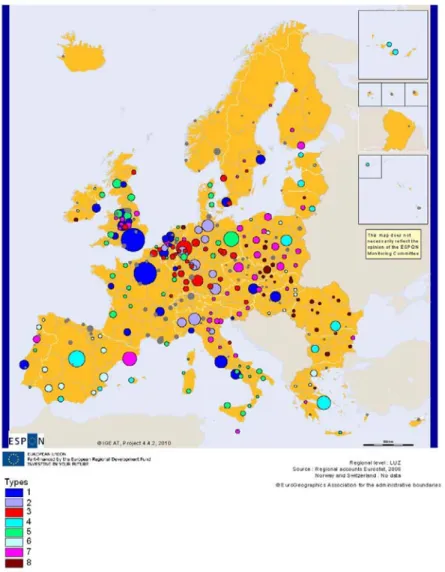
We propose a typology in which we distinguish first between growing and declining LUZ, and then we take into account the dynamics in the core cities as opposed to the rest of the LUZ. On this map, we can distinguish several major types of evolution:
• in the dense urban and central parts of Europe, many cities are characterized by their population growth in both core and peripheries, with often higher growth rates in the core cities; • in Eastern Europe, most of the cities are characterized by the
decline of their population with an intense process of suburbanization, except mainly Warsaw and Praha;
• in Mediterranean LUZ, we observe population growth with an intense process of suburbanization.
This map presents a synthetic vision of the position of cities in the urbanisation cycle, an important element to consider when targeting policies to specific types of cities.
Figure 1. Typology of intra-urban dynamics in European LUZ, in the years 2000
A typology of urban spatial development based on Corine
Land Cover
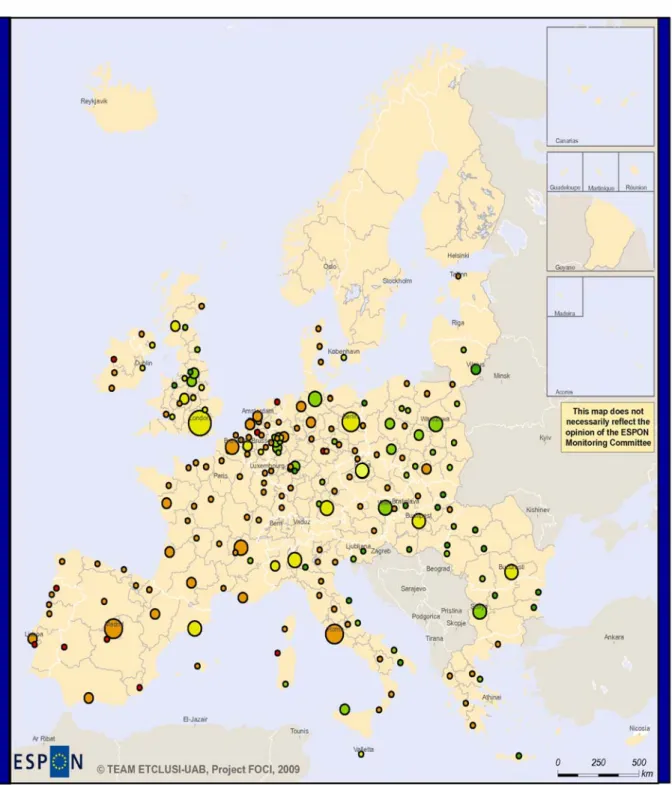
In this section we present a typology of urban spatial development, or urban sprawl based on Corine Land Cover data. Three groups of descriptors have been taken into account to analyse city development: size and form, urban development and destination of new urban areas. Relevant indicators were analysed for the period 1990-2000 for which the best geographical coverage was available at the time of the analyses and which allows for a comparison with 2000-2006 in a second step. Three main types were identified with the following distinctive features:
− Type 1. Slowly growing cities.
− a. Slowly growing cities densifying the existing urban areas. Cities below 600 000 inhabitants and low degree of sealing. Some of these cities are loosing population both in the core city and LUZ.
− b. Slowly growing cities with diffuse urban development. Those cities are also growing slowly. The rate of growth is about three times higher in the LUZ compared to the core city. The risk for those cities would be to increase the pace of urban development that would lead to more sprawled system.
− Type 2. Rapidly growing cities. This group represents almost half of the European cities. Because of their variety they do not have any particularity regarding size and form. This group is defined by an intermediate rate of growth and low level of recycling. New developments in the core city are mainly residential areas, whereas in the LUZ the new developments are for industrial and commercial activities. However, there is a small group of cities (2b) that have a relatively large LUZ.
− Type 3. Very rapidly growing cities with diffuse urban development. This group includes the cities with the highest degree of urban development, far beyond the average of the other types.
Considering these types as a baseline, their evolution in the period 2000-2006 tends to homogenise and reduce the distance between different development paces. Generally speaking, stable cities or the ones with slow development in the 90s have experienced a relatively rapid increase while
Figure 2. Typologies of urban development (1990-2000)
How reliable is Corine Land Cover for analysing urban
sprawl ?
There are some important methodological constraints linked to the use of Corine Land Cover, namely the minimum mapping unit and the minimum change detection. In addition, the methodology used for CORINE is known to underestimate linear features like roads and rails. In this context, the development of the Urban Atlas is a great improvement, since the Urban Audit cities will be mapped at higher resolution. However, this is an ongoing project and for the moment data is only available for 2006, and only for 200 cities in July 2010. We, therefore, proceeded to an evaluation of the Corine Land Cover results on the basis of the available Urban Atlas data. For more details on methodologies and results see the section ”What is the accuracy of CLC ?” in chapter 1.4 of the scientific report.
The main conclusions of this analysis are the following:
• CLC provides systematic underestimation of commercial and industrial areas, compared with higher resolution Urban Atlas, resulting in deviations up to 30% of the actual value.
• Deviations are less accentuated for the rest of artificial classes. • There may be important errors on the stocks (percent of different
land cover areas).
• The implications for changes are not known since Urban Atlas only has one time shot.
• The conclusion that urban sprawl is more driven by commercial and industrial areas compared to residential ones should be questioned given the discrepancies found between CLC and Urban Atlas.
These results confirm that new approaches are needed. Necessary technologies and data are now there and efforts are currently being made to increase the level of available information.
The impact of urban form on urban “performance”
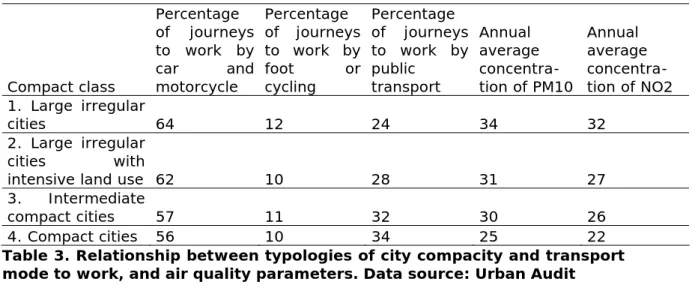
To further understand what the implications of city form are, a compacity index has been analysed for the subset of cities available in the Urban Atlas (see the section “Is city form relevant for the environment” in chapter 1.4 of the scientific report for details). This index shows how far a city is from a circular form with the same area and ranges from 0 (more irregular and less compact city) to 1.
Compact class Percentage of journeys to work by car and motorcycle Percentage of journeys to work by foot or cycling Percentage of journeys to work by public transport Annual average concentra-tion of PM10 Annual average concentra-tion of NO2 1. Large irregular cities 64 12 24 34 32 2. Large irregular cities with
intensive land use 62 10 28 31 27
3. Intermediate
compact cities 57 11 32 30 26
4. Compact cities 56 10 34 25 22
Table 3. Relationship between typologies of city compacity and transport mode to work, and air quality parameters. Data source: Urban Audit
Social cohesion
Chapters 3.2 and 3.3 of the scientific report provide a series of indicators of social cohesion in European cities based on the (somewhat limited) available data.
Introduction
An important question for urban (and regional) policies in Europe is whether social cohesion still depends on economic wealth in European cities and thus whether we can expect competitiveness policies to improve social cohesion, notably through trickle down effects. This is what we propose to explore here. From the literature, we can raise the hypothesis that within new forms of growth in the globalized and knowledge-based economy, social cohesion is more and more decoupled from economic performances. However our data do not allow a definitive and unambiguous answer to this question. On the one hand, social cohesion data are very incomplete in Europe. On the other hand, as we will see in our analyses, the answer depends on the social indicator we look for. Despite the poverty of the data, this analysis provides a unique assessment of this question in European cities.
The relation between economic wealth and social cohesion
Economic wealth and unemployment
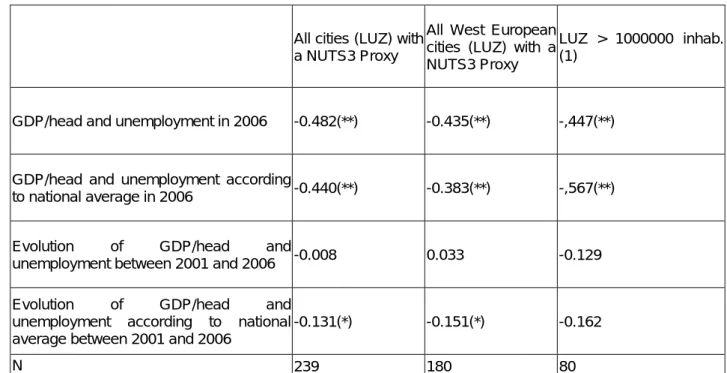
According to table 4, there is a significant but low correlation between GDP/head and unemployment rate in the years 2000: the higher the GDP/head, the lower the unemployment rate. Results are very similar when Eastern and Western Europe are divided, which means that these correlations are not related to the East/West gap inside Europe.
We would expect a stronger relationship in dynamic terms (growth rates), especially because, in a given territory, there are strong evidences that economic growth allows reducing unemployment rates. However, this is not the case. Several explanations can be proposed:
All cities (LUZ) with a NUTS3 Proxy
All West European cities (LUZ) with a NUTS3 Proxy
LUZ > 1000000 inhab. (1)
GDP/head and unemployment in 2006 -0.482(**) -0.435(**) -,447(**)
GDP/head and unemployment according
to national average in 2006 -0.440(**) -0.383(**) -,567(**)
Evolution of GDP/head and
unemployment between 2001 and 2006 -0.008 0.033 -0.129
Evolution of GDP/head and unemployment according to national average between 2001 and 2006
-0.131(*) -0.151(*) -0.162
N 239 180 80
Significant ** at 0.01; * at 0.05
Table 4. Correlation (R Pearson) between economic wealth and unemployment rates, in the years 2000, in static and dynamic terms
(1) the analysis has been made on 80 cities of more than 1000000 inhab. allowing a NUTS3 proxy of the LUZ.
Economic wealth and other social cohesion indicators
In addition to the simple analysis of unemployment, we propose here to assess the relationship between economic development and diverse social cohesion indicators across European cities (table 5).
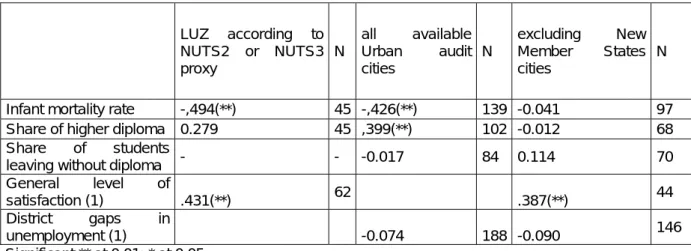
Infant mortality rate, an indicator reflecting fairly well the general level of health in a society, is correlated with GDP/head. However, beyond a certain level of GDP/head, this correlation disappears. Indeed, when Eastern countries are excluded, the observed correlation becomes statistically non significant, meaning that the correlation between GDP/head and infant mortality rate is only due to the gap between Eastern and Western Europe in both GDP/head and infant mortality rate. When we turn to education indicators, we reach similar conclusions: correlation is weak and inexistent if we focus only on West European cities.
The Urban Audit perception survey allows assessing the level of satisfaction of people for a number of big cities across Europe. Interestingly, we do find here significant correlations between GDP per head and a synthetic index of satisfaction which does not disappear when excluding East European cities. However, when looking more closely at the data, we find that this correlation is actually mainly due to the general
dissatisfaction in most of the Mediterranean cities included in the perception survey. LUZ according to NUTS2 or NUTS3 proxy N all available Urban audit cities N excluding New Member States cities N
Infant mortality rate -,494(**) 45 -,426(**) 139 -0.041 97
Share of higher diploma 0.279 45 ,399(**) 102 -0.012 68
Share of students
leaving without diploma - - -0.017 84 0.114 70
General level of
satisfaction (1) .431(**) 62 .387(**) 44
District gaps in
unemployment (1) -0.074 188 -0.090 146
Significant ** at 0.01; * at 0.05
Table 5. Correlation (R Pearson) between economic wealth (GDP/head) and some social indicators, in the years 2000
(1) Data come from perception survey or the district statistics of the Urban Audit and only concern core cities while GDP level is defined at the LUZ level
Source: Eurostat, urban audit; Eurostat, Perception Survey; Eurostat, Regional Statistics. While Urban Audit data allow considering more cities, they are biased because only some countries are available for the indicators while NUTS2 proxy data allow a complete picture for cities allowing such proxy (that is 45 LUZ).
Socio-spatial polarisation
One of the aspects of social cohesion in the city is related to the gaps between neighbourhoods. We raise the hypothesis that the concentration of social difficulties in some specific areas of the cities may reinforce the social problems of the resident population. This is why it seems necessary to assess socio-spatial inequalities in the cities. However, it is important to insist on the fact that low neighbourhood inequalities do not necessarily mean a better social cohesion. The spatial configurations of the social problems are only one aspect of social inequalities.
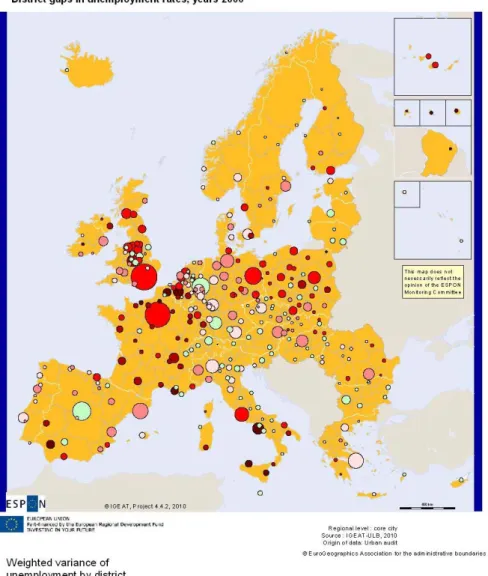
The availability of data obliges us to focus on unemployment rate to measure district inequalities. Figure 3 shows the weighted variance of unemployment rates by district. It shows huge differences in the socio-spatial inequalities in the cities: the highest levels are reached in UK, France, Belgium and some cities of southern Europe while we find low
Figure 3. District inequalities in European cities
Note: For each city, unemployment rates of each district have been compared to the average. These differences are weighted by the total active population and summed. As a result, it gives a synthetic index of the intensity of the differences between districts in the core city.
Conclusions
From these analyses, it can be said that social cohesion indicators are poorly related to competitiveness indicators. This result has political consequences since it means that at the level of development reached in the EU (at least the EU-15), social cohesion indicators related to health and education poorly depend on economic development but rather on other factors, notably the quality of the health or education systems, urban housing policies or redistribution policies at national level. Only the development gap between East and West European has a strong impact on health and education differences.
Economic development
Introduction
As mentioned in the literature review, many studies about regional economic development exist in Europe, and as most data available for cities are in fact approximations at NUTS 3 or even NUTS 2 level, it does not seem particularly interesting to provide yet another study of all the factors of competitiveness at these scales. For analyses of the basic factors of competitiveness see chapters 4.3 and 4.4 of the scientific report. Here, we limit the presentation to a typology of the sectoral structure of Europe's cities as this sectoral structure can be seen both as a factor of competitiveness, but also as a proxy for the historical paths these cities have taken. In the rest of this section we show the results of some new approaches to urban economies, mostly based on innovative data. We begin by analysing their insertion into global and European networks, be it research or global firm networks, based on CORDIS and ORBIS data. We then analyse their respective contactability for one-day business trips based on a collection of time table data. Third, we attempt to understand the link between urban economic performance and the respective national context.
A typology of the sectoral structure of European cities
We propose a typology with 8 groups of European cities approximated at NUTS 3 level) according to their sectoral structure in 2006 (Figure 4). The main added value of this typology compared to existing ones covering all NUTS 3 regions is to allow an easier reading of the specific situation of cities and to focus on the differentiation between cities, by ignoring rural regions. Types 1 and 2 group together big metropolises with high share of high level functions (finance and business services). The latter has generally lower share of high functions and keeps a solid manufacturing base: it mainly concerns big German and North Italian cities. In type 1, some cities like Lisboa, Napoli, Budapest or some medium French and English cities actually have lower levels of high function but are included because of other similarities with the biggest commanding cities. Type 3 distinguishes from the previous one by lower shares of high function but even higher share of manufacturing than type 2: it includes many West German cities. Type 4 includes more peripheral capital cities with high share of basic market services (Athens, Sofia, Bucharest, Madrid, Warsaw, and Baltic capitals). In this group however, Madrid has a much higher share of high functions than the other cities. Type 5 includes cities
and in cities, although other studies have clearly shown that sectoral structure alone (especially when based on only 6 sectors) is not a conclusive factor of competitiveness.
Figure 4. A typology of European cities in terms of sectoral structure 2006 (6 sectors, NUTS 3 approximations of cities)
Economic structure: share of (%)
Share (%) of each type in total European added value agriculture manufacturing industry and energy
construction Trade and transport Finance and business services Other services Type 1 36.2 0.4 11.4 5.0 22.1 37.7 23.3 Type 2 13.5 0.4 20.9 3.2 21.8 35.8 17.9 Type 3 12.3 0.8 25.5 4.7 18.3 27.4 23.4 Type 4 7.2 0.9 11.9 9.1 32.3 24.6 21.1 Type 5 12.3 2.0 14.7 6.3 19.8 27.2 30.0 Type 6 4.4 4.5 19.2 11.6 22.7 19.1 22.9 Type 7 11.9 1.4 23.3 6.8 25.0 23.6 19.9 Type 8 2.3 4.0 37.1 7.0 20.8 14.9 16.1
The hierarchy of cities according to their participation in
global and European networks
(For more details about the methodology, the ranking of individual cities and a first typology of specialisation, see chapter 8 of the scientific report.)
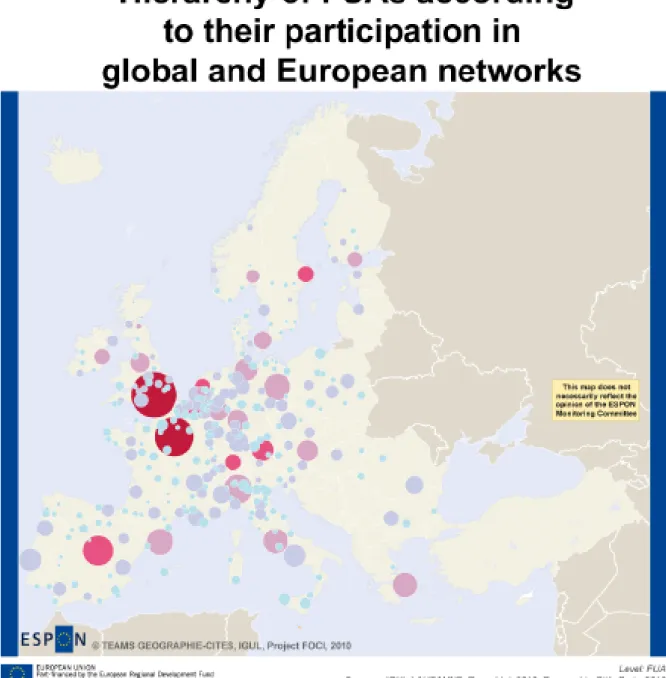
One possible way to assess the “competitiveness” of cities is to analyse their relative position in the global networks that convey the exchanges of information and investment in leading economic activities as revealing their potential for a future development. In a quantitative way, the total number of connections in a variety of networks is a first indicator of a city’s general integration in global and European networks. We constructed a ranking of European cities based on their indices of centrality in several networks both within European research networks (CORDIS) and in global firm ownership hierarchies (ORBIS). Figure 5 presents this ranking in five classes that exhibit a visible hierarchical pattern. The global cities Paris and London have the highest ranks, far ahead from six other European cities well integrated in global networks of leading activities: Madrid, Stockholm, Amsterdam, Zurich, Helsinki, Dublin; 16 other cities ranking from 9th to 24th rank still have noticeable international participation. Most of cities, 200 out of 271, have only a modest participation in these research and economic networks.
Figure 5. Hierarchy of cities according to their participation in global and European networks