Publisher’s version / Version de l'éditeur:
Macromolecules, 41, July 16, pp. 6176-6182, 2008
READ THESE TERMS AND CONDITIONS CAREFULLY BEFORE USING THIS WEBSITE. https://nrc-publications.canada.ca/eng/copyright
Vous avez des questions? Nous pouvons vous aider. Pour communiquer directement avec un auteur, consultez la
première page de la revue dans laquelle son article a été publié afin de trouver ses coordonnées. Si vous n’arrivez pas à les repérer, communiquez avec nous à PublicationsArchive-ArchivesPublications@nrc-cnrc.gc.ca.
Questions? Contact the NRC Publications Archive team at
PublicationsArchive-ArchivesPublications@nrc-cnrc.gc.ca. If you wish to email the authors directly, please see the first page of the publication for their contact information.
NRC Publications Archive
Archives des publications du CNRC
This publication could be one of several versions: author’s original, accepted manuscript or the publisher’s version. / La version de cette publication peut être l’une des suivantes : la version prépublication de l’auteur, la version acceptée du manuscrit ou la version de l’éditeur.
For the publisher’s version, please access the DOI link below./ Pour consulter la version de l’éditeur, utilisez le lien DOI ci-dessous.
https://doi.org/10.1021/ma800470j
Access and use of this website and the material on it are subject to the Terms and Conditions set forth at
Morphology of comb-shaped proton exchange membrane copolymers
based on a neutron scattering study
Nieh, Mu-Ping; Guiver, Michael; Kim, Dae Sik; Ding, Jianfu; Norsten, Tyler
https://publications-cnrc.canada.ca/fra/droits
L’accès à ce site Web et l’utilisation de son contenu sont assujettis aux conditions présentées dans le site
LISEZ CES CONDITIONS ATTENTIVEMENT AVANT D’UTILISER CE SITE WEB.
NRC Publications Record / Notice d'Archives des publications de CNRC:
https://nrc-publications.canada.ca/eng/view/object/?id=ed488f21-4c1f-489e-a509-0c5775d51405 https://publications-cnrc.canada.ca/fra/voir/objet/?id=ed488f21-4c1f-489e-a509-0c5775d51405Morphology of Comb-Shaped Proton Exchange Membrane
Copolymers Based on a Neutron Scattering Study
Mu-Ping Nieh,*,†Michael D. Guiver,‡Dae Sik Kim,‡Jianfu Ding,‡and Tyler Norsten‡,§
Canadian Neutron Beam Centre, Steacie Institute for Molecular Sciences, National Research Council of Canada, Chalk RiVer Laboratory, Chalk RiVer, Ontario K0J 1J0, Canada, and Institute for Chemical Process and EnVironmental Technology, National Research Council of Canada, Ottawa,
Ontario K1A 0R6, Canada
ReceiVed March 3, 2008; ReVised Manuscript ReceiVed June 3, 2008
ABSTRACT: Highly fluorinated comb-shaped ionomer membranes made by solution casting have shown high proton conductivity coupled with low dimensional swelling upon hydration, which demonstrates their potential as materials for proton exchange membranes (PEM) for fuel cells (FC). Small-angle neutron scattering (SANS) and neutron diffraction studies on the copolymers have been conducted to resolve the morphological structures. Two peaks were found in the SANS curves: the low-q peak is assigned to the strong interaction among the self-aggregating hydrophilic and hydrophobic domains, whereas the high-q peak is attributed to the “ionomer peak”. We propose a new structural model to fit the SANS data in the q range covering 0.005-0.4 Å-1. This model combines a form factor of flexible wormlike aggregates with an ellipsoidal cross section and a structure factor of hard-disk interaction accounting for the low-q scattering as well as the Teubner-Strey model for the high-q “ionomer peak”. Water uptakes can be derived from the best-fitting results of the current model and are consistent with the measured values. The neutron diffraction data indicate that there is little long-range orientation, if any, of the hydrophilic or hydrophobic domains.
Introduction
The development of polymers for proton exchange membrane fuel cells (PEMFC) plays an important role in both reducing cost and improving performance. Ideal proton exchange mem-brane (PEM) materials should possess properties such as high proton conductivity, high chemical stability over the required temperature range, good mechanical properties, and dimensional stability in the hydrated state. Block copolymers forming hydrophobic and interconnected hydrophilic (ionic) domains have many of the aforementioned properties. The hydrophobic matrix provides the mechanical strength and constrains the swelling of the materials, while the hydrophilic (ionic) domains determine/impart the proton conductivity. In order to better design polymer architectures and improve performance of PEMFC materials, it is essential to resolve their morphologies. Small-angle neutron scattering (SANS), X-ray scattering (SAXS), and wide-angle X-ray diffraction (WAXD) have been powerful tools for structural characterization at the length scale of 1000 Å and below. In the past, Nafion, a benchmark PEM material utilized in PEMFCs, has been intensively studied using SANS and SAXS.1–10The general scattering pattern of Nafion includes a broad peak at the scattering vector, q [) (4π/λ) sin(θ/2), where λ and θ are the wavelength of the neutrons (or X-ray) and the scattering angles, respectively] around 0.1-0.2 Å-1(also known as the “ionomer peak”) corresponding to a length scale of 30-60 Å and a low-angle intensity upturn before the peak. Several models have been applied to interpret the small-angle data; however, the morphology of Nafion remains inconclusive. The most common ones include the cluster network model proposed by Gierke et al.,1 the core-shell model by Fujimura et al.,2,3 the local order model by Dreyfus et al.,4the lamellar model by Litt,5the tortuous sandwich model by Haubold et al.,6and the tubelike interconnected tunnel model by Kim et al.7A review
for many proposed morphologies of Nafion can be found in ref 8. All these models are obtained based on either the swelling behavior upon dilution, the characteristics of the scattering curves, or fitting scattering data over a limited range of scattering vector because it requires a thorough understanding of the system over a wide range of length scale in order to incorporate appropriate terms accounting for the origins of the scattering intensity. The task becomes more difficult when Nafion is at a high concentration, where the structure factor (interdomain interaction) may also play a role. Recently, a few SANS and SAXS studies have shown that low-concentration Nafion solutions form elongated aggregates with a length of the order of 1000 Å.7,9
Designing new PEMs to enhance their proton conductivity, chemical/thermal stability, and mechanical property and to reduce the swelling is an ongoing effort. Various synthetic strategies to control PEM microstructure employing alternative polymer materials have been reviewed.11–13Recently, we have developed a comb-shaped copolymer based on a highly fluori-nated and rigid polyaromatic backbone containing monodisperse R-methylpoly(styrenesulfonic acid) side chains (Figure 1). A preliminary characterization of a series of these copolymers having different ion exchange capacities (IEC), water uptake, swelling behavior, and proton conductivity was recently re-ported.14In an optimal IEC range, the comb-shaped copolymer PEMs exhibit very low hydration-based dimensional changes at elevated operating temperatures with similar proton conduc-tivity and water uptake values when compared to Nafion. This
* To whom correspondence should be addressed.
†Canadian Neutron Beam Centre.
‡Institute for Chemical Process and Environmental Technology. §Present address: Xerox Research Center of Canada, 2660 Speakman
Drive, Mississauga, ON L5K 2L1, Canada. Figure 1.Molecular structure of comb-shaped copolymer. 10.1021/ma800470j CCC: $40.75 Published 2008 by the American Chemical Society
was a result of the high glass transition temperature (Tg) and the microphase-separated polymer microstructure. On the basis of the observation of a weak second-order Bragg peak in the SAXS data, a lamellar morphology was suggested as a possible microstructure in the comb-shaped PEMs.14In this paper, we propose another model which consists of highly interacted wormlike ellipsoidal cylinders (at large length scales) combined with Teubner-Strey microemulsions (at small length scales) and compare it with the lamellar model based on the SANS and transmission electron microscopic (TEM) results. This model differs from other proposed models regarding the interpretation of the “ionomer peaks” and is able to fit the SANS data over almost 2 decades of q values (0.005-0.4 Å-1). The approach is presumably valid for not only this specific material but also other PEMs such as Nafion.
Materials and Methods
Comb-Shaped Fluorinated Copolymers. Detailed synthetic procedures and characterization of the copolymers (Figure 1) were reported previously.14The present study includes two comb-shaped
copolymers having different side-chain contents and hence IECs. The two samples 19 (19 wt % side-chain content) and PEM-32 (PEM-32 wt % side-chain content) represent the extremes of a low and high IEC PEM material, having proton conductivities lower (19 wt %) and higher (32 wt %) than Nafion, respectively. It is relevant to conduct the SANS study of these two samples, since it would determine whether the morphological model applies over the IEC range that is useful for a PEM material in a FC. Sample PEM-22 (Table 1) has an IEC that provides the combination of properties for proton conductivity and water uptake that most closely match Nafion. The properties of both materials are shown for comparative purposes since it would be the most suitable PEM material for applying to FC. The basic PEM properties of the three PEM materials and those of Nafion were remeasured for the present study and are listed in Table 1. The fluorine content and the crystallinity of the comb polymers are lower than Nafion, thus yielding a lower density of the dry films. The design of the comb polymers creates a higher tendency for phase separation; conse-quently, hydrophilic domains with high ion concentration can be expected to form in the hydrophobic matrix. Once the intercon-nected ionic channels are formed, these types of morphological structures are capable of providing materials with high proton conductivity, high mechanical strength, and good dimensional stability upon swelling.
Membranes were prepared from copolymer solutions in N,N-dimethylacetamide (DMAc) and drying the cast films at 50°C under a constant purge of argon for 2-4 days, yielding final film thickness typically in the range of 50-75 µm. For the neutron scattering measurements, the dry films were then trimmed and placed in quartz cells (35 mm × 42 mm × 0.5 mm), which were later filled with D2O and sealed. After equilibrium, the PEMs swelled to 100–130 µm in thickness.
Transmission Electron Microscopy (TEM).TEM results were conducted on PEM-19 and PEM-36. Films of the sulfonic acid form were immersed in 0.5 M lead acetate solution for 48 h and rinsed with water. A 1 mm × 5 mm strip of the dried film was then embedded in bimodal polystyrene (Aldrich). Thin slices (40-50
nm) of the embedded polymer samples were cut using an ultrami-crotome (Ultracut-E, Reichert-Jung) fitted with a Diatome diamond knife and were transferred onto 400 mesh carbon-coated copper grids for TEM analysis. The samples were analyzed using a Philips CM20 STEM equipped with a Gatan UltraScan 1000 charge-coupled device (CCD) camera and INCA Energy TEM 200 EDX spectrometer operating at 120 kV.
Neutron Scattering.SANS experiments were conducted on the 30 m NG7 SANS instrument located at the National Institute of Standards and Technology (NIST) Center for Neutron Research (NCNR, Gaithersburg, MD). The scattering data were collected at three different sample-to-detector distances (SDDs): 15.3, 4, and 1 m, where neutrons of a wavelength 8 Å were employed for the long SDD and 6 Å neutrons were employed for the other two SDDs. With these configurations, the SANS data cover a q range from 0.003 to 0.4 Å-1. The raw 2-D data were corrected for detector sensitivity, background, empty cell scattering, and sample transmis-sion. The corrected data were then circularly averaged, around the beam center, yielding the customary 1-D data. These data were then put on an absolute intensity scale using the known incident beam flux. The incoherent plateau was determined by averaging the intensity of the last several high q data points and was then subtracted from the reduced data.
A neutron diffraction experiment was also performed on N5 spectrometer located at the Canadian Neutron Beam Centre (CNBC, Chalk River Laboratory, Chalk River, Ontario, Canada) to inves-tigate the orientation of the structure. The wavelength of neutrons was selected to be 2.37 ( 0.06 Å by a pyrolytic graphite crystal, and both incident and scattered neutrons were narrowly collimated with a two-slit geometry of 2 mm in width and 66 cm in length. The angle of the detector was fixed at the position of the first-order Bragg peak, and the sample angle, Ψ, was scanned through (40°, where 0° is set as the membrane sample surface that is parallel with the incident beam. This is known as a “rocking curve” in the case of studying the orientation of aligned samples. The intensity then was normalized by the illuminated volume of the sample and the number of neutrons on the sample at different Ψ. The exercise is mainly to examine whether there is preferred orientation of the morphology in the sample.
Results
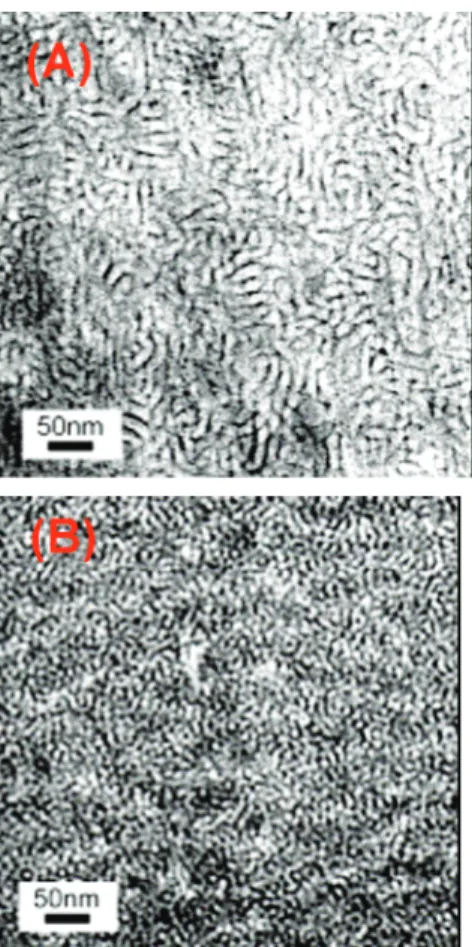
SANS Data and Models.The SANS results of D2O-soaked PEM-19 and PEM-32 as shown in Figure 2 illustrate a similar scattering pattern, presumably resulting from the same morphol-ogy. The general feature of both curves is a gradual decay of the intensity over the whole q range with a strong and broad peak at q ) 0.03-0.04 Å-1and a shoulder at q ) 0.06-0.08 Å-1 (seemingly the second-order Bragg peak), followed by another broad peak at higher q (between 0.2 and 0.25 Å-1). Comparing these two curves, the low-q peak shifts outward (corresponding to a smaller length) and the high-q peak shifts inward with an increased intensity (corresponding to a larger length) when the sample contains more sulfonic acid groups (i.e., PEM-32). Figure 3 shows TEM images of two lead-stained comb-shaped copolymers, PEM-19 and PEM-38, the latter sample being a previously reported high IEC comb-shaped polymer with 38 wt % side-chain content.14The TEM images
Table 1.Comparative PEM Data for the Samples
proton conductivityc(mS/cm) water uptakedat 30°C water uptakedat 80°C
sample densitya(g/cm3) IECb(mequiv/g) 30°C 80°C wt % vol % wt % vol %
PEM-19 1.498 0.87 43 57 19 29 26 39
PEM-22 1.387 1.20 50 66 21.5 30 29.6 41
PEM-32 1.288 1.60 59 70 32 41 47 60
Nafion 117 1.66 0.92 54 67 17.5 29.1 24.6 40.8
aMeasured from known membrane dimensions and their weight after drying at 75°C for 2 h (error range (3%).bDetermined experimentally by
titration.cMeasured after treating the membranes in boiling 0.5 M H
2SO4for 2 h, followed by thorough washing in deionized water. Proton conductivity
was determined using the two-probe method and a Solartron 1260 gain phase analyzer.13 dMeasured after drying the membrane in acid form at 100°C under
vacuum overnight and then immersing in water at the set temperature and weighing until a constant water uptake weight was obtained (error range (5%).
show that the segregation of hydrophobic and hydrophilic domains loosely formed periodic structures and that the spacing between ionic domains (the dark regions) decreases upon increasing sulfonic acid groups due to the shrinkage of hydrophobic regions. The previously published SAXS data revealed a low-q peak corresponding to a spacing of 15-20 nm, which was interpreted as lamellar phase and also seemingly consistent with the TEM images.14 Low-q peaks were also observed in other PEM materials and Nafion in the past and
interpreted as a crystalline peak.7,8,15–17The “rocking” curves at this low-q peak of both copolymer films were practically flat with no more than a 20% higher intensity at -2°<Ψ < 2° than the rest (Figure 4), indicating only slightly preferred orientation, if any, along the surface of the samples for this crystalline phase. In the case of SANS, both measurements were taken at Ψ ) 90°(the beam perpendicular to the film) where the rocking curve is practically flat; thus, the orientational preference is negligible.
It is well-known through many SANS and SAXS studies on Nafion that the “ionomer peak” is located around 0.1-0.25 Å-1. Although the origin of the “ionomer peak” remains debatable, it is found to shift toward lower q and had an increased intensity at higher hydration levels.1–7 The same trend of shift and intensity and the similar vicinity of the high-q peak observed in our SANS measurement further confirms that it is the “ionomer peak”.
In the past the scattering feature of the “ionomer peak” and the intensity upturn prior to it was considered to result from the same structure in most of the proposed models while fitting the scattering data.3,4Here, we propose a different approach to fit the SANS data by focusing on low-q and high-q regimes individually. The scattering intensity in the low-q regime is mainly attributed to the crystalline phase composed of large hydrophobic and hydrophilic domains, whereas the high-q scattering mainly comes from the local distribution of the ionomers/water (D2O) in the hydrophilic domain. The rationale is that the short-range (small length scale) correlation is dominated by “ionomer” scattering, which diminishes or has little contribution in the long-range correlation (large length scale in the low q range). This is supported by the fact that the low-q scattering intensity from dilute Nafion solution follows q-1up to the “ionomer peak”, suggesting that “ionomer” scattering,9 Iionomer(q), should be independent of that from the crystalline phase, Icrystalline(q). Therefore, the scattering function, I(q), can be split into two terms as follows:
I(q) ) Icrystalline(q) + Iionomer(q) (1) Moreover, there is no evident reason to presume that the “ionomer” scattering arises from regularly sized scatterers. We would argue that the density distribution in the hydrophilic domain could more resemble the case of microemulsions considering the mixing of polyions and water. Therefore, Iionomer(q) can be formulated with the Teubner-Strey model (T-S model),18which is derived based on Landau’s free energy theory and Debye-Anderson-Brumberger’s derivation of scat-tering by inhomogeneous domains,19with a correlation function, γ(r) [in eq 2] yielding a scattering function as eq 3.
Figure 2.SANS results of PEM-19 (blue circles) and PEM-32 (green triangles).
Figure 3.TEM images of lead-stained (a) PEM-19 and (b) PEM-38 samples. The dark regions are (lead-stained) water channels.
Figure 4.Rocking curves of PEM-19 (blue circles) and PEM-32 (green triangles) as a function of sample angle (Ψ) at the first-order Bragg’s peak.
γ(r) ) d 2πre -r/ξsin
(
2πr d)
(2) IT-S(q) ) 1 a2+ c1q 2 + c2q 4 (3)where a2, c1, and c2are the coefficients of various terms of order parameters in Landau’s free energy. In the case of microemul-sion, c1indicates the tendency of forming interfaces between domains and is usually negative, when a2is positive, to favor the formation of microemulsion. A positive c2 stabilizes the system to meet the criteria of 4a2c2 - c1 > 0 for a stable morphology.
The T-S scattering function, IT-S(q) describes a morphology of two alternating domains losing long-range order and has a characteristic feature of a low-q plateau with a peak followed by a q-4decay (as shown in Figure 5). Since the intensity of the low-q plateau is simply a flat background for the low-q data, it does not affect the structural parameters of the crystalline phase obtained from the SANS data in this regime. The two length scales, d andξ, in eq 2 represent the domain periodicity (related to spacing of the domains) and the correlation length (related to the decay length of the domains) of the system, respectively, and can be related with the coefficients at the denominator of IT-S(q) as expressed below.18
ξ )
[
1 2(
a2 c2)
1/2 +1 4 c1 c2]
-1/2 and d ) 2π[
1 2(
a2 c2)
1/2 -1 4 c1 c2]
-1/2 (4) The application of the T-S model does not require the assumption of aggregates with a regular shape and size (such as spheres, ellipsoids, disks, cylinders, etc.) or location, yet the ratio of the ionomer/water interfacial area (S) to hydrophilic volume (V), S/V, can be still obtained through Porod’s law: S/V ) [4φwphil(1 - φwphil)]/ξ, where φwphil is the volume fraction of water in the hydrophilic domain.18To find an appropriate scattering model, Icrystalline(q), describ-ing the crystalline phase at low-q regime is more challengdescrib-ing, since a significant interdomain interaction peak (structure factor)
is found in both scattering curves. According to the TEM images, two different models, stacking layered disks (similar to lamellar model with a smaller planar region) and wormlike elongated aggregates with a hard disk structure factor (as shown in Figure 6), were employed to fit the SANS data in order to probe the most plausible morphology. The stacking disk model would assume the periodic structure imaged by TEM was at the edge side of the stacking disks composed of alternating hydrophobic and hydrophilic layers and dispersed uniformly throughout the system. The fitted structural parameters include the size of disks, the thicknesses of each layer, stacking number of the disks, and a Gaussian distribution of one of the layers. This model is similar to the stacking lamellar model proposed by Richter et al. to interpret the structure of a polyethylene-poly(ethylenepropylene) diblock copolymer, where the planar size is assumed to be much larger than the lamellar thickness.20 A detailed description of the stacking disk model (considering a limited planar size) has been previously described and successfully applied to fit the SANS results of organically modified clays.21 In fact, the stacking disk model was also proposed for another PEM material, poly([vinylidene difluoride-co-hexafluoropropylene]-b-styrene) block copolymer.16 The best-fit result of this model to the PEM-19 SANS data indicates several mismatching regions compared with the experimental data. First, the fit overestimates the minimum prior to the first-order peak and the maximum of the second-first-order peak. Second, the model predicts a sharper decrease after the second-order peak. This observation seems to suggest that the stacking disk model tends to overestimate the periodicity of the stacking even when the best-fit stacking number is less than 1.5 (Table 2). However, the structure in TEM images apparently shows a higher periodicity than 1.5. Moreover, the best-fit radius of the disk is ∼3000 Å (Table 2), which was not observed in the TEM image. In light of the aforementioned observations, stacking disks may not be the best model to describe the PEM morphology.
The other model inspired by the TEM data would assume that the periodic domains were the cross sections of elongated objects, which are highly tortuous. Therefore, the wormlike elongated aggregates model proposed for wormlike micelles is chosen to be the form factor, FWL(q).22Because the TEM image shows that these objects are compactly arranged, a hard disk structure factor, SHD(q), is employed to account for such interference.23The use of the hard disk structure factor is based on the assumption that the radial interparticle interaction among the long aggregates is expected to be much more significant than the axial interaction in the current q range. Therefore, Icrystalline(q) can be expressed as
Icrystalline(q) ) ∆F2(1 - φphob)υSHD(q) FWL(q) (5) where ∆F, φphob, andυj are the difference of scattering length densities (SLDs) between hydrophilic and hydrophobic domains, the volume fraction of hydrophobic domain, and the volume of individual cylindrical aggregates, respectively.
This model (denoted as flexible circular cylinders or FCC model) also includes five fitted structural parameters: effective hard disk volume fraction and radius, the radius, the contour length, and persistent length of the elongated objects. The best fit (Figure 5) shows a better agreement with the SANS data at maxima and minima than the stacking disks model, except for the minimum after the second-order peak. The mismatch is mainly attributed to the unrealistic constraint on the fixed, circular radius of the hydrophilic domain and can be improved by introducing an ellipsoidal cross section (Figure 5). The modification results in a flexible ellipsoidal cylinder (FEC) model, which has an additional fitting parameter than the FCC model, the aspect ratio at cross section. We have found that
Figure 5.Best-fitting results of various low-q models (stacking disks in red; flexible cylinders with a circular cross section in orange; flexible ellipsoidal cylinders in black) in comparison with the SANS data. The data of PEM-32 (the green circles) are shifted by a factor of 10 (for better clarity) and only fitted with the flexible ellipsoidal cylinder model. In the high q regime, the best-fitting T-S model to PEM-19 SANS data (the blue triangles) is shown as the dashed line.
aspect ratios (long-to-short axes) of 1.5-2 (Table 2) are sufficient to correct the mismatch. The best fit of the short-axis at cross section is ∼30 Å (Table 2), consistent with the width of the dark (lead stained) regions of the TEM images (Figure 3). The fact that TEM result reveals a similar width of the water
channels for both PEM-19 and PEM-38 is also consistent with the best fitting result of FEC model. Moreover, comparing the dark regions of the two samples, the cross section of PEM-38 seems to be more symmetric than that of PEM-19 (Figure 3); thus, a smaller aspect ratio is expected, agreeing with our best fitting result. As expected, the dark regions are more intercon-nected in the case of PEM-38, possibly indicative of a longer persistent length of the water channels. However, this is difficult to judge from the TEM images, which are projected from 3-D objects with certain depth of field. The best-fitting result of the effective disk radii and volume fractions of the hard disk structure factor also reflects the correct trend of the domain spacing of the crystalline phase in the TEM-images (i.e., PEM-19 > PEM-38). At lower q range (q < 0.005 Å-1), both fits (FCC and FEC models) underestimate the intensity, possibly due to either the overemphases by the structure factor or the scattering tail from other large morphologies, which was observed in ultra SANS measurements of Nafions.7,15,24 In comparison with the stacking disk model, the FEC model is more consistent with the TEM result. Recently, scattering data of stretched Nafions were published in support of cylindrical morphology.25A recent simulation of SANS and SAXS based on the morphology of hexagonally packed inverted-micelle cylindrical bundles by Schmidt-Rohr and Chen also yields a similar scattering curve of Nafion, validating the concept of cylindrical water channels.26However, the origin of the “iono-mer peak” is proposed to be the spacing of the inverted micelles within the bundle which is different from the random distribution and size of ionomer aggregates within the water channels as proposed here by the T-S model.
Discussion
Water Uptake and Morphology of Water Channels.The water uptake of PEM is defined as (〈PEMwet〉weight-〈PEMdry〉weight)/
〈PEMdry〉weight. The validity of the current wormlike model can be examined with the water uptake measurement. Since the SANS data were on an absolute scale, the D2O volume fraction, φD, can be derived from the measured prefactor, ∆F2(1 -φphob)υj, in eq 5 [values listed in Table 2] with known (calculated) SLDs of the hydrophilic (ionomer side chain) domain, Fphil(1.8 × 10⁻⁶Å-2), hydrophobic (polymer backbone) domain, Fphob(3.2 × 10⁻⁶Å-2), and D2O, FD(6.4 × 10⁻⁶Å-2). Both φphoband ∆F are functions of φDas follows: ∆F ) [φDFD + (1 - φD)φphildryFphil]/[φD+ (1 - φD)φphildry] - Fphob], and φphob) (1 - φD)(1 - φphildry), where φphildry is the volume fraction of the hydrophilic domain of the dry film. The value of φphildry can be expressed as wphilVphil/[wphilVphil+ (1 - wphil)Vphob], where wphil is the weight percentage of the hydrophilic domains of the dry film(i.e., 0.19 for PEM-19 and 0.32 for PEM-32) and Vphiland Vphobare the specific volume of hydrophilic and hydrophobic domains (0.83 and 0.63 cm3/g, respectively, estimated from Table 1). Thus, φDcan be obtained as well as the D2O uptakes, which are 23% and 47% for PEM-19 and PEM-32, respectively, agreeing reasonably with the measured values of 19% and 32% at 30°C (Table 1). This consistency implies that the proposed wormlike cylindrical model with a hard disk structure factor is a good candidate to explain the PEM morphology.
According to the Babinet principle,27the coherent scattering behavior of water channel imbedded in a hydrophobic matrix is indistinguishable with that of hydrophobic wormlike cylinders imbedded in hydrophilic domains. However, the former (inter-connected water channels) seems to be the correct morphology since the best fitting radii (Table 2) ∼ 30 Å of the elongated aggregates are consistent with the lead-stained TEM images. Moreover, the best-fitting result shows that the aspect ratio (asymmetry) of the ellipsoidal cross section of PEM-19 is larger than that of PEM-32, also consistent with the TEM images. The other finding is the average persistent length of the water
Figure 6.Various schemes to explain the morphology of the PEMs: (a) stacking disks model, (b) interconnected FCC model, (c) intercon-nected FEC model. In all cases, the green represents hydrophobic domains (presumably polymer backbones) and the blue represents hydrophilic domains (presumably polymer side chains and water). The average interdomain spacing at the crystalline phase, D, yields the crystalline peak. (d) The zoom-in of the hydrophilic domains proposed with the FEC model where hydrophilic side chains (poly(styrenesulfonic acid)groups)aredepictedasblackcurvessequesteringthehydrophobic-water interface and extending into the water channels. The color represents the SLD, which is proposed to change gradually from side-chain-rich regions (blue) to water (i.e., D2O)-rich ionomers (light blue) with a
decay length ofξ (see text), and the average distance among ionomers is d, as described in T-S model.
channels of PEM-32 increases by a factor of 3 compared with that of PEM-19. Presumably, this is due to higher frustration in extending the water channels along the axial direction in the case of a sample with a higher volume fraction of hydrophobic domains (e.g., PEM-19). This frustration mechanism also results in a larger effective radius in the hard disk model, explaining a lower q value of the crystalline peak position in the SANS curve of PEM-19 (Table 2).
Structural Parameters from the T-S Model. The T-S
scattering function reveals important local structures about the PEMs. The best-fitting correlation length,ξ, decreases, while the domain periodicity, d, increases with increased hydrophilic side-chain fraction. Studies on the shift of the ionomer peak of Nafions follow the same trend as that of the current PEM samples, i.e., moving toward lower q with increased hydra-tion.1–8The previous explanation was that this was caused either by a swelling of ionomer clusters (in the core-shell model)2,3 or by a swelling of ionomer spacing.4,5The T-S model agrees more with the latter, yet assuming a random distribution of the ionomers clusters (presumably in water channels) similar to microemulsion in contrast to the constrained locally ordered ionomers.4Teubner and Strey confirmed that the value ofξ/d increased with surfactant concentration in the case of micro-emulsion.18In this comb-shaped PEM, the side-chain sulfonic acid groups seemingly serve a similar function of a surfactant bridging the polymer backbone (oil phase) and waterssequestering the interface of water channel and polymer matrix. However, a lower value ofξ/d of PEM-32 is obtained from the best-fitting result (in Table 2). This can be rationalized if the contrast of the “ionomer peak” arises from the side-chain-rich regions and embedded water-rich ionomers (as shown in Figure 6d). Then, ξ/d is expected to decrease with increased volume fraction of hydrophilic side chains.
Another important piece of information obtained from the SANS data is the parameter, S/V () [4φwphil(1 - φwphil)]/ξ), as mentioned in the previous section. It should be noted that φwphil represents the volume fraction of water with respect to that of the hydrophilic domain (instead of overall water volume fraction) according to our model. The values of φwphilobtained from the water uptake calculation are 0.57 and 0.59 for PEM-19 and PEM-32, respectively, resulting in 0.067 and 0.080 Å2/ Å3of S/V, which is higher than the published results for Nafions (0.0439 Å2/Å3).24
Conclusion
The current compact FEC with the T-S model as shown in Figure 6 is able to fit the SANS data nicely in the q range from
0.005 to 0.4 Å-1 and describes the structure rationally over a large range of length scales. We propose that the comb-shaped PEM copolymer forms interconnected ellipsoidal water channels, within which ionomer aggregates are randomly distributed, similar to a microemulsion (oil and water phases interfaced by surfactants). The short axis of the ellipsoidal cross section of the water channels is in the range of 25-40 Å with an aspect ratio <2. The persistence length of the cylinders varies from 350 to 1200 Å. All these structural parameters depend on the ratio of sulfonic acid side chain to the backbone (i.e., IEC) and are consistent with the TEM images. At a smaller length scale, the ionomer aggregates (presumably in the water channels) have an average periodic spacing of 25-30 Å with a correlation length of 12-15 Å. The proposed model is presumably valid not only for the current PEMs but also for other PEMs in view of recent reports on Nafions.7,9,25,26 Moreover, since only minimal preferential orientation is found along the surface of the film, the wormlike water channels orient more or less isotropically, indicating that the solution casting does not create a situation which defeats the desired property for PEM used in FC, where high proton conductivity is through the film.
Acknowledgment.The SANS measurements utilized facilities supported in part by the National Science Foundation under Agreement DMR-0454672, and we acknowledge the support of the National Institute of Standards and Technology (NIST), U.S. Department of Commerce, in providing the neutron research facilities for this work, NRCC publication No. 49154.
References and Notes
(1) Gierke, T. D.; Munn, G. E.; Wilson, F. C. J. Polym. Sci., Polym. Phys.
Ed. 1981, 19, 1687–1704.
(2) Fujimura, M.; Hashimoto, T.; Kawai, H. Macromolecules 1981, 14, 1309–1315.
(3) Fujimura, M.; Hashimoto, T.; Kawai, H. Macromolecules 1982, 15, 136–144.
(4) Dreyfus, B.; Gebel, G.; Aldebert, P.; Pineri, M.; Escoubes, M.; Thomas, M. J. Phys. (Paris) 1990, 51, 1341–1354.
(5) Litt, M. E. Polym. Prepr 1997, 38, 80–81.
(6) Haubold, H.-G.; Vad, T.; Jungbluth, H.; Hiller, P. Electrochim. Acta
2001, 46, 1559–1563.
(7) Kim, M.-H.; Glinka, J. C.; Grot, S. A.; Grot, W. G. Macromolecules
2006, 39, 4775–4787.
(8) Mauritz, K. A.; Moore, R. B. Chem. ReV. 2004, 104, 4535–4585. (9) Rubatat, L.; Rollet, A. L.; Gebel, G.; Diat, O. Macromolecules 2002,
35, 4050–4055.
(10) Diat, O.; Gebel, G. Nat. Mater. 2008, 7, 13–14. (11) Yang, Y.; Holdcroft, S. Fuel Cells 2005, 5, 171–186.
(12) Rozie`re, J.; Jones, D. J. Annu. ReV. Mater. Res. 2003, 33, 503–555. (13) Hickner, M. A.; Ghassemi, H.; Kim, Y. S.; Einsla, B. R.; McGrath,
J. E. Chem. ReV. 2004, 104, 4587–4612.
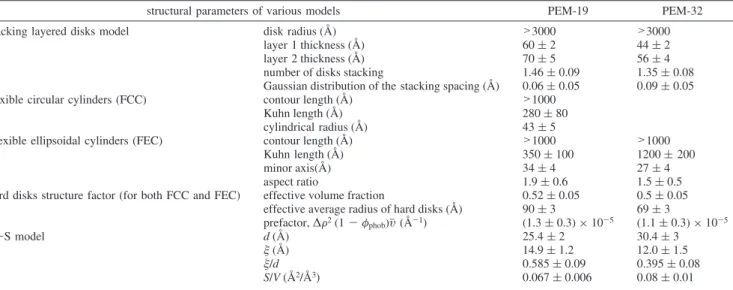
Table 2.Best-Fitting Structural Parameters of Various Models to the SANS Data of PEMs
structural parameters of various models PEM-19 PEM-32 stacking layered disks model disk radius (Å) >3000 >3000
layer 1 thickness (Å) 60 ( 2 44 ( 2 layer 2 thickness (Å) 70 ( 5 56 ( 4 number of disks stacking 1.46 ( 0.09 1.35 ( 0.08 Gaussian distribution of the stacking spacing (Å) 0.06 ( 0.05 0.09 ( 0.05 flexible circular cylinders (FCC) contour length (Å) >1000
Kuhn length (Å) 280 ( 80 cylindrical radius (Å) 43 ( 5
Flexible ellipsoidal cylinders (FEC) contour length (Å) >1000 >1000 Kuhn length (Å) 350 ( 100 1200 ( 200 minor axis(Å) 34 ( 4 27 ( 4 aspect ratio 1.9 ( 0.6 1.5 ( 0.5 hard disks structure factor (for both FCC and FEC) effective volume fraction 0.52 ( 0.05 0.5 ( 0.05
effective average radius of hard disks (Å) 90 ( 3 69 ( 3 prefactor, ∆F2(1 - φ phob)υj (Å-1) (1.3 ( 0.3) × 10-5 (1.1 ( 0.3) × 10-5 T-S model d(Å) 25.4 ( 2 30.4 ( 3 ξ (Å) 14.9 ( 1.2 12.0 ( 1.5 ξ/d 0.585 ( 0.09 0.395 ( 0.08 S/V (Å2/Å3) 0.067 ( 0.006 0.08 ( 0.01
(14) Norsten, T. B.; Guiver, M. D.; Murphy, J.; Astill, T.; Navessin, T.; Holdcroft, S.; Frankamp, B. L.; Rotello, V. M.; Ding, J. AdV. Funct.
Mater. 2006, 16, 1814–1822.
(15) Gebel, G.; Diat, O. Fuel Cells 2005, 5, 261–276.
(16) Rubatat, L.; Shi, Z.; Diat, O.; Holdcroft, S.; Frisken, B. J.
Macro-molecules 2006, 39, 720–730.
(17) Kim, J.; Kim, B.; Jung, B. J. Membr. Sci. 2002, 207, 129–137. (18) Teubner, M.; Strey, R. J. Chem. Phys. 1987, 87, 3195–3200. (19) Debye, P.; Anderson, H. R.; Brumberger, H. J. Appl. Phys. 1957, 28,
679–683.
(20) Richter, D.; Schneiders, D.; Monkenbusch, M.; Willner, L.; Fetters, L. J.; Huang, J. S.; Lin, M.; Mortensen, K.; Farago, B. Macromolecules
1997, 30, 1053–1068.
(21) Ho, D. L.; Briber, R. M.; Glinka, C. J. Chem. Mater. 2001, 13, 1923– 1931.
(22) Chen, W.-R.; Butler, P. D.; Magid, L. J. Langmuir 2006, 22, 6539– 6548.
(23) Rosenfeld, Y. Phys. ReV. A 1990, 42, 5978–5989.
(24) Gebel, G.; Lambard, J. Macromolecules 1997, 30, 7914–7920. (25) Rubatat, L.; Diat, O. Macromolecules 2007, 40, 9455–9462. (26) Schmidt-Rohr, K.; Chen, Q. Nat. Mater. 2008, 7, 75–83.
(27) Higgins, J. S.; Benoit, H. C. Polymers and Neutron Scattering; Oxford University Press: New York, 1994.