HAL Id: hal-02876992
https://hal-pjse.archives-ouvertes.fr/hal-02876992
Preprint submitted on 21 Jun 2020HAL is a multi-disciplinary open access
archive for the deposit and dissemination of sci-entific research documents, whether they are pub-lished or not. The documents may come from teaching and research institutions in France or abroad, or from public or private research centers.
L’archive ouverte pluridisciplinaire HAL, est destinée au dépôt et à la diffusion de documents scientifiques de niveau recherche, publiés ou non, émanant des établissements d’enseignement et de recherche français ou étrangers, des laboratoires publics ou privés.
Income Inequality and Ethnic Cleavages in Malaysia:
Evidence from Distributional National Accounts
(1984-2014)
Muhammed Abdul Khalid, Li Yang
To cite this version:
Muhammed Abdul Khalid, Li Yang. Income Inequality and Ethnic Cleavages in Malaysia: Evidence from Distributional National Accounts (1984-2014). 2019. �hal-02876992�
World Inequality Lab Working papers n°2019/09
"Income Inequality and Ethnic Cleavages in Malaysia: Evidence from
Distributional National Accounts (1984-2014)"
Muhammed Abdul Khalid, Li Yang
Keywords : Income Inequality ; Ethnic Cleavages ; Malaysia; Distributional
National Accounts; DINA
1
I
NCOME
I
NEQUALITY AND
E
THNIC
C
LEAVAGES IN
M
ALAYSIA
E
VIDENCE
F
ROM
D
ISTRIBUTIONAL
N
ATIONAL
A
CCOUNTS
(1984-2014)*
Muhammed Abdul Khalid (National University of Malaysia)
Li Yang (Paris School of Economics)
April 15, 2019
Abstract
In this paper, we document the evolution of income inequality in Malaysia, not only at the national level (for the period of 1984-2014) but also by ethnic group (for the period of 2002-2014). We combine information obtained from national accounts, household surveys, fiscal data, and demographic statistics. To our knowledge this is the first attempt to produce inequality measurements of Malaysia, which are fully consistent with the national accounts. Our research shows that despite Malaysia’s exceptional economic growth rate, its growth has been inclusive. For the period of 2002 – 2014, the real income growth for the bottom 50% is the highest (5.2%), followed by the middle 40% (4.1%), the top 10% (2.7%) and then the top 1% (1.6%). However, while average growth rates are positive across all ethnic groups (Bumiputera 4.9%, Indians 4.8%, and Chinese 2.7%), the highest growth of real income per adult accrued to the Bumiputera in the top 1% (at 8.3%), which sharply contrasts the much lower growth rate of the Indians (at 3.4%) and negative income growth rates of the Chinese (at -0.6%). Despite the negative growth rate, the Chinese still account for the lion’s share in the top 1%. In 2014, 60% of the adults in the top 1% income group are Chinese, while 33% Bumiputera, and 6% Indians (compared to 2002, in which the top 1% consists of 72% Chinese, 24% Bumiputera, and 3% Indians). We conclude that in this period, Malaysia’s growth features an inclusive redistribution between income classes, but with a twist between racial groups.
*
Muhammed Abdul Khalid: muhammed@pmo.gov.my. Li Yang: li.yang@psemail.eu. This paper
is supplemented by a data appendix that is available online at http://WID.world. We acknowledge
financial support from the European Commission under H2020-MSCA-IF-2018 Grant Agreement No.
799444.
2
I.
I
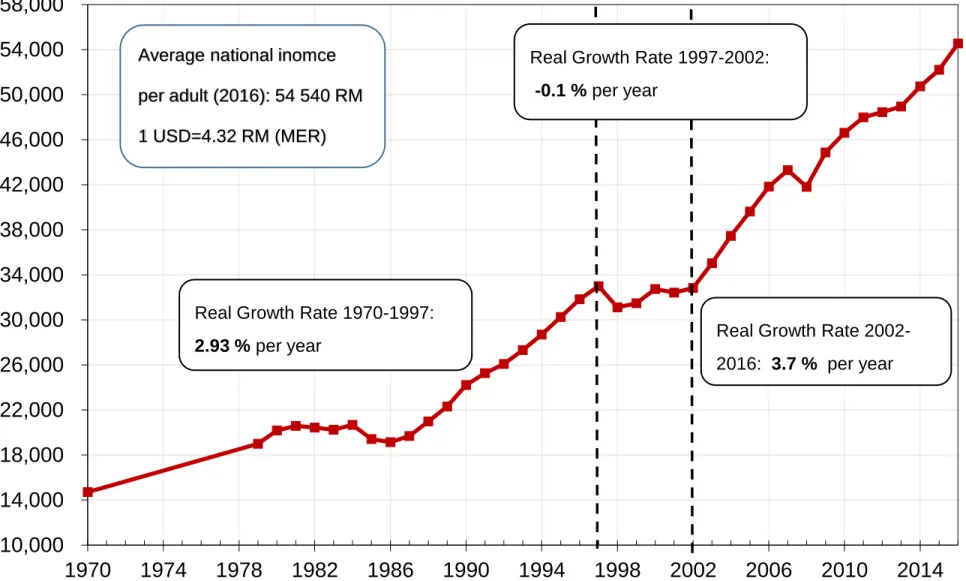
NTRODUCTIONBy combining information obtained from national accounts, survey data, and fiscal data, this paper attempts to construct the first Distributional National Account for Malaysia and analyze the distributional impact among classes (for the period of 1984-2014) and among different ethnic groups (2002-2014). Malaysia has been experiencing impressive economic growth, and a report from the World Bank shows that Malaysia was one of 13 countries that managed to achieve average growth of more than 7% annually during the period 1967-1997.1
From the 1970s to 1997, the growth rate of the per adult real national income has been 2.93%. After a short setback following the Asian Financial Crisis, the economy has been catching up with an even stronger trend, and from 2002 to 2016, the growth rate of the per adult national income was 3.7% (see Figure 1.1). However, the benefits of growth always remain a contentious issue, especially in a plural society such as Malaysia with its multiracial, multireligious and multi-ethnic population. In 2014, the society consists of approximately 68% Bumiputera2, 24% Chinese, 7% Indian, and 1% others. Inherited as a legacy of British colonial policies, the
Bumiputera have remained the poorest group with the lowest average income, compared to the relatively richer minority contingent of ethnic Chinese and Indians, since Malaysia gained independence in 1957.
Figure 1.1
Precolonial Malaysia was relatively homogenous, with Malays3 forming the majority of the population.
However, it became a pluralistic society in the mid-19th century due to a massive migration of Chinese (mostly
from Guangdong and Fujian) and Indian laborers (mainly Tamil-speakers from the south of India) brought upon by the British colonizers. The influx was substantial, and the population of Peninsular Malaysia tripled from 0.75 million. in 1891 to 2.3 million in just two decades.4
The speed of the influx of migrants from these two countries was very substantial, and there were periods where they had a larger population than the natives. In fact, when the country gained its independence, approximately half of the population was migrant ethnic Chinese and Indians. As a consequence, the political dynamics of the country changed. While the Malays constituted 84% of the total electorate in 1955, their numbers reduced to just 56% in 1969.5 This is equivalent to the reduction of the Malay majority constituencies from 96% of the total
parliament seats in 1955 to just 54% in 1969. The speed of the reconfiguration of the national demographics is almost unparalleled compared to other countries.
This very large influx was both economically and politically motivated. The economic motivation was to use
1 World Bank (2008)
2 A Malaysian term describe Malays and other indigenous peoples of Southeast Asia, it literally translated as Son of the soil in
Sanskrit.
3 Approximately 90% of Bumiputera are Malays, while the rest are natives from Sabah and Sarawak. 4 For more details on the demographic trends in Malaysia, please see the online Appendix, Figure A1-A4. 5 ibid
3 cheap migrant labor to extract lucrative tin (mostly by the Chinese) and rubber (by the Indians) – of which Malaya was the largest producer in the world at that time. In 1930, for instance, Malaya accounted for approximately 2/3 of global tin production and ½ of global rubber production. It was a lucrative colony for the British and nicknamed the ‘dollar arsenal of the British Empire’. In fact, capital from Malaya was expropriated to fund the reconstruction of London after World War II. Apart from tin and rubber, the bulk of the revenues of the colonial government came from the nationalized and monopolized sale of opium (interestingly, while opium was banned in England, it was legal in colonial Malaya).
Politically, the importation of the Chinese and Indian laborers to work in these two industries prevented the empowerment of the native population, who resided mostly in rural areas focusing on agriculture. It was easier to control a country with a ‘plural society’ in which people ‘mix but do not combine’.6
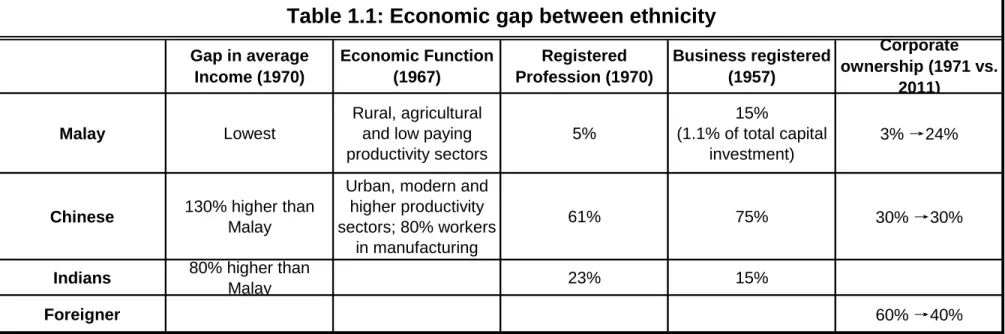
The economic development was, naturally, unequal, due to the racial division of labor. Table 1.1 below shows the gap between the ethnicities. Malays were the most backward in all spheres, compared to the nonMalays.
Table 1.1
The disparity among the races extended beyond the economic sector; for example, disparity was manifested in education. In 1968, among all the students at the University of Malaya – the only university in the country at that time – 1,488 Chinese students graduated with a Bachelor of Science degree compared to just 69 Malays, and in engineering, 408 Chinese students received a bachelor’s degree compared to only 4 Malays.7 In 1970,
there were only four Malays in the medical faculty (out of 67 graduates), and in the engineering faculty, there was only one Malay out of 71 graduates.8
This economic imbalance, especially along racial lines, was a recipe for disaster. It naturally led to political and social instability, and racial riots erupted slightly more than a decade after the country gained its independence. As a response to the race riot in 1969, the government developed a comprehensive affirmative action plan known as the New Economic Policy (NEP) in 1971.
The NEP was formulated with the overriding objective of attaining national unity and fostering nation-building through the two-pronged strategy of eradicating poverty and restructuring society.9 The first prong of the NEP
strategy was to eradicate poverty, irrespective of race, while the second prong of the NEP strategy sought to restructure society by eliminating the identification of race with the economic function.10 While the first prong
is class-based, the second prong was designed to elevate the socioeconomic conditions of the Malays. The strategy was not new; in fact, the constitution of the country specifically highlighted the special position of the Malays. Article 153 of the constitution grants the Yang di-Pertuan Agong (loosely translated as the King)
6 See Furnivall, 1948
7 Muhammed Abdul Khalid (2014) The Color of Inequality 8 Ibid
9 Malaysia. 2nd Malaysia Plan. Government of Malaysia, 1971. 10 Ibid.
4 responsibility for safeguarding the special position of the 'Malays' and natives of any of the States of Sabah and Sarawak as well as the legitimate interests of other communities. This article goes on to specify ways to do this, such as establishing quotas for entry into civil service, public scholarships and public education.11
The NEP expanded the affirmative action as enshrined in the Constitution. This inclusive growth policy continued to be adopted throughout Malaysia’s post-NEP economic history and was included in the National Development Policy (NDP) (1990-2000) and National Vision Policy (2000-2010). The inclusiveness agenda continues in the New Economic Model (2010-2020), where the policy goal is for Malaysia to become a high-income country by 2020 as well as sustainable and inclusive; the latter is defined as “enabling all communities to fully benefit from the wealth of the country” (National Economic Advisory Council, 2010, p89).
The NEP had specific targets: 1) to reduce poverty from 49.3% in 1970 to 16.7% by 1990 and 2) to restructure the employment patterns, the ownership of capital in the corporate sector and the creation of the Bumiputera Commercial and Industrial Community (BCIC). One of its goals was that by 1990, the Bumiputera would own and manage at least 30% of the total commercial and industrial activities of the economy, which would be an increase from approximately 2% in 1970. The second target was clearly designed to reduce the economic gap between the Bumiputera and the nonBumiputera, especially the Chinese.
The NEP, to some extent, achieved remarkable results. Poverty reduced from nearly 50% in 1970 to less than 1% in 2014. The income gap also shrunk. Household income inequality, as measured by the Gini coefficient, narrowed from 0.513 in 1970 to 0.446 in 1989 to 0.410 in 2014. Poverty reduction also contributed to the decrease in the income gap. Ravallion (2019), using official (absolute) poverty measures, shows that “about 10% of the overall rate of poverty reduction is accountable to reduced inequality in average incomes between the main ethnic groups…while using the proposed relative poverty measure it would probably rise to about 17%”. The nominal monthly household income gap between the ethnic minority Chinese and the ethnic majority Bumiputera reduced from 2.29 in 1970 to approximately 1.38 in 2014. The share of Bumiputera professionals also increased, and the equity share jumped from less than 2% in 1970 to approximately 22% in 2008. The reduction in poverty and inequality in Malaysia is spectacular, considering that many countries experience an increase in inequality despite a reduction in poverty. The reduction in poverty and inequality was achieved through robust and sustainable economic growth. Notably, “there is no sign that the NEP period came at a cost to the rate of growth” (Ravallion, 2019, p.14). Malaysia’s economic performance during the period of the NEP has been relatively robust compared to that of other countries; in fact, its economic growth rate during the period exceeded that of many developing and developed countries.
Interestingly, the introduction of the NEP was a direct result of the racial clash that was trigged by severe losses of the ruling government in the 1969 general election, where they lost more than half of the majority votes. The
11 Article 153 of the Malaysia constitution: “(2) Notwithstanding anything in this Constitution, but subject to the provisions of
Article 40 and of this Article, the Yang di-Pertuan Agong shall exercise his functions under this Constitution and federal law in such manner as may be necessary to safeguard the special position of the Malays and natives of any of the States of Sabah and Sarawak and to ensure the reservation for Malays and natives of any of the States of Sabah and Sarawak of such proportion as he may deem reasonable of positions in the public service (other than the public service of a State) and of scholarships, exhibitions and other similar educational or training privileges or special facilities given or accorded by the Federal Government and, when any permit or license for the operation of any trade or business is required by federal law, then, subject to the provisions of that law and this Article, of such permits and licences.”
5 Malay vote was split between the ruling Malay party and the Islamist party that was part of the opposition. The beneficiary was the Chinese, as the majority of Chinese voted for the opposition, a Chinese-based political party (the Democratic Action Party). The Chinese believed that the government was favoring the Malays, while the Malay felt that they were not benefiting from development despite being an independent nation (in fact, poverty among the Malays did not reduce at all between 1957 when Malaysia gained its independence to the year before the race riot). However, a cabinet paper showed that the root cause of the riot was the socioeconomic imbalance among the ethnic groups (Aziz et al. 1987). The NEP, which was imposed immediately after the riot, has, to a certain extent, improved the economic condition of the Malays. In a dramatic twist, the recent election (2018) was again monumental; the coalition that has ruled Malaysia uninterruptedly since its independence lost to an opposition coalition. The root cause was not unlike the cause of political changes in the past–the Malays felt that the benefits from growth did not trickle down to them, and only the well-connected groups who were involved in corruption enjoyed the fruits of development. The recent election also showed that the majority of Chinese voted for the opposition, as occurred in 1969. The Malaysia experience shows that inclusiveness does matter for political and social stability.
There is a large body of the literature studying the impact of affirmative action programs and the NEP on poverty and income distribution12, education and employment13, and corporate ownership14; most of the studies are either
case studies or rely heavily on macro data obtained from government publications. Only a few systematic studies, such as Milanovic (2006) and Muhammed Abdul Khalid (2014), quantitatively analyze the income distribution among the ethnic groups using micro-level data.
In this paper, we want to answer an important question: In terms of income and income growth, who benefits from economic growth and to what extent, especially considering that Malaysia has an extensive race-based affirmative action policy? Unlike other studies that use household socioeconomic surveys, we construct distributional national accounts (DINA) for Malaysia by combining information obtained from national accounts, household surveys, fiscal data, and other historical data. The DINA allows us to better understand inequality in Malaysia and is useful for cross-country comparisons (Piketty and Zucman, 2014, Piketty, Saez and Zucman, 2018, Garbinti, Goupille and Piketty 2017, 2018, Piketty, Yang, and Zucman, 2019).
This paper determines who benefits from economic growth in terms of ethnic groups (Bumiputera vs. Chinese vs. Indians), and income groups (Top 1% vs. Top 10% vs. Middle 40% vs. Bottom 50%). To obtain a full picture of the evolution of inequality in Malaysia, ideally, we would carry out the analysis for the period 1957-2016, but due to data limitations, we focus the period 2002-2014, the period after the Asian Financial Crisis (AFC). In other words, we provide only partial answers to the question posed earlier: Who benefited from post-AFC economic growth?
This paper is organized as follows. The next section briefly describes the concepts, data sources and methodology
12 E.g. Ravallion (2019), UNDP (2014), Muhammed Abdul Khalid (2014), Ragayah (2008), Faaland, J., Parkinson, J. R., &
Saniman, R. (2003), Ishak Shari (2000), Shireen Mardiziah Hashim (1998)
13 E.g., see Hwok-Aun Lee (2012, 2017), Ngoc Ha Le (2016)
6 used in our study. Section three outlines the analysis of the evolution of income inequality in Malaysia, and the key findings are presented in the fourth section. The fifth section concludes.
II.
C
ONCEPTS,
D
ATAS
OURCES ANDM
ETHODOLOGYIn this paper, we combine information obtained from national accounts, household income surveys, fiscal data, and demographic statistics to estimate and analyze the evolution of income inequality in Malaysia for the period 2002-2014. The concepts and methodology used in this paper are in line with the DINA guidelines, which are used for the World Inequality Database (Alvaredo et al., 2016). In this section, we focus on the main conceptual issues the estimation process; complete methodological details are provided in the online Appendix.
2.1 DINA
Attempts to introduce distributional measures in national accounts can be traced back to the first national accounts in history—the famous social tables produced in the 17th century, which document the distribution of
England’s income, consumption, and savings across 26 social classes – from temporal lords and baronets to vagrants (Barnett, 1936). Most modern attempts follow the pioneering contribution of Kuznets (1953), who first combined income tax tabulations with a national income series to estimate the top income shares in the US over the period 1913-1948. His methods were then further extended by Piketty (2003) for France, by Piketty and Saez (2003) for the US, by Atkinson (2005) for the UK, and by Atkinson and Piketty (2007, 2010) for a global perspective on top incomes.
As pointed out by Piketty, Saez and Zucman (2018), these studies suffer from an important limitation: the inequality series capture taxable income only and miss all tax-exempt capital and labor income. To address this shortcoming systemically, Alvaredo et al. (2016) introduced the DINA guideline. DINA is a harmonized national accounting framework that describes the entire distribution of income and wealth, from bottom to top, using concepts consistent with macroeconomic national accounts. Under this framework, we can systematically map in detail how national income and wealth are distributed in the population and make meaningful and comprehensive comparisons among different nations.15 Following the guideline, recently, a body of the
literature has emerged that focuses on constructing DINA series in both high-income countries and emerging countries by combining information obtained from fiscal data, survey and national accounts (e.g., Piketty, Yang, Zucman, 2019; Novokmet, Piketty, Zucman, 2018; Piketty, Saez and Zucman, 2018; Garbinti, Goupille-Lebret and Piketty, 2018). This literature contributes to the expansion of the World Inequality Database (WID.world), which aims to develop and improve homogenous DINA for as many countries as possible. Following the literature, this paper constructs the DINA series of Malaysia for the period 2002-2014. Additionally, we extend the DINA framework to analyze the evolution of income inequality among different ethnic groups, which has been one of the most important national issues since the founding of Malaysia in 1957.
15 Provided that all the data is available, the most detailed DINA is able to measure the percentiles of the distribution of
incomes/wealth by income sources/wealth categories (e.g., for income: wage income, capital income, and transfer income; for wealth: nonfinancial assets, financial assets, liabilities, etc.) and by institutional sector (public, private, and foreign).
7
2.2 Income Concepts
Following the conceptual framework of the U.N. System of National Accounts (SNA, 2008) and the definitions used by Piketty (2014), Alvaredo et al. (2016), and Piketty, Yang Zucman (2019), in this research we aim to present consistent distributional series based upon three basic income measures: pretax fiscal income (𝑦𝑓) , pretax personal income (𝑦𝑝) and pretax national income (𝑦). Pretax national income (𝑦) is equal to the sum of all income flows going to labor and capital after taking into account the operation of the pension system but before considering income taxes and social contributions. The same rule applies to fiscal income in Malaysia: it includes social contributions that are tax deductible and pensions that are tax exempt.16
Although fiscal income has been used widely in previous studies, it can dramatically diverge from national income due to the nontaxable components of income and production taxes because a significant part of capital income is tax exempt and therefore not reported in income tax data, such as the case of corporate retained earnings. Thus, in this paper, we use pretax national income as the benchmark measure for income distribution. In the online Appendix, we provide complete corresponding estimations, figures and decompositions based on pretax fiscal income.
Below, we explain these concepts based on the income categories defined in the U.N. System of National Accounts (SNA, 2008).
National income is defined as follows:
⑴ 𝑌𝑡= 𝐺𝐷𝑃𝑡− 𝐾𝐷𝑡+ 𝐹𝑌𝑡 (𝑁𝑒𝑡 𝐹𝑜𝑟𝑒𝑖𝑔𝑛 𝐼𝑛𝑐𝑜𝑚𝑒) Additionally, 𝑌𝑡 can be further decomposed to:
⑵ 𝑌𝑡= 𝑌𝑑𝑡𝐻+ 𝑌𝑑𝑡𝐶 + 𝑌𝑑𝑡𝐺 + 𝐹𝐶𝑇𝑡 (𝑁𝑒𝑡 𝐹𝑜𝑟𝑒𝑖𝑔𝑛 𝑐𝑢𝑟𝑟𝑒𝑛𝑡 𝑡𝑟𝑎𝑛𝑠𝑓𝑒𝑟)
where 𝑌𝑑𝑡𝐻, 𝑌𝑑𝑡𝐶, and 𝑌𝑑𝑡𝐺 represent the disposable incomes of households, corporations, and the government sector, respectively. We define the following:
⑶ Pretax fiscal income 𝑦𝑓= 𝑌𝑑𝑡𝐻+ 𝑇𝑡 (𝑇𝑎𝑥 𝑜𝑛 𝐼𝑛𝑑𝑖𝑣𝑖𝑑𝑢𝑎𝑙 𝐼𝑛𝑐𝑜𝑚𝑒 𝑎𝑛𝑑 𝑤𝑒𝑎𝑙𝑡ℎ) + 𝑆𝐶𝑡 (𝑆𝑜𝑐𝑖𝑎𝑙 𝑐𝑜𝑛𝑡𝑟𝑖𝑏𝑢𝑡𝑖𝑜𝑛)17
and
⑷ Pretax government income 𝑦𝑔= 𝑌𝑑𝑡𝐺 − 𝑇𝑡 (𝑇𝑎𝑥 𝑜𝑛 𝐼𝑛𝑑𝑖𝑣𝑖𝑑𝑢𝑎𝑙 𝐼𝑛𝑐𝑜𝑚𝑒 𝑎𝑛𝑑 𝑤𝑒𝑎𝑙𝑡ℎ) − 𝑆𝐶𝑡 (𝑆𝑜𝑐𝑖𝑎𝑙 𝑐𝑜𝑛𝑡𝑟𝑖𝑏𝑢𝑡𝑖𝑜𝑛)
16 Following the Inland Revenue Board of Malaysia, we define fiscal income as total income, which includes gross salary (before
taxes and social contributions), capital income, pensions, and business income, while social contributions (e.g., contributions to the Employees Provident Fund) is deductible with a ceiling of 6000 RM per year, and pensions are tax exempt. For more details, please see Public Ruling No. 6/2011 (Inland Revenue Board Malaysia).
17 In the case of Malaysia, we include imputed rent in pre-tax fiscal income. Meanwhile to be consistent with the conception of
pre-tax fiscal income used by the World Inequality Database (WID.world), we publish the distribution series of pre-tax fiscal income excluding the imputed rent in the database.
8 Furthermore, corporate disposable income (corporate retained earnings) can be decomposed into private, public, and foreign disposable income, as shown below:
⑸ 𝑌𝑑𝑡𝐶 = 𝑌𝑑𝑡𝐶ℎ+ 𝑌𝑑𝑡 𝐶𝑔
+ 𝑌𝑑𝑡𝐶𝑓 Following Alvaredo et al. (2016),
⑹ Pretax personal income 𝑦𝑝= Pretax fiscal income 𝑦𝑓+ 𝑌𝑑𝑡𝐶ℎ and
⑺ Pretax public income 𝑦𝑝𝑢𝑏= Pretax government income 𝑦𝑔+ 𝑌𝑑𝑡 𝐶𝑔
Thus, pretax national income 𝑦 (which is equal to national income 𝑌𝑡) can be decomposed as follows: ⑻ 𝑦 = 𝑦𝑝+ 𝑦𝑝𝑢𝑏+ 𝑦𝑓𝑛, where 𝑦𝑓𝑛= 𝐹𝐶𝑇𝑡+ 𝑌𝑑𝑡
𝐶𝑓 .
To be consistent with the existing DINA series in the World Inequality Database (WID.world), we use adults (20+) as the tax unit. The series in our preferred income distribution series refer to the distribution of income among equal-split adults (i.e., the income of married couples is divided into two)18.
In the following sections, we will explain step-by-step how we construct the distribution series of 𝑦𝑓, 𝑦𝑝 and 𝑦.
2.3 Data Sources
Our DINA series mainly includes data from four sources: national accounts, household income surveys, fiscal data, and demographic statistics.
Detailed data in the Malaysia national accounts for the period of 2000-2014 are obtained from the “Distribution & Use of Income Accounts and Capital Account” (Department of Statistics 2006-2018), which are constructed based on SNA (2008). By decomposing national income, we are able to calculate the total pretax fiscal income 𝑦𝑓 and pretax personal income 𝑦𝑝. For example, in 2014, 𝑦𝑓 and 𝑦𝑝 account for 72% and 83% of the national income, respectively. In the following section, we provide a detailed description of the decomposition of the national income of Malaysia. The complete decomposition of national income and the methodological details are provided in Data Appendix: Malaysia A3.1-A3.2.
The Household Income Survey (HIS) has been implemented twice every 5 years since 1973 by the Department
18 This is the same equal-split adult concept that is used in distributional national accounts series recently constructed for the US
(Piketty, Saez and Zucman, 2018) and France (Garbinti, Goupille and Piketty, 2018), except that the equal-split operation is done at the household level in Malaysia rather than at the tax-unit level (married couples), as done for the US and France. Therefore, we probably somewhat underestimate inequality in Malaysia as compared to that of the US and France (i.e., we impose more intrahousehold redistribution than is imposed for the US and France).
9 of Statistics, Malaysia19 and is the most comprehensive survey in Malaysia. This survey provides detailed
information on the income of households, as well as demographic characteristics across socioeconomic groups, i.e., gender, age, race, profession, industry, etc. The survey covers only Malaysian citizens. The sample size of the survey varies from 0.7% to 1.2% of Malaysian households in Malaysia (i.e., HIS 2002 covers 0.73% of households, and HIS 2016 covers 1.25%).
Due to the restriction of the administration that oversees data on Malaysia’s statistics, micro-level data from the HIS are not publicly accessible. Thus, other than official publications on aggregated inequality estimates, few studies on Malaysia inequality use HIS micro data.20 With support from the Malaysia government, we are
fortunate to obtain access to the HIS micro dataset for the period of 1984-2014, namely, HIS 1984, 1989, 1997, 2002, 2004, 2007, 2009, 2012, and 2014. HIS data are normally available in two forms: household-level and individual-level data. In our case, HIS 1984, 1989, and 1997 provide data at the individual level, and HIS 2002-2014 provide data at the household level. Using equal-split adults as the unit of observation, we are able to construct a consistent inequality estimation from 1984 to 2014, despite differences in the unit of observation in HIS. Unfortunately, the variable identifying ethnicity (namely, Bumiputra, Chinese, Indians, and others) is available only for HIS 2002-2014; thus, we are only able to conduct ethnicity-based analysis for the corresponding period.
The percentage of taxpayers in the total adult population in Malaysia varies from 12% to 18% for the period of 1984-2014 (i.e., in 2014, the percentage was 18.2%). Broadly speaking, there are two types of raw tax data published by tax administrations around the world. The first one is fiscal income, referring to total income that is or should be reported on income tax declarations (before any specific deductions allowed by fiscal legislation), and the second one is taxable income, referring to fiscal income minus existing income tax deductions. In Malaysia, the Inland Revenue Board of Malaysia publishes only the taxable income tabulations annually (see Yearbook of Statistics Malaysia). Corrections need to be made to recover fiscal income from taxable income. Following the publication “Tax Relief for Resident Individuals” published by the Inland Revenue Board of Malaysia21 , we estimated the average deductions per taxpayer based on various sources, such as the HIS,
Household Expenditure Survey (HES), and annual report of Employees Provident Fund (EPF). We then apply the estimated average deduction to all tax payers; e.g., in 2014, the average deductions per taxpayer as approximately 14600 RM. Please see online Appendix A1 for a detailed discussion on the estimation of tax deductions.
To combine data from the national accounts, HISs, and fiscal data to construct a consistent DINA series, we need to harmonize the different income concepts used by the various sources. More precisely, we need to calculate income using a consistent income concept (i.e., pretax income) for data obtained from both macro- and micro-level data sources (i.e., national accounts, HISs, and fiscal data). Based on the definition of pretax fiscal income provided above, we also harmonize the micro survey data and generate the corresponding survey-based pretax
19 Starting in 1987, The Basic Amenities Survey was conducted together with the HIS and known as the Household
Income/Basic Amenities Survey (HIS/BA).
20 For existing research using HIS micro data, please see Milanovic (2006) and Khalid (2014). 21 See the official website of the Inland Revenue Board of Malaysia: http://www.hasil.gov.my.
10 income by comparing the guidelines of the HIS with those of the national accounts of Malaysia.22 We provide
a detailed discussion on data harmonization in the online Appendix A2.
Demographic statistics were obtained from the Department of Statistics, Malaysia and the Labour Force Survey. In Data Appendix: Malaysia, A1.0-A1.10, we provide detailed population decompositions by age, ethnicity, and employment.
2.4 Methodology
In this section, we describe step-by-step how we construct the inequality series of pretax fiscal income, pretax personal income and pretax national income. Specifically, we construct our income distribution series in three steps: (i) we start with the data from the HIS; (ii) we correct the surveys using fiscal data; and (iii) we use data from the national accounts and information on capital income from correct surveys to impute tax-exempt capital income (e.g., undistributed corporate profit). All corresponding computer codes are provided in the Data Appendix: DistributionSeries.
Step 1. We start by estimating the inequality series using the Malaysia HIS. As mentioned before, we first
calculate pretax survey income 𝑦𝑠23 with equal-split adult individuals as the unit of observation.24 To be consistent with the calculation used for distribution in the World Wealth and Income Database (WID.world), we generate standardized generalized percentiles (or g-percentiles) based on micro survey data.25 However, surveys
often fail to keep track of income at the very top of the distribution, and important components of national income are missing, especially for top income earners; i.e., the total pretax survey income accounts for approximately 70%-80% of pretax fiscal income in the national accounts (See Data Appendix: Malaysia A2.2.1).
Step 2. To overcome the problem regarding missing survey data for the top incomes, we correct the survey using
fiscal data. To do so, we adopt the novel reweighting method proposed in Blanchet, Flores, Morgan (2018). The basic idea is to adjust the weight of the survey26 using fiscal data in a nonparametric manner27 under the
22 The income definition and categories used in the HIS are based on the concepts and guidelines in “A Provisional Framework
for Household Income, Consumption, Saving and Wealth” (1995) published by Australian Bureau of Statistics (ABS) as a guideline for the “Final Report and Recommendations of the Expert Group on the Household Income Statistics” (The Canberra Group 2001). The income definition and categories used in Malaysia’s National Accounts are based on the U.N. System of National Accounts (SNA, 2008).
23 Pretax survey income=Earnings + Income from self-employment + Rent of the house + Property income + Current transfer
received + Current transfer paid– Imputed rent. For a discussion, please see the online Appendix A2.
24 That is, we are interested in the distribution of per-adult income and divide household income by the number of adults in each
household.
25 There are 127 g-percentiles: 99 for the bottom 99 percentiles, 9 for the bottom 9 tenth-of-percentiles of the top percentile, 9 for
the bottom 9 one-hundredth-of-percentiles of the top tenth-of-percentiles, and 10 for the 10 one-thousandth-of-percentile of the top one-hundredth-of-percentile.
26 In addition to adjusting the weight of the survey, the reweighting method also adjust the very top incomes by adding
observations.
27 in contrast to previous reweight methods used in the literature, Blanchet, Flores, Morgan (2018) use a data-driven method,
instead of relying on ad hoc assumptions and parameters, to determine where the bias starts in the survey data and beyond which point incomes are merged from tax data into the survey data.
11 assumption that tax data sets a credible lower bound on the number of people with given levels of income. Rather than directly making assumptions regarding the behavior of complex statistics such as quantiles or bracket averages (i.e., Piketty, Yang, and Zucman, 2019; Chancel and Piketty, 2017; Czajka, 2017; Morgan, 2017), their method makes easily interpretable assumptions at the observation level. Most importantly, this method allows us to correct the income distribution without losing the richness of the information in surveys. Therefore, in the adjusted survey data, the representativeness in terms of age, gender, or ethnicity, in the case of this research, will be maintained. We provide the full results of the correction and the corresponding computer code used for applying the method in Data Appendix: DistributionSeries; please see online Appendix B11. For a complete description of the process and detailed robustness checks of the method, please see Blanchet, Flores, Morgan (2018).
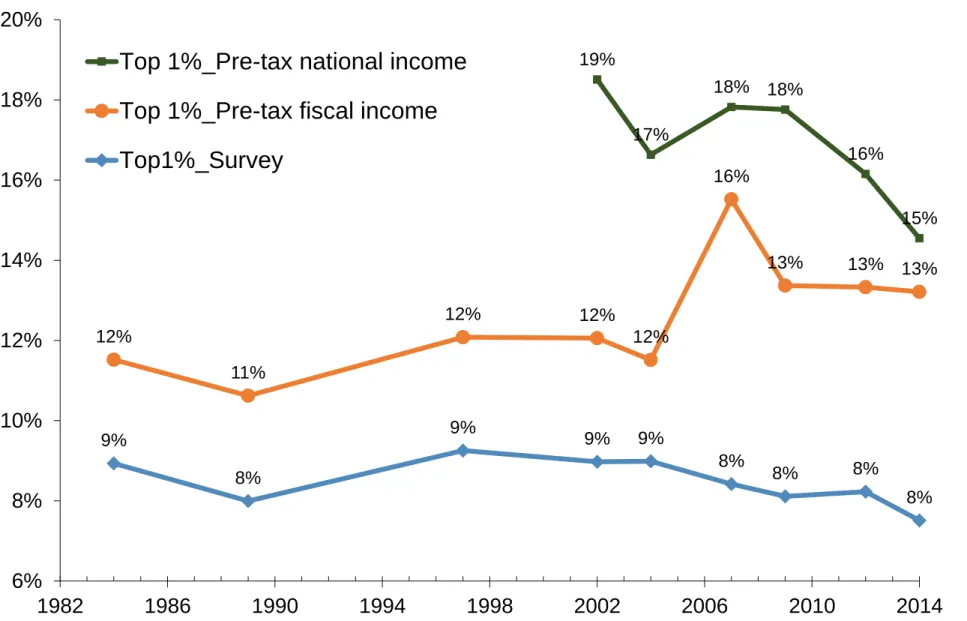
Using the reweighting method, we correct the top income shares in the upward direction (the top 1% and the top 10%) for Malaysia; i.e., the top 1% share of pretax survey income in 2014 is 7.5%, and the corrected top 1% share rises sharply to 13.2% (see Figure 2.1). Meanwhile, total pretax fiscal income based on the adjusted survey data accounts for approximately 80%-90% of pretax fiscal income in the national accounts, compared to 70%-80% based on the raw survey (see Data Appendix: Malaysia A2.2.2). We need to stress that the current results are far from being perfect because more than 10% of the pretax fiscal income is still unexplained even after the correction. This gap can be explained by tax-exempt income, tax avoidance and tax evasion. However, with the currently available fiscal data, namely, taxable income, we are not able to further correct the data in this step; more investigations are needed when more detailed data are available. For now, we simply conduct the following reconciliation exercise to adjust the survey data. We upscale the income of each observation in the adjusted survey data so that the total adjusted pretax survey income matches the pretax fiscal income in the national accounts. The assumption behind this simple adjustment is that tax evasion and tax avoidance behaviors do not vary along each income-specific distribution. Alstadsaeter, Johannesen and Zucman (2018) provide evidence that tax evasion is positively correlated with income and wealth. Our assumption is therefore very conservative, and our results should be seen as the lower bound of the true level of income concentration. We have now constructed a distributional series of pretax fiscal income 𝑦𝑓 that is consistent with the national accounts
Figure 2.1
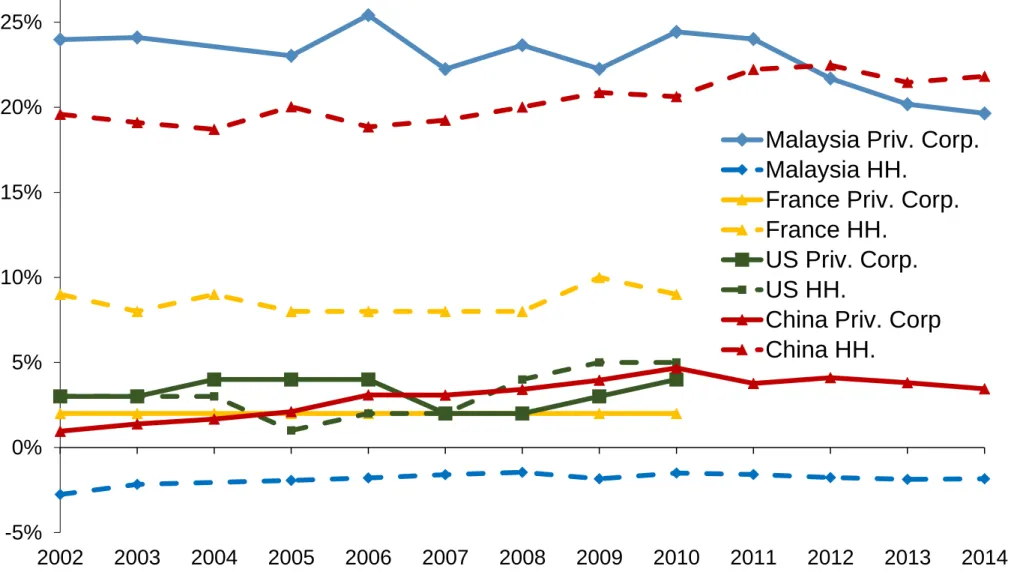
Step 3. Finally, we correct our pretax fiscal income (𝑦𝑓) series to take tax-exempt capital income into account and to estimate the distribution of total pretax personal income (𝑦𝑝). Fiscal income data do not cover important components of capital income, even when tax evasion is not considered. Most importantly, the private shares of corporate undistributed profits (the private share of corporate disposable income or the private share of corporate retained earnings) are not included as fiscal income in Malaysia (nor in most other countries). It is important to correct for this because the extent to which private shareholders choose to accumulate wealth in the form of undistributed profits (as opposed to dividends and share buybacks) may vary over time and across countries (e.g., due to changing tax incentives), which might introduce bias into inequality statistics. For Malaysia, this is even more likely because compared to other countries, the private share of corporate retained earnings is extremely high (as a percent of national income). As shown in Figure 2.2, the private share of corporate retained earnings in Malaysia accounts for more than 20% of the national income, while for the US, China and France, it accounts for less than 5% of the national income. Given the substantial share of private corporate retained earnings, we
12 would significantly underestimate the inequality level by not taking it into account.
Figure 2.2
One way to estimate the distribution of the private share of corporate retained earnings is to capitalize income tax returns using micro-level tax data (see Piketty, Saez and Zucman, 2018). However, in practice, it is impossible to access such detailed data in most countries. One alternative is to first assume that the private share of corporate undistributed profits, 𝑌𝑑𝑡𝐶ℎ, follows the same distribution as wealth; then, assume the correlation between 𝑦𝑓 and 𝑌𝑑𝑡𝐶ℎ follows the family of Gumbel copulas with Gumbel parameter θ = 228 (based on estimates obtained in countries with adequate micro data, namely, the US and France; see Blanchet, Fournier and Piketty, 2017). Finally, generate the distribution series of pretax fiscal income 𝑦𝑝 by combining the distribution series of 𝑦𝑓 and 𝑌𝑑𝑡𝐶ℎ using generalized Pareto interpolation techniques.29
In the case of Malaysia, neither of these methods can be applied due to the lack of data: micro-level tax data are not available, and there are no regular national wealth surveys in Malaysia. Thus, in this paper, we estimate the distribution of the private share of corporate retained earnings based on the adjusted survey data. We proceed as follows:
1. We estimate the total share of private corporate retained earnings, 𝑌𝑑𝑡𝐶ℎ, based on information obtained from the national accounts of Malaysia. 𝑌𝑑𝑡𝐶ℎ accounted for 16% of national income in 2002 and decreased to 11% in 2014. We then attribute 𝑌𝑑𝑡𝐶ℎ to different ethnic groups based on the macro-level data on distribution of corporate equity among ethnic groups in Malaysia (See Malaysia Plans). 2. We assume that within each ethnic group, the distribution of property income (dividends, interests, and
rents) is the same as the corresponding distribution of the private share of corporate retained earnings.30
Based on this assumption, we simply create a new variable 𝑦𝑑𝑡𝐶ℎ using the adjusted survey data; this new variable is equal to the property income, and we upscale the level of each observation of 𝑦𝑑𝑡𝐶ℎ so that the total property income of each ethnic group matches the total share of private corporate retained earnings of each ethnic group.
3. Finally, to estimate pretax personal income (𝑦𝑝), we correct the private share of corporate retained earnings by simply adding 𝑦𝑑𝑡𝐶ℎ to pretax fiscal income (𝑦𝑓). We provide the corresponding computer code for applying this method in Data Appendix: DistributionSeries.
We need to stress that the simplified method based on the adjusted survey data used to estimate the distribution of the private share of corporate retained earnings is far from perfect. We would very much like to revise the
28 The Gumbel parameter θ = 1 corresponds with perfect independence, and θ = +∞ corresponds with perfect correlation. 29 For details on the Pareto interpolation techniques, please see Blanchet, Fournier and Piketty (2017) and Piketty, Yang, and
Zucman, 2019.
30 An alternative is to assume that the distribution of undistributed corporate profit follows the distribution of dividend income
instead of all property incomes. Because we do not have more detailed data, we are not able to tell which assumption is more reasonable. The only reason we choose to use property incomes is because the data are available; in our survey data, we have detailed property income by source only for 2002-2009; for 2012 and 2014, only the total property income of household is available in the survey data.
13 estimation when more data are available. However, based on the data that are available, our method is the most reasonable. First, our method is transparent, simple, and relies on only a few simple assumptions. One could easily make adjustments or revisions by changing the assumptions in our framework. Second, as mentioned above theoretically, one could access information that is related to the equity holdings of individuals through the following channels: 1) micro-level tax return data, 2) records held by the security trading administration, 3) wealth surveys, and 4) income surveys. In this research, we propose the first comparable benchmark for the distribution of corporate retained earnings in Malaysia using an income survey; the other three options are not available.31
Finally, we apply a proportional upgrade factor to transform the distribution of pretax personal income (𝑦𝑝) into the distribution of national income (𝑦). By construction, this has no impact on the share of income. The goal of this normalization is to ensure that total individual incomes add up to national income to make income levels comparable across countries.32
To summarize, our inequality series have two main advantages: they incorporate tax return data – which are critical for accurately capturing high earners – and they distribute 100% of Malaysia’s national income—which is key to making consistent comparisons of inequality.
However, we need to stress that our inequality estimations are still fragile because we do not have access to more detailed data; thus, the results presented in this paper should be interpreted with caution. To be more precise, there are three major constraints that might introduce bias to our current estimations.
A. Tax evasion
This problem is not specific to Malaysia. Using data from other countries, Alstadsæter, Johannesen and Zucman (2018a, b) show that tax evasion is likely to lead us to underestimate inequality. However, to fully understand how tax evasion affects the estimation of inequality in the specific Malaysia context, more research is needed. B. Distribution of undistributed corporate profit
Our estimations for the distribution of tax-exempt capital income (e.g., the private share of undistributed corporate profit) are constructed based on the distribution of property income from the adjusted survey data, which might lead us to underestimate the top distribution.
31 We are fully aware of the shortcomings of our method; due to the constraints of the survey, we might underestimate the
distribution of property income at the top. Thus, we compare the total amount of property income in the adjusted survey data to its corresponding part in the national accounts. (To be consistent with the definition of property income in the survey, here, we exclude property income attributed to insurance policyholders from household property income in the national accounts.) In the national accounts, the property income of households (source) accounted for 2.8% of the national income in 2002 and decrease to 0.9% in 2014, while its corresponding part in the adjusted survey data is slightly higher and increases from 1.5% in 2002 to 3.7% in 2014. It is very difficult for us to tell which source is more accurate for the estimation of the total amount of household property income. We suspect that the national accounts might underestimate the distributed income of corporations, especially in 2014, since it might not be aggregated based on micro level data.
32 Note that 𝑦 − 𝑦
𝑝= 𝑦𝑝𝑢𝑏+ 𝑦𝑓𝑛 equals pretax public income plus net foreign current transfers plus the foreign share of
corporate retained earnings. We have no reason to allocate 𝑦𝑝𝑢𝑏 and 𝑦𝑓𝑛 in a nonproportional manner, so we adopt this
14 The ideal way to solve this problem is to estimate the undistributed corporate profit for each individual based on each company’s (listed or unlisted) profit sheet, shareholder information and the micro tax return data of tax payers. However, such detailed data are not available in most countries. Even when the data are available, the fact that companies’ shares are often held by other companies will cause the calculation to be even more complicated and less accurate. A few existing studies, such as Fairfield and Jorratt De Luis (2015), use this method to analyze the distribution of corporate retained earnings in Chile for the period 2005 to 2009.
However, in this research, due to a lack of data, we take a shortcut by first estimating the private share of corporate retained earnings for each ethnic group based on their share of corporate ownership and then distributing the retained earnings to each ethnic group based on the distribution function of property incomes (dividends, interests, and rents). By doing so, we assume that the distribution of corporate retained earnings follows the same distribution function as property income, which is often not the case. For example, if corporate retained earnings are more concentrated at the top than property incomes, which is often the case, then we might underestimate the level of inequality in Malaysia.
We present the first comparable benchmark for the distribution of corporate retained earnings in Malaysia; however, we admit that further studies based on more detailed micro-level data, such as data on property income and data from wealth surveys, are needed to fully understand the distribution of equity and tax-exempt capital income in Malaysia.
C. Malaysian-owned corporate retained earnings abroad
One topic that has not been investigated in either the DINA (Alvaredo et al., 2016) guidelines or the related literature is domestic-owned corporate retained earnings abroad. Unsurprisingly, this is due to the constraints of the existing data. For example, to estimate the total amount of Malaysian-owned corporate retained earnings abroad, one must first estimate the total corporate retained earnings for each host country of Malaysian investments and then the share of corporate equity owned by Malaysians in the total equity in the host country. However, in many countries, neither of these statistics can be estimated based on existing publicly accessible data.
As difficult as it is to estimate domestic-owned corporate retained earnings abroad, this topic is crucial for evaluating the evolution of income inequality in Malaysia, especially income inequality by ethnic groups. From 2002 to 2016, the stock of Malaysia’s outward foreign direct investment (FDI) increased from 18% to 67% of the national income. If we include portfolio investments, total stocks increase from 20% to almost 100% of national income. With such a large amount of outward foreign investment, domestic-owned corporate retained earnings abroad would be too significant to neglect.
Disregarding corporate retained earnings abroad will affect our estimation in two possible ways: 1) it will underestimate the share of the top income at the national level, especially for recent years; and 2) if these retained earnings are over-distributed to the Chinese and under-distributed to the Bumiputera or Indians, then it will underestimate the Chinese share of income in the top income groups.
As stated, our estimations are based on currently available data and methods. Although the process is imperfect, we would like for this research to be the first step of constructing a Distributional National Account for social
15 and political analyses in Malaysia. We would be happy to calculate more precise inequality estimates for Malaysia by addressing the issues mentioned above when new data are available or new methods are developed.
III.
E
VOLUTION OFI
NCOMEI
NEQUALITY INM
ALAYSIAIn this section, we present our main results on the evolution of income inequality in Malaysia from 1984 to 2014.
3.1 The Distribution Series of Survey Income, Pretax Fiscal Income and Pretax National
Income
In this section, we present three distribution series, namely, pretax survey income, pretax fiscal income and pretax national income. Due to the lack of a detailed national account (a detailed Malaysia national account has only been published since 2000), we are able to produce the pretax national income series only for the period after 2002. In this paper, we use the pretax national income series as our benchmark series. However, we provide data on the different income series for the share of income and the growth rates in the Data Appendix: IncomeDistribution_Malaysia.
As shown in Figure 2.1, we correct the top income shares sharply upward by applying the fiscal data to the survey. Then, we further correct the estimation by taking corporate undistributed profits into account and generate the pretax national income distribution series. In 2014, for instance, the top 1% income share is 8% in the raw survey data, reaches 13% after factoring in the fiscal data and then reaches 15% after factoring in the undistributed profits.
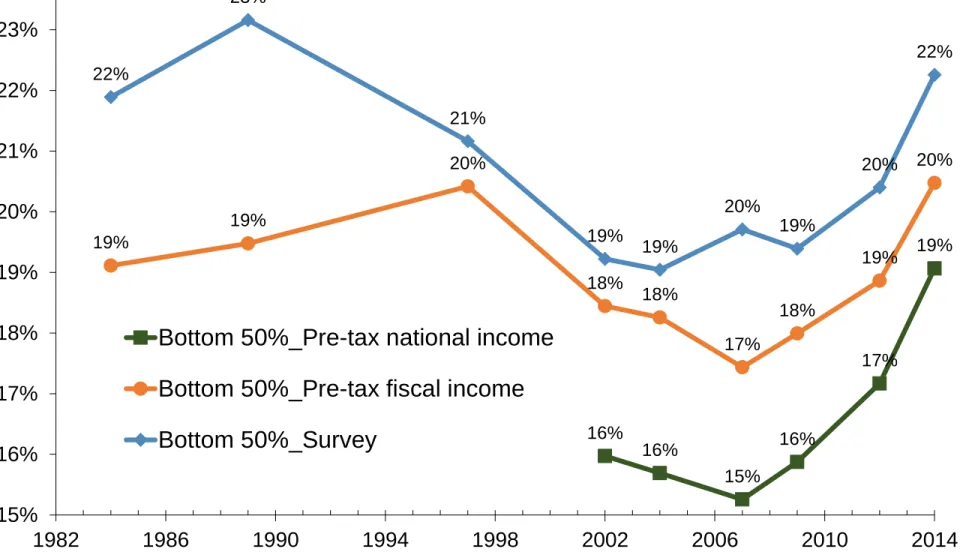
The official survey-based estimates between 1984 and 2014 show a relatively stable inequality trend with a very gradual decrease in Malaysia; e.g., the top 1% income share decreases from 9% to 8%; the bottom 50% income share was 22% in 1984, but after fluctuating up and down in the 1980s and 1990s, it ends at 22% in 2014. In addition, there was a slight decrease in the top 10% income share and a slight increase in the middle 40% income share.
The pretax fiscal income series had a trend that was very similar to the estimates using the raw survey data, except for the jump in 2007 due to the global financial crisis, for which the effects on income distribution were well captured by the fiscal data but not the survey data.
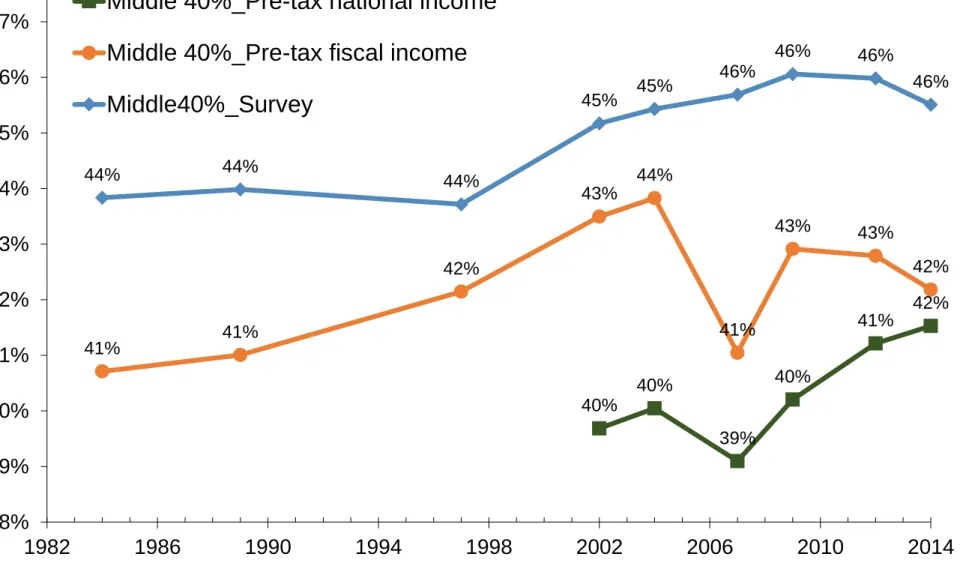
The most amazing picture of the evolution of Malaysia’s inequality is shown in the pretax national income distribution series, i.e., the reduction in inequality after 2000. The top 1% income share decreased from 19% to 15% from 2002 to 2014, while the bottom 50% income share increased from 16% to 19%. Similar contrasting trends can also be seen in the top 10% and middle 40% (see Figure 3.1, Figure 3.2, and Figure 3.3). The decrease in Malaysia’s inequality is mainly associated with the structural change of the economy, in particular, the rise of the traditional service sector (the wholesale and retail trade, accommodation, and food and beverage industries), as well as the affirmative action policies and practices that improve the socio-economic situation of the poorer households, in particular the Bumiputera.. We will discuss this topic more in the following sections.
16 we consider as our benchmark series.
Figure 3.1 Figure 3.2 Figure 3.3
3.2 Comparing Malaysia with Other Countries
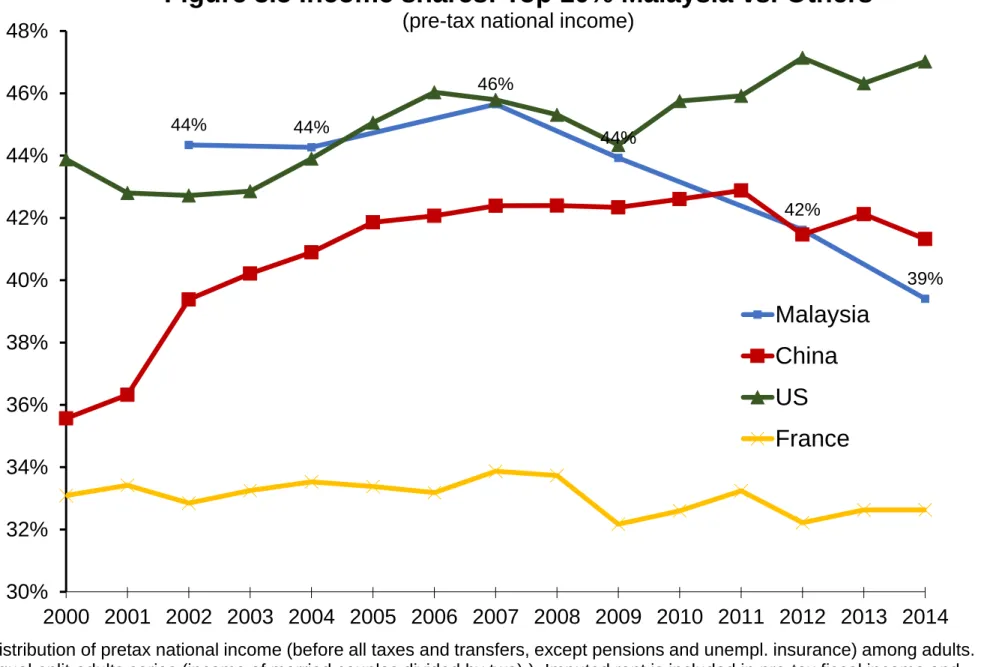
Figures 3.4 and Figure 3.5 compare our Malaysian income inequality series with the series recently computed for the US by Piketty, Saez and Zucman (2018), for France by Garbinti, Goupille and Piketty (2018) and for China by Piketty, Yang and Zucman (2019). These series use the same methodology as the one applied in this paper: they all attempt to combine information obtained from national accounts, surveys, and fiscal data to estimate the distribution of pretax national income (including undistributed profits and other tax-exempt capital income) among equal-split adults.
Figure 3.4 Figure 3.5
In 2002, Malaysia’s inequality level was extremely high: its top 1% income share was 19% and the corresponding number for the top 10% was 44%, which is higher than those of the US and substantially higher than those of China. However, while we observe a trend of increasing inequality after 2002 in the US and China, Malaysia’s inequality has been decreasing. By 2014, we see that income inequality in Malaysia is much lower than it is in the US and similar to the level in China, but still significantly higher than the level in France. As shown in Figure 3.4, while the top 1% income share declined from 19% to 15% in Malaysia between 2002 and 2014, it increased from 17% to 20% in the US, increased only moderately in China from 13% to 14% and stabilized in France at 11%.
Our new series for the distribution of pretax national income allow us to decompose growth by income group in a way that is fully consistent with aggregate growth. Thus, we can quantitatively assess the extent to which the various groups of the population have benefited from the enormous economic growth in Malaysia.
Table 3.1 compares the distribution of 2002–2014 real income growth in Malaysia, the US, China and France. Aggregate growth has obviously been different in the four countries. As emerging economies, both Malaysia and China have experienced exceptional growth, especially China. The average per adult national income has increased by 55% in Malaysia (corresponding to an average annual increase of 3.7%) and almost tripled in China, while it has increased by 9% in the US and 3% in France for the same period.
Table 3.1
Despite the significant economic upswing, Malaysia’s growth is featured by its strong inclusiveness. From 2002 to 2014, the growth rate accruing to the bottom 50% has been significantly larger than it accruing to the top 10% (which is much larger than that accruing to the top 1%), which is in stark contrast with the growth rate in China and the US. In the US, for the same period, total growth accruing to the bottom 50% is -7% compared to 29% to
17 the top 1%. The result for France is similar to the result for Malaysia; e.g., the income per adult in the bottom 50% is growing faster than that of the top (the top 1% and the top 10%). However, the average real income per adult growth rate is much lower in France than in Malaysia for the study period; e.g., the total cumulated growth is 0.2% in France and 3.7% in Malaysia. Figure 3.6 illustrates this difference using the average real income per adult growth rate.
Figure 3.6
The purpose of comparing the growth and the inclusiveness of growth among nations, regardless of the differences in their stage of development, institutions, and cultures, is to build a broad picture of possible outcomes of development paths taken by considering different nations. Eventually, we hope to shed light on how growth and equity can be reconciled and to encourage policymakers to consider appropriate policies in Malaysia and other countries. Our findings also illustrate the advantages of using the DINA. It is not sufficient to consider only macroeconomic growth: it is critical to be able to decompose growth across different social groups to be able to analyze which social groups benefit – or not – from this growth. In the following sections, we apply a similar decomposition by ethnicity and income groups in Malaysia to address the key question raised in this paper: Who benefits the most from the economic growth of Malaysia?
IV.
E
VOLUTION OFI
NCOMEI
NEQUALITY BYE
THNICG
ROUPS INM
ALAYSIATo obtain a full picture of the evolution of income inequality by ethnic groups in Malaysia, in this section, we decompose three dimensions of the ethnicity and income groups: the population share, income share, and income growth.
4.1 Decomposition of the Population
In this section, we begin by estimating the share of the population that are Bumiputera, Chinese and Indians for different income groups, especially for the top 1% and the bottom 50% Malaysian adults. This will allow us to respond to important questions regarding racial disparity in Malaysia, which are often raised by the media and in public debates.
Figure 4.1 illustrates the population share of Bumiputera, Chinese, Indians, and other ethnic groups by percentiles of real income per adult for 2002. It is quite striking to see how the share of Chinese increases when approaching the top, contrasting with the sharp decrease in the share of Bumiputera. Of the total Malaysian adults in 2002, 61% are Bumiputera, 30% are Chinese, and 8% are Indians; however, in the top 1%, Bumiputera account for only 24%, Indians account for 3% and Chinese account for 72% (See Figure 4.3). Clearly, compared to Bumiputera and Indians, Chinese are over-represented. This gap was mitigated in 2014; however, the contrasting pattern persists: among the richest one percent of Malays, the share of Bumiputera increased to 33%, the share of Indians increased significantly to 6%, and the share of Chinese decreased to 60%. (See Figure 4.2 and 4.3).
Figure 4.1 Figure 4.2
18 Figure 4.3
To better observe the level and trend of how much Chinese are over-represented (Bumiputera and Indians are under-represented), we normalize the share of Chinese in the top 1% Malaysian adults with the share of Chinese in total Malaysian adults (this same treatment is used for Bumiputera and Indians). The results are shown in Figure 4.4. In 2002, 2.4% of the total Chinese population was located in the top 1% of Malaysian adults, compared to 0.3% of total Bumiputera and 0.4% of total Indians (the benchmark is 1%, meaning all cultures are equally represented). Compared to the Bumiputera and Indians, the Chinese are significantly over-represented. On the other hand, the normalized population rate for both Bumiputera and Chinese has been relatively stable since 2002: for the Bumiputera, it increased from 0.3% to 0.4%, while for the Chinese, it increased from 2.4% to 2.2%. Indians have improved their under-represented status significantly and have moved towards neutral status, e.g., 1%.
Figure 4.4
As important as it is to understand the unbalanced population distribution at the top, it is equally crucial to look into the lower income segment (e.g., the bottom 50% Malaysian adults), especially when policymakers and the general public evaluate affirmative policies. As Figure 4.5 shows, in 2002, in the bottom 50% of Malaysian adults, 73% were Bumiputera, 17% were Chinese, and 9% were Indians. Until 2014, the trends of the three ethnic groups were very stable. Thus, while pro-Bumiputera policies has improved the economic status of low income Bumiputera, the fact remains that majority of those in the bottom 50% are still the Bumiputera. This segment of the population is made up of non-Bumiputera Malaysians approximately 29% of total Chinese and 56% total Indians (see Figure 4.6).
Figure 4.5 Figure 4.6
The corresponding decomposition of the share of population for the top 10% Malaysian adults is very similar to that of the top 1%, while the decomposition for the middle 40% is very similar to that of the bottom 50%. We conduct the same exercise using pretax fiscal income, and the results are similar. For the complete estimation results, please see the online Appendix, Figure B1.1-B3.3b.
4.2 Decomposition of Income
In this section, we continue the analysis and decompose the income share (e.g., the top 1%, the top 10%, the middle 40% and the bottom 50%) by ethnic groups. As stated in the previous section, Malaysia’s growth in the study period was featured by its strong inclusiveness. All groups and ethnics groups benefited, with the lower income group enjoyed higher income growth compared to the middle class and upper class. More precisely, from 2002 to 2014, the top 1% income share decreased from 19% to 15%, while the bottom 50% income share increased from 16% to 19%.
We now further decompose the top 1% income share by ethnic groups. As shown in Figure 4.7, the decline in the top 1% share is dominated by two trends: a strong decrease in the share of Chinese and a significant increase in the share of Bumiputera. Among the top 1% of Malaysian adults, the income share of the Chinese decreased
19 by almost half, from 15% in 2002 to 8% in 2013. The share of the Bumiputera doubled in the same period, increasing from 3% to 6%. The share of the Indians also increased significantly and more than doubled from 0.3% to 0.7 (however, in terms of the absolute level, the effect is minimal). The results for the top 10% of Malaysian adults are similar to those for the top 1% (see Figure 4.8).
Figure 4.7 Figure 4.8
Using the same procedure, we decompose the bottom 50% and the middle 40% income shares. The results for the bottom 50% and middle 40% are different from those of the top 1% and top 10%. The substantial expansion in the bottom 50% income share was solely driven by the increase in the share of Bumiputera, e.g., from 11% in 2002 to 14% 2014, while the share of Chinese and Indians stagnated at 3% and 2%, respectively (see Figure 4.9). For the middle 40%, the moderate increase of the income share can be decomposed to a steady increase in the share of Bumiputera (from 20% in 2002 to 24% in 2014) and a slight decrease in the share of Chinese (from 16% in 2002 to 15% in 2014; see Figure 4.10). In conclusion, the decrease in income inequality in Malaysia was mainly driven by two opposite trends: a sharp decrease in Chinese income shares in the top and a substantial increase in Bumiputera income shares in the top and bottom.
Figure 4.9 Figure 4.10
What drove the sharp decrease in the share of Chinese at the top and the increase in the share of Bumiputera at the top and the bottom? To answer this question, we further decompose the pretax personal income share for both Chinese and Bumiputera in the top 1% by income sources, e.g., wage income, self-employed income, property income, and transfer income. Since our benchmark is pretax national income series, property income here includes property income as defined in the HIS (e.g., interest, rents, dividends, royalties from copyrights, and imputed rents) as well as undistributed corporate profits, which accounted for more than 85% of the total property income of the top 1% of Malaysian adults.33
As shown in Figure 4.11, we see that, strikingly, the Chinese property income share declined from 9% of total pretax personal income in 2002 to 3% in 2014, which consequently reduced the share of the Chinese from 15% to 8%. On the other hand, the increase in the share of the Bumiputera is driven almost equally by the increase in wage income, self-employed income and property income (the income shares for each type of income source increased by 1% from 2002 to 2014; see Figure 4.12). We conduct the same exercise with the share of the Bumiputera in the bottom 50%, and the results show that approximately two-thirds of the increase in the Bumiputera share is driven by the increase in the Bumiputera wage income share (see Figure 4.13). The impact of transfer income on the trend of income shares is negligible, since its share in both the top 1% and the bottom 50% is almost zero. For the corresponding decomposition of pretax fiscal income, please see the online Appendix,
33 In 2002, undistributed corporate profits accounted for 96% of the total property income of the top 1% Malaysian adults, and
20 Figure C1.1-C1.5
Figure 4.11 Figure 4.12 Figure 4.13
4.3 Drivers of the Inequality Trend
What has caused the sharp decline in the Chinese property income share of the top 1% of Malaysian adults since 2002? Why did the Bumiputera’s income share of the top 1% increase instead of decreasing as with the Chinese? What were the fundamental causes for the decline in the top income shares in Malaysia? In this section, we will try to answer these questions.
In our analysis, two major events contribute simultaneously to the changing trend of the property income share, especially that of the top 1%:1) the capital income share has decreased in Malaysia since 2000; 2) the share of corporate ownership has changed among the different ethnic groups since 2000.
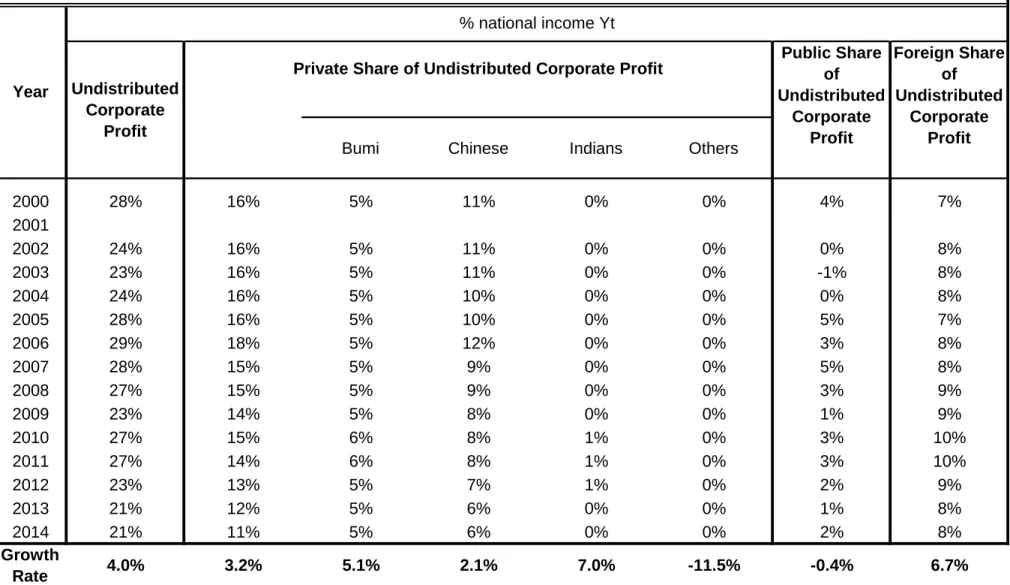
Since 2000, the corporate sector in Malaysia has seen capital income shares decrease; for example, they decreased from 68% to 58% in 2014, which is still quite high compared to those of China, France, and the US (see. Figure 4.14). The decrease in the capital income share in the private corporate sector was even more pronounced, decreasing from 66% in 2000 to 53% in 2014 (see Data Appendix: Malaysia A3.7). Allen Ng, Tan, & Tan (2017) systemically document this trend beginning with the middle of the 2000s. They argue that the increase in the labor income share (decline in capital income) is broad-based across all major economic sectors and is driven mainly by the growing importance of more traditional services subsectors (the wholesale and retail trade, accommodation, and food and beverage sectors), and small and medium sized enterprises (SMEs) in the economy (see. Figure 4.14). Due to the decrease in the capital income share, undistributed corporate profit (corporate savings, as a percentage of national income) also decreased from 28% in 2000 to 21% in 2014 (see Table 4.1).34 Meanwhile, since undistributed corporate profit is mainly held by the top income groups, the
property income shares of the top 1% in Malaysia dropped from 11% of total pretax personal income in 2000 to 5% in 2014 (see. Figure 4.15).
Figure 4.14 Figure 4.15 Table 4.1
Further decompositions of undistributed corporate profit (as a share of national income) by institutional sectors and ethnic groups (see Table 4.1) show that both Bumiputera and foreign shares of undistributed corporate profit remained stable for the period 2000-2014, while the Chinese share experienced a dramatic decline, from 11% to
34 Undistributed corporate profit=net corporate operating surplus -net property income-corporate income tax-net other current
21 6%. This contrast was due to changes in corporate ownership among the Bumiputera, Chinese and foreign shareholders; e.g., from 2006 to 2011, the Chinese share of corporate ownership in Malaysia dropped from 47% to 32%, while the Bumiputera and foreign share experienced a significant increase.35 This change and the
abovementioned decrease in the property income share in the top 1% Malaysians explain why the Bumiputera’s property income share of the top 1% increased moderately instead of decreasing sharply as the Chinese share did.
What is the fundamental cause for the change in corporate ownership among the different ethnic groups, especially the Bumiputera and Chinese? Due to a lack of detailed micro data on corporate ownership, at the time being, we are not able to conduct systematic analyses to answer this question.
4.5 Decomposition of Growth
As we mentioned in section 3.2, this new series on the distribution of pretax national income allows us to quantitatively assess the extent to which the various groups of the population have benefited from the economic growth in Malaysia. In this section, we further decompose this growth by both income groups and ethnic groups, in a way that is fully consistent with aggregate growth.
Figure 4.16 presents the decomposition of the growth in pretax national income by income groups and ethnic groups. From 2002 to 2014, the trickle-down effect benefited the lower income group more than the extremely rich; 65% of the income growth was captured by the bottom 90%, with the balance accrued to the top 10%. The distribution by income class shows that the top 1% captured 10.8% of the growth in national income, among which 9% was captured by the Bumiputera, 0.08% by the Chinese, and 1% by Indians. This result is striking because in 2014, the Bumiputera accounted for approximately 33% of the top 1% Malaysians, while Chinese accounted for 60%, and Indians accounted for 6%. This is in contrast to the situation only a decade earlier when the Bumiputera and the Indian shares were lower at 24% and 3%, respectively, while the share for the Chinese was much higher at 72%. Thus, during the period 2002 to 2014, the distribution of growth in the top 1% was extremely skewed towards the Bumiputera followed by the Indians. Such an unproportional distribution of growth also expanded to the top 10% in a relatively moderate manner. Thirty-five percent of the growth in the national income accrued to the top 10%, among which the Bumiputera accounted for 18%, the Chinese accounted for 14%, and Indians accounted for 3%. The population shares of the different ethnic groups in the top 10% were Bumiputera: 44%, Chinese: 48%, and Indians: 7%. While more Bumiputera joined the elite 1% group, they were still under-represented compared to the Chinese, who continued to dominate the elite class.
During the same period, 43% of the growth accrued to the middle 40% and 22% accrued to the bottom 50%. Compared to the top 1% and top 10%, the growth that accrued to the middle 40% and the bottom 50% was almost equally distributed among the different ethnic groups.
Figure 4.16