HAL Id: hal-02865825
https://hal.univ-cotedazur.fr/hal-02865825
Submitted on 12 Jun 2020
HAL is a multi-disciplinary open access
archive for the deposit and dissemination of
sci-entific research documents, whether they are
pub-lished or not. The documents may come from
teaching and research institutions in France or
abroad, or from public or private research centers.
L’archive ouverte pluridisciplinaire HAL, est
destinée au dépôt et à la diffusion de documents
scientifiques de niveau recherche, publiés ou non,
émanant des établissements d’enseignement et de
recherche français ou étrangers, des laboratoires
publics ou privés.
municipalities
A. Racine, J Garbarino, K. Corrion, F D'arripe-Longueville, B.
Massiera, A Vuillemin
To cite this version:
A. Racine, J Garbarino, K. Corrion, F D'arripe-Longueville, B. Massiera, et al.. Perceptions
of barriers and levers of health- enhancing physical activity policies in mid- size French
municipal-ities. Health Research Policy and Systems, BioMed Central, 2020, �10.1186/s12961-020-00575-z�.
�hal-02865825�
R E S E A R C H
Open Access
Perceptions of barriers and levers of
health-enhancing physical activity policies in
mid-size French municipalities
A. Noël Racine, J. M. Garbarino, K. Corrion, F. D
’Arripe-Longueville, B. Massiera and A. Vuillemin
*Abstract
Background: Policy is one of the levers for initiating structural change to foster the promotion of health-enhancing physical activity (HEPA). To this end, policy-makers have to deal with complex ecosystems embedded in specific contexts. However, limited research has been conducted on this topic at the local level. The purpose of this study was to identify the perceived barriers and levers of HEPA policies according to department heads and elected officials across various sectors in mid-size French municipalities.
Methods: This study used a mixed method primarily based on an adaptation of the concept mapping approach. A list of statements completing the sentence:‘In a mid-size municipal context, to develop HEPA policies, it is
necessary to…’ was submitted to key informants of 17 mid-sized French cities. Key informants in each municipality first rated the importance of each statement without considering their local context; they then rated the feasibility of each statement given their local context. In both cases, they used a Likert scale ranging from 1 to 6.
Results: A total of 23 municipal department heads and 10 elected officials from the sport (n = 14), health (n = 10) and social (n = 9) sectors in 11 mid-size French cities participated in this study. A list of 84 statements, sorted into 16 categories, was rated by participants according to their importance (M = 4.52, SD = 0.86) and their feasibility (M = 3.77, SD = 0.74). Potential barriers to (n = 10) and levers of (n = 38) HEPA policy development were identified. These results varied according to the position and sector of the participants.
Conclusions: The results suggest that local contextual factors can affect the development of HEPA policies in mid-size French municipalities. The different perceptions of the potential levers and barriers according to sector might affect intersectoral collaboration. This study contributes by enhancing understanding of how local HEPA policies are developed in the French context.
Keywords: Health-enhancing physical activity, local policy, municipality, policy-making, concept mapping
© The Author(s). 2020 Open Access This article is licensed under a Creative Commons Attribution 4.0 International License, which permits use, sharing, adaptation, distribution and reproduction in any medium or format, as long as you give appropriate credit to the original author(s) and the source, provide a link to the Creative Commons licence, and indicate if changes were made. The images or other third party material in this article are included in the article's Creative Commons licence, unless indicated otherwise in a credit line to the material. If material is not included in the article's Creative Commons licence and your intended use is not permitted by statutory regulation or exceeds the permitted use, you will need to obtain permission directly from the copyright holder. To view a copy of this licence, visithttp://creativecommons.org/licenses/by/4.0/. The Creative Commons Public Domain Dedication waiver (http://creativecommons.org/publicdomain/zero/1.0/) applies to the data made available in this article, unless otherwise stated in a credit line to the data.
* Correspondence:anne.vuillemin@univ-cotedazur.fr
Université Côte d’Azur, LAMHESS, Nice, France
Noël Racine et al. Health Research Policy and Systems (2020) 18:62 https://doi.org/10.1186/s12961-020-00575-z
Background
Physical inactivity and sedentary behaviours are import-ant risk factors for chronic diseases [1]. These issues have thus become a preoccupation in the public health policy field [2]. Over the past several years, governments at international, national and local levels have been de-veloping policies to promote health-enhancing physical activity (HEPA) [3–6]. According to the literature, policy is one of the levers for initiating structural change to ad-dress the issues related to physical inactivity and seden-tary behaviours [7]. Policy can indeed influence many of the social, economic and physical health determinants [8, 9]. Influenced by these determinants, the environ-ments in which people live have a particularly strong in-fluence on their health behaviours [10], including physical activity [11, 12]. Yet, in order to have a signifi-cant influence on health behaviours, polices should be intersectoral, following the Health in All Policies ap-proach [13, 14]. This approach consists of taking health decisions across a range of policy areas outside the health sector and the local level is particularly important for this policy implementation [15–18]. In France, the decentralisation process has included the transfer of some of the legal and‘facultative’ competencies (optional according to the law) from the national government to local governments [19]. This has meant that local gov-ernments can use their competencies to act on many health determinants such as urban, environmental, so-cial, sport and health factors [4]. From these competen-cies, municipalities have the authority to influence the conditions and the environment where people live; it is a particularly suitable level to promote an active and healthy lifestyle [20, 21]. Studies on national HEPA pol-icies also highlighted the importance of the local level [22,23]. To this end, municipalities play a major role in implementing intersectoral policies for HEPA promotion [4]. However, implementing intersectoral policies can be difficult [18] as policy-makers from various sectors need to share a common language, vision and policy goals [18]. Involvement in intersectoral policies may be limited when policy-makers lack an understanding of the bene-fits of this approach and have different policy priorities based on their sector [18, 24]. Their perceptions of the importance of HEPA policies, especially when they come from different sectors, may be an indicator of their will-ingness to become involved [25,26]. Studies have shown that capturing the views of policy-makers and profes-sionals across multiple sectors therefore provides a dee-per understanding of the key factors that facilitate intersectoral collaborations and HEPA policy implemen-tation [27,28]. However, there is still a lack of local evi-dence on HEPA promotion to help governments in their policy decisions [29], whereas contextual variables might well have an important influence on local HEPA policy
development [30]. Thus, this study sought to (1) capture the perceptions about HEPA policy development from municipal department heads and elected officials in dif-ferent sectors and (2) identify the barriers and levers of HEPA policies according to the local context.
Methods
Participatory mixed method
This study was conducted following a participatory mixed method mainly based on an adaptation of the concept mapping approach (CMA) [31]. Based on quali-tative data and statistical analysis, CMA can be used to explore, capture and compare the perceptions of differ-ent types of stakeholders [32, 33], including the percep-tion of their barriers and facilitators about a specific topic [34, 35], which is in line with our concerns in this study. Moreover, CMA seems to be particularly promis-ing to develop evidence-based strategies in the public health policy field [36]. The CMA is a 6-step process de-scribed by Trochim [37]. Which involves the prepar-ation, the generation of statements, the structuring of statements, the representation of statements, the inter-pretation of maps and the utilisation of maps. However, this is not the only way to accomplish CMA. Some stud-ies have adapted the technique of CMA“to meet specia-lised needs and to accommodate external constraints” [38]. In this study, the characteristics and the constraints of the targeted participants impacted the design of this study and prompted researchers to adapt the technique of CMA. Thus, the following adapted four steps were used: (1) preparation, (2) generation of statements, (3) participant selection and statement rating, and (4) map-ping analysis. The Concept Systems Global Max© soft-ware [39] was used for the mapping analysis step.
Preparation
The preparation step involved defining the focus prompt sentence that could be formulated in an open-ended way. Researchers in the physical activity for health do-main (n = 6) formulated the following: ‘In a mid-size municipal context, to develop health-enhancing physical activity policies, it is necessary to…’.
The key terms of the focus prompt sentence, like ‘pol-icy’ and ‘physical activity’, were agreed upon and defined by the researchers. Policy was defined as “legislative or regulatory action taken by federal, state, city, or local governments, government agencies, or nongovernmental organizations. Policy includes formal and informal rules and design standards that may be explicit or implicit” [40]. Physical activity was defined as follows:“any bodily movement produced by skeletal muscles that requires en-ergy expenditure, it can include sport and any physical practice in daily living...” [41].
Generation of statements
In the CMA, the generation of statements step is usually completed by the same group of participants who then sort and rate these generated statements. In this study, researchers faced the challenge of involving policy-makers as participants (i.e. elected officials and depart-ment heads) with‘specific constraints’. This type of par-ticipant had a limited time available to participate in a study with several rounds. Managing the recruitment process can be difficult in CMA with certain types of participants [42]. Moreover, the number of participants may decrease throughout the CMA steps due to lack of availability, attrition or fatigue to several rounds of par-ticipation [43]. Considering this, a group of experts (n = 12) was constituted for the statement-generation step and sorted these statements into themed categories, whereas a group of policy-makers (n = 33) was recruited for the rating step to collect more quantitative data for the analysis. Thus, this strategy reduced the risk of los-ing participants throughout the process and increased the chances of collecting more quantitative data for analysis.
The generation of statements was based on the focus prompt sentence defined in the preparation step. The aim was to integrate scientific and practical knowledge in the generated statements. The group of experts in-cluded researchers in the physical activity for health do-main (n = 6), municipal department heads (n = 3) and elected officials (n = 3). Department heads and elected officials were selected by the research team from muni-cipalities strongly engaged in HEPA promotion. First, the researchers conducted a literature review to identify the key determinants and key factors for developing HEPA policies in a municipal context. PubMed, Web of Science, ScienceDirect and Google Scholar databases were used to search for the terms‘physical activity’, ‘pol-icy’, ‘local government’ and ‘municipality’ in English and French between 2007 and 2018. Following extraction of the relevant scientific literature on the topic, a first list of statements was generated by the researchers to complete the focus prompt sentence.
Based on their experiences, municipal department heads and elected officials generated a second list of statements. The first and second lists of statements were then merged to obtain a single list. From there, other brainstorming sessions (n = 4) were organised with the group of experts. During these sessions, the statements were classed in order to build categories of determi-nants. The statements and categories were added, de-leted or redefined until a final consensus was reached. Moreover, duplicate ideas were removed, and the word-ing of the statement elements was enhanced to improve clarity. After the brainstorming sessions, a final list of statements sorted into categories was generated. Thus,
the group of experts deliberately decided not to invite policy-makers to sort the statements into piles using Concept Systems Global© software. Instead, consensus was found through brainstorming sessions, the group of experts decided to sort statements into categories that would be understandable and relevant, and therefore easier to rate by the group of policy-makers. Sorting is usually used to measure, analyse and map the relation-ship as well as the perceived similarity between state-ments [31]. However, this was not the objective in this study.
Participant selection and statement rating Participant selection
Participants were selected from 17 mid-size municipal-ities (between 20,000 and 100,000 residents [44]) from the Alpes-Maritimes and Var counties in France. These two counties, in close proximity to the research team, were selected to facilitate data collection. Small munici-palities (under 20,000 inhabitants according INSEE [44]) have less resources to develop HEPA policies compared to mid-size municipalities. Thus, policy-makers might not have the same experience and perception to HEPA policy development. In these counties, there are only two big municipalities (over 100,000 inhabitants accord-ing INSEE [44]) with a different magnitude of resources compared with mid-size municipalities; thus, to ensure more homogeneous municipalities, the research team decided to select only mid-size municipalities. These municipalities were initially contacted by email, outlining the purpose of the study and how it would be con-ducted. Then, if necessary, a phone call or a face-to-face meeting was organised to provide more details on the research project. Municipalities’ volunteered to partici-pate in the project. Data on the characteristics of each municipality were collected from the regional health ob-servatory database [45], including number of inhabitants, median income per inhabitant, number of people af-fected by a chronic illness, average number of new people each year affected by a chronic illness and num-ber of written HEPA policies by sector. Then, depart-ment heads and elected officials from these municipalities who were involved in the sport, health and social sectors were invited to participate in the state-ment rating step. The aim of this participant selection was to have a range of perceptions about the factors re-lated to HEPA policy development from several sectors. No participant was selected from the group of experts.
Statement rating
An individual meeting was scheduled with each partici-pant in order to explain the aim of the study and state-ment rating instructions. Face-to-to face meetings increase the likelihood of participation from this type of
informant. A scientific review showed that compliance of the rating step in CMA seemed to be higher with face-to-face meetings compared to those using the web-based Concept Systems Global Max© software [43]. Par-ticipants were requested to complete paper-based sur-veys, including demographic information and expert-generated statements at their convenience. Collected participant demographic data included gender (man or woman), age (age category), physical activity level (a sin-gle question), training courses on physical activity and health (yes, no, or no but have knowledge), and number of written HEPA policies by sector. The participants were then asked to rate the importance and feasibility of each statement on a 6-point Likert scale. Studies on Likert scales have found that 4- to 7-point scales return the strongest reliability and validity [46,47]. The advan-tage of 6-point scales is to avoid a midpoint forcing the choice [48]. Therefore, the choice was made to use a 6-point scale for statement rating. The participants were first instructed to rate the importance of each statement, independent of their local context, from (1) ‘not at all important’ to (6) ‘extremely important’. They were then instructed to rate the feasibility of each statement with regard to their local context, on the scale from (1) ‘not at all feasible’ to (6) ‘extremely feasible’. Once com-pleted, paper-based surveys were sent to the first author. Data from these surveys were entered into the Concept Systems Global MAX©software for analysis.
Mapping analysis
Using Concept Systems Global MAX© software, data from the statement rating step were computed to gener-ate go-zone maps. Descriptive statistics on the import-ance and feasibility ratings were also calculated to create a go-zone map. Each point on the graph represented the mean rating value of each statement in terms of its im-portance and feasibility. The map was divided into four zones by the mean rating value of importance on the vertical axis and the mean rating value of feasibility on the horizontal axis. The upper right zone comprised the statements that were above the mean rating values of importance and feasibility; therefore, these statements were assumed to refer to potential levers. The upper left zone comprised those statements that were above the mean rating value of feasibility but below the mean rat-ing value of importance. The bottom right zone con-tained the statements that were above the mean rating value of importance but below the mean rating value of feasibility. These statements could thus be assumed to refer to potential barriers. The bottom left zone com-prised the statements that were below the mean rating values of importance and feasibility. The Concept Sys-tems Global Max© generates go-zone maps according to different scenarios. Go-zone maps were produced
according to the sector (i.e. sport, health or social) and the position (i.e. department head or elected official) of the participants. The same and different HEPA policy le-vers and barriers between the sectors and the partici-pants’ position were also identified.
Results
A total of 84 statements sorted into 16 categories were generated. The rating participation by the municipalities was 65% (11/17). Table 1 presents the characteristics of the municipalities included in this study.
The statements were rated by 33 key informants from 11 municipalities, including department heads (n = 23) and elected officials (n = 10). Key informants were from the sport (n = 14), health (n = 10) and social (n = 9) sec-tors. The demographic characteristics of the key infor-mants are presented in Table2.
Overall group results
From the statement ratings by all participants (overall group results), the mean importance score was 4.52 (SD = 0.86) and the mean feasibility score was 3.77 (SD = 0.74). Figure1maps the potential levers (n = 38) (upper right zone) and barriers (n = 10) (bottom right zone) of HEPA policy development through go-zone analysis. Other statements were mapped in the upper left zone (n =9) and bottom left zone (n = 27). Table3presents the top 10 statements identified as potential levers of and barriers to HEPA policy development. Table 4 presents the mean (M) and standard deviation (SD) of the rating of importance and feasibility by categories for overall group.
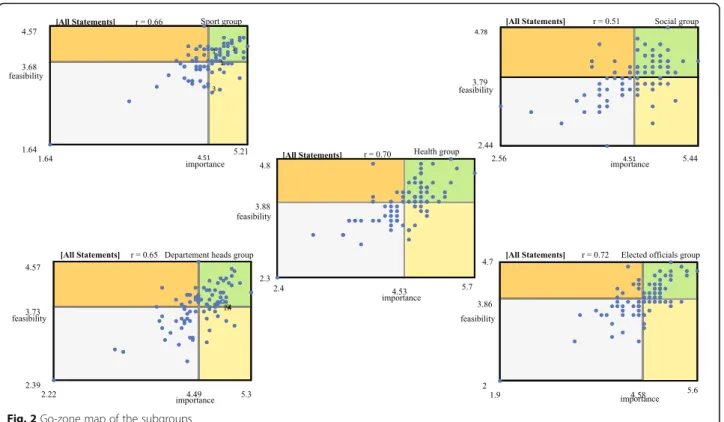
Subgroup results
In Table5, the mean ratings of importance and feasibil-ity are presented for the subgroups of sport, health, so-cial, department heads and elected officials. Figure 2 presents the perceptions of levers and barriers to HEPA policy development according to subgroup. The num-bers of potential levers and barriers were different ac-cording to the subgroup: sport (nlevers = 36, nbarriers =
17), health (nlevers= 40, nbarriers= 10), social (nlevers= 33,
nbarriers = 18), department heads (nlevers = 34, nbarriers =
10) and elected officials (nlevers= 32, nbarriers=18).
Additional file1shows the sector and position of each respondent for each statement identified as a potential lever or barrier. The same statements were identified as potential levers (n = 17) across the sport, health and so-cial groups, whereas no statement was unanimously rated as a potential barrier by these groups. When we considered the positions of respondents, the same state-ments were identified as potential levers (n = 21) and potential barriers (n = 4) by both department heads and elected officials.
Table 2 Demographic characteristics of the participants
Overall
n = 33 (%) Sportn = 14 (%) Healthn = 10 (%) Socialn = 9 (%) Department Headsn = 23 (%) Elected Officialsn = 10 (%) Sex Men 14 (42) 10 (71) 1 (10) 3 (34) 10 (43) 5 (50) Women 19 (58) 4 (29) 9 (90) 6 (66) 13 (57) 5 (50) Age categories <30 years 0 (0) 0 (0) 0 (0) 0 (0) 0 (0) 0 (0) 30–39 years 6 (18) 2 (14) 1 (10) 2 (22) 6 (26) 0 (0) 40–49 years 3 (10) 1 (7) 2 (20) 2 (22) 2 (9) 1 (10) 50–59 years 18 (54) 10 (65) 5 (50) 3 (34) 14 (61) 4 (40) 60–69 years 3 (9) 0 (0) 1 (10) 1 (11) 1 (4) 2 (20) ≥70 years 3 (9) 1 (7) 1 (10) 1 (11) 0 (0) 3 (30) Have participated in a physical activity or health training course
Yes 9 (28) 6 (44) 2 (20) 1 (11) 7 (30) 2 (20) No 12 (36) 4 (28) 2 (20) 6 (67) 9 (40) 3 (30) No, but have knowledge 12 (36) 4 (28) 6 (60) 2 (22) 7 (30) 5 (50) Physical activity practice
No 4 (12) 0 (0) 1 (10) 3 (34) 2 (9) 2 (20) Occasionally 11 (33) 4 (28) 4 (40) 4 (44) 7 (30) 4 (40) Regularly 11 (33) 7 (50) 3 (30) 1 (11) 9 (40) 2 (20) Often 4 (12) 2 (15) 2 (20) 0 (0) 4 (17) 0 (0) Very often 3 (10) 1 (7) 0 (0) 1 (11) 1 (4) 2 (20)
Table 1 Characteristics of the municipalities included
Municipality Inhabitants
(n)a Median income(€)b People affected by a chronicillness (n)c Additional chronicillness (n)d Number of written HEPA policiesby sector (n)
A 74.875 22.392 12,441 2039 Sport (n = 2), Health (n = 1), Social (n = 1) B 74.285 18.962 14,369 2237 Sport (n = 1), Health (n = 1), Environment (n = 1) C 64.903 18.656 11,305 1837 Sport (n = 1), Health (n = 1) D 50.937 20.704 7607 1230 None E 49.322 22.046 8012 1305 Sport (n = 1) F 41.571 20.010 7250 1102 None G 35.296 23.152 6913 1088 None H 28.919 22.858 4592 756 Sport (n = 2) I 25.047 20.940 4656 780 Sport (n = 1), Health (n = 1) J 23.347 21.778 3342 574 None H 22.360 22.666 4047 674 None
HEPA Health-Enhancing Physical Activity
a
Data from the National Institute of Statistics and Economic Studies - INSEE (2018) ;bData from INSEE (2018);cNumber of people affected by a chronic illness covered by governmental insurance for their healthcare expenditure. Data from the Regional Observatory of Provence-Alpes-Côte d’Azur (2018);d
Average number of additional people each year affected by a chronic illness covered by governmental insurance for their healthcare expenditure (from 2007 to 2014). Data from the Regional Observatory of Provence-Alpes-Côte d’Azur (2018)
Table 3 Top 10 statements identified as potential levers of and barriers to HEPA policy development
Categories Statements Mimportance(SD) Mfeasibility(SD)
Levers
Population targeted Target the community across the life course 5.39 (0.75) 4.15 (0.83) Action on community Develop communication strategies to inform, raise awareness
and promote HEPA
5.03 (0.73) 4.45 (0.61) Action on community Develop events to inform, raise awareness and promote HEPA 4.97 (0.73) 4.33 (0.64) Partnership Partner with the sport sector 4.94 (0.83) 4.15 (0.56) Human resources Training for human resource personnel 4.94 (0.79) 4.06 (0.66) Action on environment Develop public spaces 4.94 (0.70) 3.82 (0.63) Action on community Identify the needs of the community 4.91 (0.91) 3.88 (0.89) Practice targeted Act on the school environment 4.91 (0.68) 4.39 (0.90) Knowledge Have knowledge about the diversity of local stakeholders
that may be involved
4.91 (0.68) 4.21 (0.65) Knowledge Have knowledge based on field experience 4.88 (0.86) 4.21 (0.78) Barriers
Population targeted Target vulnerable people (health) 5.12 (0.74) 3.52 (0.75) Population targeted Target disadvantaged people (social) 4.85 (0.87) 3.73 (0.67) Action on environment Develop active transportation 4.79 (0.80) 3.55 (0.66) Knowledge Have local contexts knowledge 4.76 (0.61) 3.73 (0.83) Coordination Have coordination mainly ensured by transversal relations
between the departments
4.67 (1.19) 3.73 (0.80) Mandate Initiate actions beyond the duration of the mandate 4.67 (0.85) 3.76 (0.87) Practice targeted Act on active transportation 4.64 (0.82) 3.27 (0.63) Mandate Have policies consistent with those from other local governments 4.64 (0.89) 3.76 (0.65) Practice targetedEconomic model Act on the private sector
Have an economic model involving other public funding
4.58 (0.75) 4.58 (0.66)
3.03 (0.64) 3.76 (0.56)
Note: overall group data (n = 33)
HEPA Health-Enhancing Physical Activity, M mean
Additional file 2 presents the descriptive statistics for all statements and categories according to subgroup.
Discussion
This study captured perceived barriers and levers of HEPA policy development from elected officials and de-partment heads in the sport, health and social sectors of French municipalities.
All municipalities included in this study are considered mid-size in France (between 20,000 and 100,000 resi-dents [44]). While the size of municipalities was standar-dised to the selection, there is still an important size disparity between some of them, which could possibly influence the perception of policy-makers on HEPA pol-icy development. However, municipalities that have al-most the same number of residents could also be quite different due to environmental characteristics (e.g. pres-ence and accessibility of public spaces, parcs, walking and cycling paths, etc.) or the population (e.g. lifestyle, social inequalities, etc.). Thus, these characteristics could influence the perception of policy-makers to develop
policies. As the municipality is a complex ecosystem [49, 50], it is difficult to select a homogeneous sample. Fur-ther research should identify the main municipality characteristics that could influence HEPA policy development.
Some studies have also shown that the individual char-acteristics of policy-makers can influence their percep-tions regarding policies promoting HEPA, including their personal physical activity practice [51, 52]. In this study, most participants declared to occasionally or regularly practice some form of physical activity or to have knowledge or training in physical activity and health. However, a big gap remains between perception, priority and action. Policy-makers may engage in phys-ical activity or perceive its positive effects on health but not prioritise it, which limits the development of HEPA policy.
These findings helped to identify potential levers and barriers to policy development. Some of the potential le-vers, such as ‘target the community across the life course’ (statement 23) and ‘develop public spaces’ (state-ment 66), were in line with the HEPA recommendations of WHO [53,54]. Other statements, such as‘develop ac-tive transportation’ (statement 67) or promote HEPA for ‘vulnerable people’ (statement 27) and ‘socially disadvan-taged people’ (statement 28), were perceived as import-ant and in line with the WHO recommendations but were not considered feasible (potential barriers).
The barriers identified in this study seemed to be due to local factors. The findings showed a gap between what was rated as important for developing HEPA pol-icies when the local context was not considered and what was rated as feasible in the local context. Accord-ing to the literature, HEPA promotion should be adapted and embedded in context [2, 30]. Nevertheless, these results suggest that it is sometimes difficult to adapt HEPA policy-making to real contextual settings in a complex ecosystem like a municipality.
The finding of barriers suggests that municipalities need to be supported in their efforts to overcome them. More research in other contexts is needed to observe if these barriers are recurring and to better understand why they are not overcome. However, one difficulty is that barriers seem to differ according to the policy-maker’s sector and position, as shown by the results. Thus, we hypothesise that a framework standardising the collection of qualitative data on local HEPA policy development and analyses that takes into account the policy-makers’ characteristics would provide evidence on how best to support municipalities.
The levers for HEPA policy development also varied according to the sector and position of the policy-makers. However, concept mapping might be an inter-esting way for them to encourage and enhance
Table 4 Mean (M) and standard deviation (SD) of the rating of importance and feasibility by categories for overall group
Categories Mimportance(SD) Mfeasibility(SD)
Mandate 4.63 (0.03) 3.93 (0.04) Political commitment 4.31 (0.02) 3.72 (0.03) Governance 4.75 (0.01) 3.99 (0.02) Coordination 3.60 (0.73) 3.37 (0.48) Population targeted 5.11 (0.03) 4.01 (0.09) Practice targeted 4.71 (0.01) 3.70 (0.25) Expression of the community 4.43 (0.05) 4.05 (0.02) Knowledge 4.70 0.02) 4.09 (0.06) Human resources 4.29 (0.01) 3.35 (0.11) Expertise 4.46 (0.12) 3.70 (0.06) Economic model 4.10 (0.14) 3.44 (0.06) Action on community 4.60 (0.14) 3.91 (0.13) Action on environment 4.76 (0.03) 3.67 (0.05) Action on the organisation 4.70 (0.01) 3.89 (0.01) Partnership 4.67 (0.03) 3.87 (0.04) Evaluation 4.65 (0.03) 3.81 (0.04)
Table 5 Mean (M) and standard deviation (SD) of the rating of importance and feasibility for subgroups
Subgroups Mimportance(SD) Mfeasibility(SD)
Sport sector 4.53 (0.76) 3.88 (0.68) Health sector 4.45 (0.83) 3.68 (0.74) Social sector 4.51 (0.83) 3.79 (0.72) Department Head 4.49 (0.84) 3.73 (0.71) Elected Official 4.58 (0.88) 3.86 (0.78)
intersectoral collaborations inside and outside a given municipality, as recommended in the literature [13, 14, 16]. This approach can highlight a shared vision and the potential levers that are common to the various sectors. Yet, in order to make headway in adopting intersectoral policies, the policy-makers from these sectors need to share not only a vision and levers, but also a common language and policy goals [18]. Moreover, it may not be enough to involve key stakeholders from other sectors in HEPA promotion. Studies have highlighted that the awareness of HEPA importance by elected officials and department heads from various sectors determine their in-volvement in HEPA promotion [25,26]. Strong leadership and strong political advocacy might therefore help en-hance the development of intersectoral HEPA polices [53, 54]. The use of concept mapping by municipalities might also highlight the differing perceptions across sectors on the importance and feasibility of developing local HEPA policies. This would shed light on why sectors sometimes choose to work in‘silos’ rather than collaborate.
This study had some limitations. The research was re-stricted to France and the mid-size municipalities were from only two counties both in the southern region. Thus, the generalisability of these results is limited. Fur-thermore, it is highly likely that the municipalities that volunteered to participate in this study were more in-volved in HEPA promotion. Due to difficulties in recruiting policy-makers from municipalities to partici-pate in several steps of CMA, the methodology was
adapted. This could be considered a limitation. The brainstorming and rating steps were made by two differ-ent groups. The sample size of the expert group who generated and sorted statements was small. Some rele-vant statements might therefore have been missed in the list proposed by the expert group. Moreover, as state-ments were not sorted into categories using Concept Systems Global MAX©software, some statistical analysis could not be done. Policy-makers who participated in this study were only from three sectors, although many other sectors, such as the urban, environmental or edu-cational sectors, could be involved in HEPA promotion. Therefore, it was not possible to analyse every position in every sector. Similarly, it was not possible to analyse the perceived barriers and levers of HEPA policy accord-ing to the characteristics of municipalities. The state-ment ratings were based on perceptions and this as well might have biased the results due to social and political desirability [55]. In addition, the ratings might have been influenced by the participants’ personal physical activity levels, their knowledge about physical activity and health, or by the characteristics of their municipality. Last, some of the statements that emerged or did not emerge from the go-zone as potential levers or barriers might be explained by threshold effects.
Conclusions
This study contributes to a better understanding of the development of local HEPA policies. It does so by
capturing and analysing the perceptions of key infor-mants about local HEPA policy development in mid-size French municipalities. The findings revealed potential le-vers and barriers. According to the sector (sport, health, social) and the position (department heads, elected offi-cials), some of these potential levers and barriers were shared and others were informant specific. Although sector-related perceptions can affect intersectoral collab-oration, the use of concept mapping by the local govern-ment might counter this tendency and enhance collaboration. Findings also showed a gap between what the policy-makers deemed important to do to develop HEPA policies when local context was not considered and what they thought was feasible in their local context. The results indeed suggested that local context factors might affect the development of HEPA policies in mid-size French municipalities. Findings further suggested that municipalities need to be supported to overcome barriers and more easily develop HEPA policies in local contexts. To this end, collecting local HEPA policies from a large sample of municipalities using a standar-dised framework could help to compare and better understand these policies. Thus, analysing qualitative data such as the type and the content of a HEPA policy as well as the characteristics of the local context, would likely provide evidence to support municipalities in their policy-making. More research is now needed to extend the analysis of local HEPA policies in different local and country contexts.
Supplementary information
Supplementary information accompanies this paper athttps://doi.org/10. 1186/s12961-020-00575-z.
Additional file 1. Additional file 2.
Abbreviations
HEPA:Health-Enhancing Physical Activity; CMA: Concept Mapping Approach Acknowledgements
We would like to thank the department heads and elected officials who participated to this study. A sincere thank you to Stacey Johnson for her diligent proofreading of this paper.
Authors’ contributions
ANR collected, analysed, interpreted the data and was a major contributor in writing this manuscript. JMG and BM designed the work. KC and FAL have substantively revised the manuscript. AV administrated the project, designed the work and substantively revised the manuscript. All authors were involved in the generation statement phase of the concept mapping approach. All authors read and approved the final manuscript.
Funding
This work was supported by the Université Nice Sophia Antipolis (REACTIVES project) and by a PhD grant from the Région Sud and the association Azur Sport Santé.
Availability of data and materials
All data generated or analysed during this study are included in this published article and its supplementary information files.
Ethics approval and consent to participate
Ethical approval was obtained from the Université Côte d’Azur before starting the study under the reference: DPO-1588. All participants were in-formed of the purpose of the study, their roles as research participants and their rights to voluntary participation, anonymity and confidentiality of infor-mation. Written informed consent was obtained from all participants before data collection.
Consent for publication Not applicable.
Competing interests
The authors declare that they have no competing interests. Received: 8 November 2019 Accepted: 14 May 2020
References
1. Kohl HW, Craig CL, Lambert EV, Inoue S, Alkandari JR, Leetongin G, et al. The pandemic of physical inactivity: global action for public health. Lancet. 2012;380(9838):294–305.
2. Sallis JF, Bull F, Guthold R, Heath GW, Inoue S, Kelly P, et al. Progress in physical activity over the Olympic quadrennium. Lancet. 2016;388(10051): 1325–36.
3. Breda J, Jakovljevic J, Rathmes G, Mendes R, Fontaine O, Hollmann S, et al. Promoting health-enhancing physical activity in Europe: current state of surveillance, policy development and implementation. Health Policy. 2018; 122(5):519–27.
4. Wilkinson R. The Solid Facts - Promoting Physical Activity and Active Living in Urban Environments - The Role of Local Governments: World Health Organization; 2006.http://www.euro.who.int/en/publications/abstracts/ promoting-physical-activity-and-active-living-in-urban-environments.-the-role-of-local-governments.-the-solid-facts. Accessed 26 Mar 2020. 5. Daugbjerg SB, Kahlmeier S, Racioppi F, Martin-Diener E, Martin B, Oja P,
et al. Promotion of physical activity in the European region: content analysis of 27 national policy documents. J Phys Act Health. 2009;6(6):805–17. 6. Varela AR, Pratt M, Powell K, Lee I-M, Bauman A, Heath G, et al. Worldwide
surveillance, policy, and research on physical activity and health: the Global Observatory for Physical Activity. J Phys Act Health. 2017;14(9):701–9. 7. Golden SD, McLeroy KR, Green LW, Earp JAL, Lieberman LD. Upending the
social ecological model to guide health promotion efforts toward policy and environmental change. Health Educ Behav. 2015;42(1):8–14.
8. Blas E, Gilson L, Kelly MP, Labonté R, Lapitan J, Muntaner C, et al. Addressing social determinants of health inequities: what can the state and civil society do? Lancet. 2008;372(9650):1684–9.
9. Dean HD, Williams KM, Fenton KA. From theory to action: applying social determinants of health to public health practice. Public Health Rep. 2013; 128(3):1.
10. Marmot M, Wilkinson RG. Social Determinants of Health. Oxford: Oxford University Press; 2006.
11. Bauman AE, Reis RS, Sallis JF, Wells JC, Loos RJ, Martin BW. Correlates of physical activity: why are some people physically active and others not? Lancet. 2012;380(9838):258–71.
12. Giles-Corti B, Donovan RJ. The relative influence of individual, social and physical environment determinants of physical activity. Soc Sci Med. 2002; 54(12):1793–812.
13. Ollila E. Health in All Policies: from rhetoric to action. Scand J Public Health. 2011;39(6):11–8.
14. De Leeuw E, Clavier C. Healthy public in all policies. Health Promot Int. 2011;26(2):237–44.
15. Clavier C, De Leeuw E. Health Promotion and the Policy Process. Oxford: Oxford University Press; 2013.
16. Rudolph L, Caplan J. Health in All Policies: A Guide for State and Local Government. Public Health Institute. 2013;http://www.phi.org/resources/ ?resource=hiapguide. Accessed 26 Mar 2020.
17. Steenbakkers M, Jansen M, Maarse H, de Vries N. Challenging Health in All Policies, an action research study in Dutch municipalities. Health Policy. 2012;105(2–3):288–95.
18. Guglielmin M, Muntaner C, O’Campo P, Shankardass K. A scoping review of the implementation of health in all policies at the local level. Health Policy. 2018;122(3):284–92.
19. Halpern C, Hassenteufel P, Zittoun P. Policy analysis in France. Bristol: Bristol University Press; 2018.
20. De Leeuw E, Tsouros AD, Dyakova M, Green G. Healthy Cities, Promoting Health and Equity - Evidence for Local Policy and Practice: World Health Organisation Regional Office for Europe; 2014.http://www.euro.who.int/en/ publications/abstracts/healthy-cities.-promoting-health-and-equity-evidence- for-local-policy-and-practice.-summary-evaluation-of-phase-v-of-the-who-european-healthy-cities-network. Accessed 26 Mar 2020.
21. Takano T, Nakamura K. An analysis of health levels and various indicators of urban environments for healthy cities projects. J Epidemiol Community Health. 2001;55(4):263–70.
22. Prévot-Ledrich J, Van Hoye A, Lombrail P, Lecomte F, Vuillemin A. Panorama des politiques publiques françaises de promotion de l’activité physique bénéfique pour la santé. Sante Publique. 2016;1(HS):25–31.
23. Honta M. The State and management of partnership arrangements in France: an analysis of the implementation of the‘Sport, Health and Well-being’ plan. Int J Sport Policy. 2016;8(4):577–91.
24. Wang ML, Goins KV, Anatchkova M, Brownson RC, Evenson K, Maddock J, et al. Priorities of municipal policy makers in relation to physical activity and the built environment: a latent class analysis. J Public Health Manag Pract. 2016;22(3):221–30.
25. Brownson RC, Ballew P, Dieffenderfer B, Haire-Joshu D, Heath GW, Kreuter MW, et al. Evidence-based interventions to promote physical activity. Am J Prev Med. 2007;33(1):66–78.
26. Zwald ML, Eyler AA, Goins KV, Brownson RC, Schmid TL, Lemon SC. Understanding municipal officials’ involvement in transportation policies supportive of walking and bicycling. J Public Health Manag Pract. 2017; 23(4):348–55.
27. Cole R, Burke M, Leslie E, Donald M, Owen N. Perceptions of representatives of public, private, and community sector institutions of the barriers and enablers for physically active transport. Transp Policy. 2010;17(6):496–504. 28. Muellmann S, Steenbock B, De Cocker K, De Craemer M, Hayes C, O’Shea MP, et al. Views of policy makers and health promotion professionals on factors facilitating implementation and maintenance of interventions and policies promoting physical activity and healthy eating: results of the DEDIPAC project. BMC Public Health. 2017;17(1):932.
29. Bull F. Translating science to inform global policy on physical activity. J Sport Health Sci. 2018;7(1):3–4.
30. Reis RS, Salvo D, Ogilvie D, Lambert EV, Goenka S, Brownson RC. Scaling up physical activity interventions worldwide: stepping up to larger and smarter approaches to get people moving. Lancet. 2016;388(10051):1337–48. 31. Trochim W, Kane M. Concept mapping: an introduction to structured
conceptualization in health care. Int J Qual Health Care. 2005;17(3):187–91. 32. Lebel A, Cantinotti M, Pampalon R, Thériault M, Smith LA, Hamelin AM.
Concept mapping of diet and physical activity: uncovering local stakeholders perception in the Quebec City region. Soc Sci Med. 2011;72(3): 439–45.
33. Green AE, Fettes DL, Aarons GA. A concept mapping approach to guide and understand dissemination and implementation. J Behav Health Serv Res. 2012;39(4):362–73.
34. Weinstein LC, LaNoue M, Hurley K, Sifri R, Myers R. Using concept mapping to explore barriers and facilitators to breast cancer screening in formerly homeless women with serious mental illness. J Health Care Poor Underserved. 2015;26(3):908–25.
35. Ries AV, Voorhees CC, Gittelsohn J. Environmental barriers and facilitators of physical activity among urban African-American youth. V Children. Youth Environ. 2010;20(1):26–51.
36. Van Bon-Martens MJH, van de Goor LAM, Holsappel JC, Kuunders TJM, Van der Bruggen MAM, Brake JHM, et al. Concept mapping as a promising method to bring practice into science. Public Health. 2014;128(6):504–14. 37. Trochim WMK. An introduction to concept mapping for planning and
evaluation. Eval Program Plann. 1989;12(1):1–16.
38. Johnsen JA, Biegel DE, Shafran R. Concept mapping in mental health: uses and adaptations. Eval Program Plann. 2000;23(1):67–75.
39. Concept Systems Inc. Concept Systems GLobal MAX. 2020.https://www. conceptsystems.com/gw/software. Accessed 26 Mar 2020.
40. Schmid TL, Pratt M, Witmer L. A framework for physical activity policy research. J Phys Act Health. 2006;3(1):S20–9.
41. Caspersen CJ, Powell KE, Christenson GM. Physical activity, exercise, and physical fitness: definitions and distinctions for health-related research. Public Health Rep. 1985;100(2):126–31.
42. Cook K, Bergeron K. Using Group concept mapping to engage a hard-to-reach population in research: young adults with life-limiting conditions. Int J Qual Methods. 2019;18:160940691989131.
43. Rosas SR, Kane M. Quality and rigor of the concept mapping methodology: a pooled study analysis. Eval Program Plann. 2012;35(2):236–45.
44. INSEE. Villes et communes de France− Tableaux de l’économie française. INSEE. 2018.https://www.insee.fr/fr/statistiques/3303318?sommaire=33534 88. Accessed 26 Mar 2020.
45. Observatoire Régional de la Santé Provence-Alpes-Côte d’Azur. SIRSéPACA. 2019.http://www.sirsepaca.org. Accessed 26 Mar 2020.
46. Dillman D. Mail and Internet Surveys: The Tailored Design Method. 2nd Ed: Inc JW& S; 2007.
47. Dawes J. Do data characteristics change according to the number of scale points used? An Experiment using 5-point, 7-point and 10-point scales. Int J Mark Res. 2008;50(1):61–104.
48. Chyung SYY, Roberts K, Swanson I, Hankinson A. Evidence-Based Survey Design: The Use of a Midpoint on the Likert Scale. Perform Improv. 2017; 56(10):15–23.
49. Rydin Y, Bleahu A, Davies M, Dávila JD, Friel S, De Grandis G, et al. Shaping cities for health: Complexity and the planning of urban environments in the 21st century. Lancet. 2012;379(9831):2079–108.
50. Davies JK, Kelly M. Healthy cities: research and practice. London: Routledge; 2014.
51. Lemon SC, Goins KV, Schneider KL, Brownson RC, Valko CA, Evenson KR, et al. Municipal officials’ participation in built environment policy development in the United States. Am J Health Promot. 2015;30(1):42–9. 52. Zwald ML, Eyler A, Goins KV, Lemon SC. Multilevel analysis of municipal
officials’ participation in land use policies supportive of active living: city and individual factors. Am J Health Promot. 2016;30(4):287–90. 53. World Health Organization. More Active People for a Healthier World:
Global Action Plan on Physical Activity 2018–2030. 2018.https://www.who. int/ncds/prevention/physical-activity/global-action-plan-2018-2030/en/. Accessed 7 Nov 2019.
54. World Health Organization Regional Office for Europe. Physical Activity Strategy for the WHO European Region 2016–2025. 2016.http://www.euro. who.int/en/publications/abstracts/physical-activity-strategy-for-the-who-european-region-20162025. Accessed 7 Nov 2019.
55. Lavrankas P. Encyclopedia of Survey Research Methods. Thousand Oaks: SAGE Publications Ltd.; 2008.
Publisher’s Note
Springer Nature remains neutral with regard to jurisdictional claims in published maps and institutional affiliations.