HAL Id: hal-02623966
https://hal.inrae.fr/hal-02623966
Submitted on 26 May 2020
HAL is a multi-disciplinary open access
archive for the deposit and dissemination of
sci-entific research documents, whether they are
pub-lished or not. The documents may come from
teaching and research institutions in France or
abroad, or from public or private research centers.
L’archive ouverte pluridisciplinaire HAL, est
destinée au dépôt et à la diffusion de documents
scientifiques de niveau recherche, publiés ou non,
émanant des établissements d’enseignement et de
recherche français ou étrangers, des laboratoires
publics ou privés.
Distributed under a Creative Commons Attribution| 4.0 International License
To cite this version:
Qian Gao, Giulia Pratico, Augustin Scalbert, Guy Vergères, Marjukka Kolehmainen, et al.. A scheme
for a flexible classification of dietary and health biomarkers. Genes and Nutrition, BioMed Central,
2017, 12, �10.1186/s12263-017-0587-x�. �hal-02623966�
R E V I E W
Open Access
A scheme for a flexible classification of
dietary and health biomarkers
Qian Gao
1, Giulia Praticò
1,2, Augustin Scalbert
3, Guy Vergères
4, Marjukka Kolehmainen
5, Claudine Manach
6,
Lorraine Brennan
7, Lydia A. Afman
8, David S. Wishart
9, Cristina Andres-Lacueva
10,11, Mar Garcia-Aloy
10,11,
Hans Verhagen
12,13, Edith J. M. Feskens
8and Lars O. Dragsted
1*Abstract
Biomarkers are an efficient means to examine intakes or exposures and their biological effects and to assess system
susceptibility. Aided by novel profiling technologies, the biomarker research field is undergoing rapid development
and new putative biomarkers are continuously emerging in the scientific literature. However, the existing concepts
for classification of biomarkers in the dietary and health area may be ambiguous, leading to uncertainty about their
application. In order to better understand the potential of biomarkers and to communicate their use and application,
it is imperative to have a solid scheme for biomarker classification that will provide a well-defined ontology for the
field. In this manuscript, we provide an improved scheme for biomarker classification based on their intended use
rather than the technology or outcomes (six subclasses are suggested: food compound intake biomarkers (FCIBs),
food or food component intake biomarkers (FIBs), dietary pattern biomarkers (DPBs), food compound status biomarkers
(FCSBs), effect biomarkers, physiological or health state biomarkers). The application of this scheme is described in
detail for the dietary and health area and is compared with previous biomarker classification for this field of research.
Keywords: Biomarker, Classification, Nutrition, Ontology, Exposure, Effect, Susceptibility, Metabolomics, Review
Background
Biomarkers in general are objective measures used to
characterise the current condition of a biological system.
Many definitions exist, usually aimed at specific branch of
science, e.g. medical therapeutics or nutrition. For
in-stance, a working group under the US National Institutes
of Health defined biomarkers as
‘a characteristic that is
objectively measured and evaluated as an indicator of
nor-mal
biological
processes,
pathogenic
processes,
or
pharmacologic responses to a therapeutic intervention’.
On the other hand, authors in the nutrition field have
classified biomarkers as
‘a biochemical indicator of dietary
intake/nutritional status (recent or long term), or an index
of nutrient metabolism, or a marker of the biological
con-sequences of dietary intake’ [1, 2]. A consensus statement
from a Hohenheim conference on biomarker definitions
in nutrition resulted in a definition of biomarkers as
‘test
results related to exposure, susceptibility or biological
effect’ [3]. An important characteristic of any biological
system is that it is dynamic, involving life processes such
as nutrient input, waste excretion, growth, movement,
energy throughput, reproduction, annual cycles, aging,
etc. The dynamic nature of biological systems is also the
reason why objective characterization of the state of a
bio-logical system is needed. This is also a prerequisite for
un-derstanding how the system may respond, but also a
useful tool to decide on the need for intervention if the
system is moving into an undesired state such as disease.
Due to the large number of biomarker applications as
well as the diversity of biomarker characteristics, there
have been a number of published nutritionally relevant
biomarker classification schemes (Table 1) [3–8], each
using one specific characteristic of the biomarker as a
criterion. However, none of them creates a truly
univer-sal classification without considerable ambiguity. This is
because the same biomarker measurement, i.e. of a
nu-trient level, metabolite flux or other biological activity,
may unintentionally end up in several classes, depending
on their use in different studies.
* Correspondence:ldra@nexs.ku.dk
1Department of Nutrition, Exercise and Sports, University of Copenhagen,
Copenhagen, Denmark
Full list of author information is available at the end of the article
© The Author(s). 2017 Open Access This article is distributed under the terms of the Creative Commons Attribution 4.0 International License (http://creativecommons.org/licenses/by/4.0/), which permits unrestricted use, distribution, and reproduction in any medium, provided you give appropriate credit to the original author(s) and the source, provide a link to the Creative Commons license, and indicate if changes were made. The Creative Commons Public Domain Dedication waiver (http://creativecommons.org/publicdomain/zero/1.0/) applies to the data made available in this article, unless otherwise stated.
Serum Triglycerides (postprandial spikes)
Medium-term biomarkers Biomarkers that respond to
dietary intake over weeks or months
Red blood cell Essential fatty acid (average of the previous 120 days of intake of essential fatty acids)
Folate (average of the previous 120 days of intake of folate)
Long-term biomarkers Biomarkers that respond to
dietary intake over several months or years
Hair Toenail Trace element (long-term intake of
a trace element, e.g. Se) Relevant functional
outcomes
Markers of exposure to a food compound
Markers that are related to the exposure to the food compound being studied, such as a serum, fecal, breath, urine or tissue marker
Red blood cell Blood
Folate (exposure to folate in food) Tryptophan (exposure to tryptophan in food)
[5]
Markers of target function/ biological response
Markers that are related to the target function or biological response such as changes in body fluids, levels of a metabolite, protein or enzyme or changes in a given function Plasma Physical Reduction of homocysteine (response to dietary folate) Blood pressure (response to dietary caffeine)
Markers of intermediate endpoint
Markers that are related to an appropriate intermediate endpoint of an improved state of health and well-being or reduction of risk of disease, or both, such as the measurement of biological processes that relate directly to the endpoint
Physical Bone
Extent of narrowing of the carotid artery (cardiovascular disease) Mineral density (risk of bone fracture)
Association with intake Recovery biomarkers Biomarkers based on recovery
of certain food compounds directly related to intake and not subject to substantial inter-individual differences
Urine Urine Urine
Doubly labeled water (metabolic rate and total energy expenditure) Nitrogen (protein intake) Potassium and sodium
[6,8]
Predictive biomarkers Biomarkers that are sensitive,
time dependent and show a dose-response relationship with intake levels but their overall recovery is lower than recovery biomarkers
Urine 24-h sucrose and fructose (sugar
intake)
Concentration biomarkers Biomarkers whose concentrations do correlate with intakes of corresponding foods or nutrients but the strength of the correlation is often lower (< 0.6) than that expected for recovery biomarkers (> 0.8)
Serum Blood
Vitamins (vitamin intake) Lipids (lipid intake)
Replacement biomarkers Biomarkers that are closely
related to concentration biomarkers and refer specifically to compounds for which information in
Urine
Serum Urine
Aflatoxin
Isoflavonoids and lignans (phytoestrogen intake) Phytoestrogens (phytoestrogen intake)
To reach a classification scheme for biomarkers with
less ambiguity, it is necessary to understand the basic
conditions affecting any potential biomarker in a
bio-logical system. Any organism can be recognised as a
sys-tem that is constantly exposed to stimuli from both
external and internal environments. These systems are
therefore constantly influenced by a variety of factors
and these exposures result in biological responses,
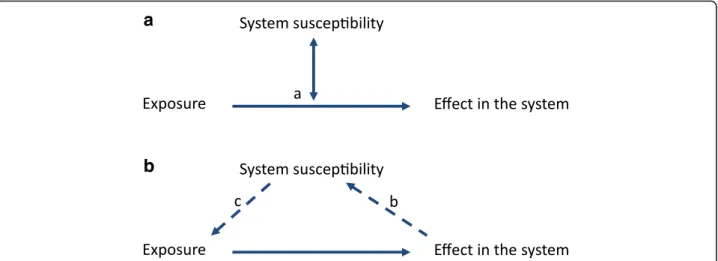
de-pending on system susceptibility (Fig. 1).
Biological systems are dynamic and biomarker
iden-tification or biomarker measurements are therefore
complicated by the intrinsic system’s response, which
is aimed at reverting the system to the pre-challenge
state (i.e. the host system response). If the system is
unable to adjust, permanent changes may ensue,
sometimes in an unpredictable way that may cause
injury or disease [9]. The parameters that can be
uti-lised to monitor and evaluate system states or
changes are recognised as biomarkers.
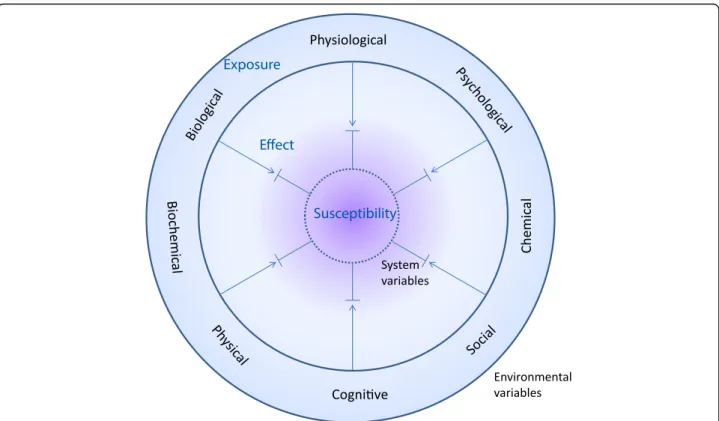
For human beings, as with most biological entities, there
are three important interactions to consider between the
individual and its environment: exposure, individual
sus-ceptibility and effect (Fig. 2). Exposures include physical,
chemical, biochemical, biological, physiological, cognitive,
psychological and social factors [10, 11]. They include
ex-ternal and visible factors such as foods, medicine and
smoking, as well as less tangible factors like physical or
psychological stress and societal inputs.
Susceptibility may be seen as an antonym to resilience
affecting the ability to re-balance following a response to
any of these exposures (Fig. 3). Individuals have static as
well as variable elements as part of their intrinsic
suscepti-bility or resilience. These are often termed as host factors.
The more static part of a biological system refers to
the susceptibility that people are born with or grow up
with, such as their genes, epigenetically encoded
gesta-tional factors, and often part of their cultural and social
background. Other parts of the epigenome, culture,
Table 1 Published biomarker classification schemes (Continued)
Criterion Classification Definition Examples References
Sample type Biomarker
food composition databases is unsatisfactory or unavailable
Biological endpoint Biomarker of exposure Accurately reflecting intake/
exposure Any biological specimen Plasma vitamin C [3] Biomarker of susceptibility
Accurately reflecting (an aspect of) susceptibility
Any biological specimen
Low plasma vitamin C (risk of scurvy); high serum cholesterol or blood pressure (susceptibility to myocardial infarction); low bone mineral density (susceptibility to fractures)
Biomarkers of effect and efficacy
An established biomarker of efficacy is an indicator of an improvement of a physiologic function or a decrease in risk factors for a disease (it follows that effect biomarkers would also include the corresponding null or negative outcomes)
Any biological specimen
Changes in: serum cholesterol; blood pressure; bone formation, resorption or density; prostate specific antigen
Purpose of the study Biomarkers of dietary
exposure
Biomarkers that are aimed at assessing dietary intake of different foods, nutrients, non-nutritive compounds or dietary patterns (recovery biomarkers, concentration biomarkers, recovery biomarkers and predictive biomarkers)
Urine Nitrogen (protein intake) [7]
Biomarkers of nutritional status
Biomarkers that reflect not only intake but also metabolism of the nutrient(s) and possibly effects from disease processes
Plasma Homocysteine (folate deficiency,
one-carbon metabolic processes)
Biomarkers of health/ disease
Biomarkers related to different intermediate phenotypes of a disease or even to the severity of the disease
Plasma Plasma
Total cholesterol (cardiovascular diseases)
Triglycerides (cardiovascular diseases)
social factors and also the microbiota may be classified
as semi-static since they may be changed to some extent
[12, 13]. The variable part of a biological system refers
to the consequence of exposures and cumulative effects,
such as nutrition, fitness, immunity to infection,
know-ledge and mental balance. All of these are factors
devel-oped throughout life that can be changed gradually
caused by impact or change of the environmental
vari-ables. Clearly, these static or variable factors also
mutu-ally interact to enhance or diminish their impact on the
system. This fact underlines the point that susceptibility
factors may not only act as modulators of exposures or
effects but they also act mutually on each other. This
further complicates the measurement of susceptibility.
Based on these interacting processes, any exposure
may or may not lead to a series of changes in the system
(e.g. in physical endurance, metabolism and intellectual
capacity) which could lead to either a faster or slower
aging processes or imbalances leading towards disease.
All of these processes result in a complex, highly
dynamic system, which is never in total balance.
Biomarkers could, in theory, capture the state of all the
on-going processes and changing balances, thereby
giving a full characterization of the current state of the
system, including health dynamics and disease risks. This
should be seen in contrast to the current international
consensus definition of health, which is more static. Under
these consensus views, health is typically defined as a
‘state’ rather than a dynamic balance in all aspects of life
[14]. Recent suggestions for a new
‘health’ definition
support a more dynamic and operational assessment. In
particular, health is now defined as an ability to cope with
challenges in various dimensions of life [15]. Concepts
re-lating to the measurement of health, i.e. biomarkers,
should therefore also follow similar dynamics.
Objectives of this review
There is widespread recognition that qualitative as well
as quantitative changes in food intake can strongly affect
the risk of diet-related disease. However, it is must also
be acknowledged that (1) our current instruments for
dietary assessment generate imprecise or even inaccurate
estimates of intakes [16–18], (2) the short-term as well
as the longer-term processes by which food components
affect health are not fully understood [19, 20] and (3)
in-dividual static and dynamic susceptibility factors are not
well described [21–23]. Therefore, it is necessary to
develop robust and well-validated biomarkers to support
the assessment of food intake and their effects at an
in-dividual level. The objective of this review is to provide
an improved scheme for the classification and
applica-tion of dietary and health biomarkers and to discuss the
implications of this scheme’s use compared with
previ-ous schemes.
Biomarkers for the dietary and health area
When it comes to dietary and health biomarkers,
envir-onmental exposure variables are often limited to the
diet, i.e. the nutrients and all the non-nutritive
compo-nents in foods. Non-nutritive compocompo-nents in this
context may be largely inert or may, in analogy with
established nutrients, affect health in a beneficial or
ad-verse manner. Dietary and health biomarkers are focused
on the measurement of these exposures and on
b
Fig. 1 Interactions between the environment and a biological system. The system can be any organism or group of inter-dependent organisms and the environmental exposure can be any changes of the environment. The image in a applies to the static part of susceptibility and in b applies to the variable part of susceptibility. (a) Basic relationship between exposures, effects in a biological system and the susceptibility factors characteristic of the system. Susceptibility is basically an effect modifier for how the exposure(s) affect the biological response. (b) The effect imposed upon the biological system may eventually change the system characteristics thereby changing its susceptibility. (c) The exposure of the system may also be directly affected by the system susceptibility factors themselves, e.g. if exposure is avoided or exacerbated (e.g. if the sensation of hunger is increased so food intake increases beyond needs)
quantifying the consequent biochemical, physiological,
cognitive and biological changes affecting the exposed
subjects. Many dietary intake biomarkers, at their
current state of development, may be viewed mainly as
validation tools for dietary assessment instruments (e.g.
24-h recalls, food diaries or food frequency
question-naires (FFQs) [24, 25]). In this sense, they may help to
confirm the
‘nutritype’ of an individual, i.e. dividing a
population into groups of common (typical) intake
pat-terns. However, with the development of metabolomics,
it is now possible to identify more food intake
bio-markers and to provide a deeper understanding of
meta-bolic dynamics. Dietary and health biomarkers may
become central tools to get a better understanding of
the association between diet, lifestyle or other
environ-mental variables with individual disease risk [6]. In this
case, dietary and health biomarkers may be defined as
objective measures or indicators of food intake, the
ef-fects of dietary intake on the body and the consequent
nutrition-related state of an individual or a group of
in-dividuals. Based on this definition, the dietary
assess-ment instruassess-ments as such are not considered as
biomarkers since they are not objective biological
mea-sures. However, these instruments are still the current
best practice to assess dietary intake and are therefore
used to support the discovery of potential dietary and
health biomarkers. In analogy with biomarkers for
clin-ical application, dietary and health biomarkers should be
measured in suitable sample types which could capture
the exposures or effects, and the kinetics of them should
be well established for application and interpretation.
Therefore, it is a prerequisite that the biomarkers meet a
sufficient level of validation so that both analytical and
biological
aspects
of
the
biomarker
measurement
methods are validated [26].
Classification of dietary and health biomarkers
In general, dietary and health biomarkers can be
subdi-vided into three major classes. These include exposure/
intake, effect, or susceptibility/host factors (Figs. 1 and 2),
as previously suggested by others [3].
a) Exposure and intake biomarkers reflect the level of
extrinsic variables that humans are exposed to, such
as diets and food compounds, including nutrients
and non-nutrients. They can usually be described in
terms of rates of intake and concentrations in biofluids
or tissues over a defined timeframe, e.g. for the single
compounds, their kinetic parameters such as
half-lives, total body burden or stores [
4
,
6
].
Fig. 2 Diversity of interaction between the biological system with intrinsic system variables and the surrounding environmental variables. Both exposures (environmental variables) and their corresponding host susceptibility factors (intrinsic variables) are diverse in nature and the steady state level of effect biomarkers (measured as changes in system variables) in a balanced health situation reflects environmental stress that does not overtly challenge the system susceptibility
b) Effect biomarkers refer to the functional response of
the human body to an exposure. They are defined in
terms of the time course of response until they reach
steady state or return to baseline levels. Effect
biomarkers often integrate several challenges to reflect
the effect of several extrinsic and intrinsic factors.
Typical examples include changes in satiation, plasma
glucose response and blood pressure [
5
].
c) Susceptibility or host factor biomarkers represent
the individual susceptibility or resilience to an
exposure predicting the intensity of its effect on the
individual. Susceptibility may be seen as the
‘background health status’, i.e. the sum of intrinsic
or
‘host’ factors explaining current individual
health-related risks. As already mentioned, they include
static as well as variable susceptibility factors [
3
].
It is readily recognised that these classes overlap, just
as with previous classifications. For instance,
measure-ments of plasma glucose could be classified in any of the
three classes, directly reflecting either a recent glucose
intake (exposure), the glucose kinetics response (effect)
or the ability to cope with a glucose challenge
(suscepti-bility). Whether the measurement of a biomarker is
classified into one class or another is, to a large extent,
based on the intended application of the measurements.
We would therefore like to define the three dietary and
health biomarker classes as
‘hyper-categories of applications’
that may be divided into several subclasses as shown
in Figs. 4 and 5 and in Table 2 below. These
bio-marker classes and subclasses share laboratory and
clinical methodologies and incorporate most of the
classes suggested in previously published
classifica-tions of dietary and health biomarkers.
Discussion
—dietary and health biomarker
subclasses
The dietary and health biomarker classes proposed in
Table 2 are meant to be a mutually exclusive list in
the sense that any application of a dietary and health
biomarker should be covered by only one of the
classes. The basic concept is that the biomarker
clas-sification is determined solely by the purpose of using
the biomarker and not by the assay as such. This is
detailed below with a range of examples. Although
the classification scheme builds upon an existing
scheme, the division by study purpose rather than by
assay methodology is conceptually novel for the
diet-and-health field while it has been used more often in
the clinical area; this classification provides a more
strict language for the dietary and health biomarker
area. Each biomarker class may be further subdivided
as explained below and shown in Fig. 4.
a1
b1
c1
a2
b2
c2
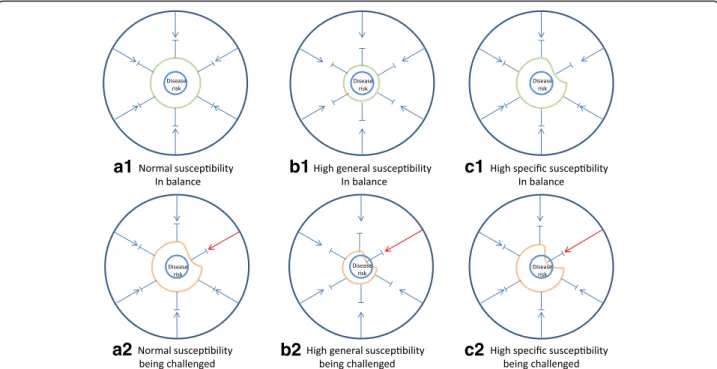
Fig. 3 Balance and stress in a biological system. Any biological system including human individuals may experience periods of balance (a1, b1 and c1) and periods of increased stress (a2, b2 and c2). Systems with different susceptibility have different risk of developing disease when exposed to the same stress. For a system with normal (moderate or low) susceptibility (a1), an increased stress may be tolerated (a2) making the system come closer to disease risk but without causing disease. For a system with high general susceptibility (b1) or specific susceptibility (c1), an increased environmental challenge may overstep the system tolerance leading to imbalance and heightened risk of disease (b2 and c2)
1) Food compound intake biomarkers (FCIBs): The
compounds in food may be nutrients or other
chemical entities, i.e. non-nutrients. Nutrient intake
biomarkers (NIBs) represent specific nutrient intakes
within a well-defined timeframe as previously
de-tailed by Potischman [4]. For instance, urinary
potas-sium could be used to assess the dietary potaspotas-sium
intake over a collection period of around 24 h [25].
Biomarkers of long-term exposures may also be
NIBs, for instance toenail selenium serves the
pur-pose of representing the long-term (0.5
–1 year)
in-take of selenium [27–29]. NIBs for long-term inin-takes
should not be confused with the use of the same
measurements to provide a status of current nutrient
adequacy (i.e. as NSBs, see subclass 4 below). The
NIBs typically fluctuate around an average reflecting
the median intake over a period defined by their
kinetics.
Another FCIB subcategory would be the
non-nutrient intake biomarkers, NoNIBs. NoNIBs may
be further subdivided by exposure timeframe in
analogy with the NIBs or according to their
anticipated impact. For instance, biomarkers of
zeaxanthin or resveratrol intake can be used to
represent putatively beneficial non-nutrients, and
biomarkers of lead, solanine or organophosphorous
pesticide intake can serve as indicators of specific
toxicants present in the diet. An ideal NoNIB has a
zero value when the compound has not been present
in the food or diet and increases significantly after
intake with well-characterised kinetics. Many polar
plant
‘secondary’ metabolites such as phenolics,
sim-ple terpenes and others follow this pattern [
30
].
Again, the NoNIB class should not be confused with
NoNSB (subclass 4 below) where measurements of
the same compounds are used to evaluate whether a
safety limit is reached.
2) Food or food component intake biomarkers (FIBs):
FIBs measure the intake of specific food groups,
foods or food components (such as ingredients) and
can be used to estimate recent or average intakes of
these entities. They could provide objective
assessment of dietary intake in nutrition research;
therefore, they might be a promising tool to qualify
or even substitute dietary assessment instruments.
The timeframe represented by a FIB depends on the
kinetics of the metabolite measured.
The FIB could be a single compound biomarker
(typically a NoNIB) or a combined biomarker. For
instance, proline betaine excretion could be used as a
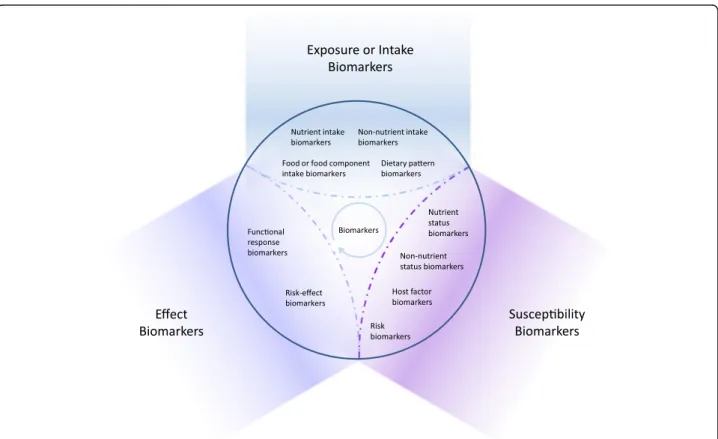
Fig. 4 Classification of dietary and health biomarkers within the space shaped by the three hyper-categories of biomarkers, exposure, susceptibility and effect. See text for further discussion of the proposed subclasses of biomarkers. The interpretation of the measurement of a biomarker depends on its intended use
biomarker of recent orange juice intake [
31
] or citrus
fruit consumption [
32
,
33
] and ethyl glucuronide in
blood or urine could serve as a biomarker of alcoholic
beverage consumption within the last 48 h [
34
–
36
].
More specific combined biomarkers have also been
proposed. For instance, tartrate together with ethyl
glucuronide could serve as a biomarker of red wine
consumption [
37
]; four different beer constituents
have been proposed as a multi-component biomarker
of beer intake [
38
]; and ratios of specific
alkylresorci-nols have been suggested as biomarkers of wheat or
rye fibers [
39
–
41
]. As seen from these examples, the
addition of two or more FCIBs to form a combined
FIB may be done in several ways (Table
3
). Specifically,
this may be done by including one of two or more
FCIBs, by summing up signals from one or more
simi-lar metabolites, by calculating ratios of two FCIBs or
by presenting a pattern of several FCIBs along with a
rule for how much of this pattern should be covered.
Whole food groups may be represented by several FIBs
such as a combination of several flavonoids for fruit
and vegetables [
42
] or by a single common
characteris-tic compound as exemplified by proline betaine (citrus
fruit) or ethyl glucuronide (alcoholic beverages).
FIBs will be the subject of a series of reviews to be
published in this current journal issue. Again, the
ideal food intake biomarker is zero when the food is
not ingested throughout a
‘wash-out’ period but is
measurable showing distinct dose- and
time-dependent responses after intake [
30
]. Those
re-sponses should, as far as possible, be independent of
individual host factors, e.g. differences in metabolic
or transport rates or in gut microbial functionality;
therefore, food compounds that are not metabolised
may be the most promising FIBs. Most of the FIBs
discussed here except ethyl glucuronide have not
been formally validated, and extra studies are needed
to improve the validity of them [
43
].
3) Dietary pattern biomarkers (DPBs): DPBs are a set
of FIBs and FCIBs that reflect the average diet of an
individual. They can be used to distinguish between
different dietary habits or to highlight the relative
adherence to a pre-defined diet such as
Mediterra-nean [
44
] or Nordic diets [
45
,
46
]. Typically, these
biomarkers represent a number of
‘signal’ foods and
nutrients that are more abundant in a certain diet,
e.g. biomarkers of olive oil, citrus fruits, greens, nuts
and fish along with alpha-linoleic acid and specific
polyphenol signalling Mediterranean-type diets. The
biomarkers of such
‘signal foods’ may also be used in
combinations to produce a score-like evaluation of
the consumption of the pattern. They usually overlap
Table
2
Pro
m
in
ent
feat
u
res
and
ty
p
ical
uses
o
f
the
proposed
subclasses
o
f
d
iet
ary
an
d
h
ealth
b
iomar
kers
(n
one
of
th
ese
classes
are
exclusive
in
terms
of
the
co
mp
o
u
n
ds
m
e
as
u
re
d
)
Prop osed classes Prop ose d subc lasses Prom inent feature s Typi cal uses Exposu re (intake ) biomark ers 1) Food com pound inta ke biomarkers (FCI Bs), divided into nut rient intake biomark ers (NIB s) and non-nut rient intake biom arkers (NoN IBs) a -Specificity to che mically we ll-defined food com pound s, e.g. nut rients or food -derived non-nutrien ts, such as bioactive compou nds, includ ing xenob iotic s -Distinctive dose-and time-de pende nt respo nses after intake -May reflect acute or lon g-term intakes Sp ecific intake biomark ers for food com pounds Inta ke biom arkers Exp osure biom arkers 2) Food or food compon ent intake biomark ers (FIBs) a -Specificity to part icular food s, food compon ents, or food groups -D istinct d ose-an d time-dependent responses after intake -A single meta bolite or a combi nation of metabo lites Comp liance biom arkers Mar kers of exp osure to food compone nts Biom arkers of diet ary expo sure Food intake biomark ers 3) Dietary pattern biom arkers (DPBs ) a -A set of FC IBs and FI Bs -Repre sentation of ‘sign al ’food s and nut rients in diets Nu tritype biomark ers Comp liance biom arkers Mar kers of exp osure to a dietary pattern Effect biom arkers 4) Effect biom arkers , divided into fun ctional respo nse biomark ers and ris k-eff ect biomark ers -Indicators of res ponse to a cert ain diet or die tary expo sure -May include shorter-term or lon ger-term eff ects Out come biom arkers Eff icacy biom arkers Im pact biom arkers Fu nctional res ponse biomark ers Mar kers of targ et function/ biological response Suscep tibility biom arkers 5) Food com pound st atus biom arkers (FCSB s), div ided into nut rient status biom arkers (NS Bs) and non-nutrien t status biomark ers (NoNSB s) -Reflect ion of statu s for food compou nds (nu trients and non-nutrie nts) -Nutri ent status biom arkers are mos t often reflec ting retained nut rients -Non-nu trient st atus biom arkers reflec t cumu lative intake of othe r food compo unds, typi cally with long excre tion half-li ves -Accu mulating xenob iotics may refle ct pot ential toxi city -Indicators of sus ceptibility to nutrien t o r xenob iotic stress Chro nic exposu re mar kers Biom arkers of nut ritional status or susc epti bility Biom arkers of non-nut rient statu s or susc eptibil ity Biom arkers of body bur den of toxi cants 6) Physi ological o r heal th state biom arkers, divided into host fact or biomarkers an d ris k biomarkers -Suscep tibility markers -Asses sment of hos t facto rs and disease ris k -Host fact ors may be seen as indi vidual variability -Hea lth status biomark ers refle ct cu rrent risk of dis ease or susc eptibilit y to d e velop disease. Risks may be inborn or acqui red -Potent ial or know n indicators of susc eptibilit y Diseas e ris k biomark ers Hea lth state biom arkers Risk biom arkers Ho st factors Indi vidual variability biomarkers Biom arkers of phe notypi c trait Biom arkers of heal th/disease aAll three classes are intake biomarkers but differ with respect to the complexity of what the marker represents in the dietto some extent with the foods and nutrients used to
define the diet indexes from questionnaire data, such
as the Healthy Eating Index HEI [
47
], or the
Mediter-ranean diet score MDS [
48
]. Since most people eat a
variety of foods in each meal but never eat all signal
foods at the same time, it is the pattern rather than
the single biomarkers that reflect the dietary signature.
Intake biomarkers are often used to assess the
rela-tionship between diet and health effects. It is often
dif-ficult to evaluate an isolated effect of a single nutrient
in a complex diet since there are interactions between
nutrients and other dietary factors. The DPBs may be
useful to assess the overall adherence to diets in
longer-term studies of their health effects.
To make good use of DPBs, 24-h urine samples
and repeated sampling are preferred to eliminate the
extraneous variability caused by variables such as the
timing of sample collection and within-person
vari-ation [
49
,
50
]. Three samples taken with several
months interval might be sufficient to reflect
long-term status [
51
], but the sample collection interval
might depend on various factors such as season and
the length of the study period [
49
]. For example, the
consumption of fruit and vegetables varies according
to seasons, which could lead to biased estimate of
the habitual intake of some nutrients such as vitamin
C [
52
]. In this case, sampling in every season might
be necessary to obtain a more precise estimate of
average diet.
4) Effect biomarkers are used to monitor changes in
biochemical, physiological or psychological state as a
response to nutritional exposures. These biomarkers
may be divided into (a) those only indirectly
associated with risk, i.e. most biomarkers related to a
functional physiological or metabolic response
(functional response biomarkers), and (b) those
directly related to risk, i.e. risk-effect biomarkers
de-scribing an effect on an established risk biomarker
(for risk biomarkers, see section 6b below). A
func-tional response is often taken to indicate a certain
mechanism of action while risk-related biomarkers
additionally have a recognised cause-and-effect
rela-tionship to disease.
a) Functional response biomarkers could be biomarkers
of enzyme induction, satiety, endurance, gene
expression, or an acute-phase inflammatory marker.
Some functional change biomarkers cannot readily
be interpreted. Great caution should be exercised
when biomarkers are used that have not been fully
validated for use as risk-related biomarkers.
Some-times, indicators of
‘effects’ with unknown biological
consequence have gained widespread use although
the measurements may actually be irrelevant with
Red wine Tartrate, ethyl glucuronide X (2/2) [37]
Sugar-sweetened beverages Formate, citrulline, taurine, isocitrate X (4/4) [87]
Wheat or rye fibers Ratios of specific alkylresorcinols
(C17:0/C21:0)
X [39–41]
Fruit and vegetables Ten flavonoids X [42]
Walnut Metabolites of fatty acid metabolism
(10-hydroxy-decene-4,6-diynoic acid sulfate; tridecadienoic/tridecynoic acid glucuronide), ellagitannin-derived microbial compounds (urolithin A glucuronide; urolithin A sulfate), and intermediate metabolites
of the tryptophan/serotonin pathway (3-indolecarboxylic acid glucuronide)
X (5/5) [88]
Coffee Atractyligenin glucuronide,
cyclo(isoleucylprolyl), 1-methylxanthine and trigonelline
X [89]
a
respect to disease risk. An example may be the
anti-oxidant capacity of plasma, which is easy to measure
and even reproducible but antioxidant capacity has
so far never been shown to be associated with
dis-ease risk or to have any other biological consequence
to humans [
53
–
55
]. In other cases, these biomarkers
are related to both exposure and effect. This is the
case for repair products resulting from adducts of
reactive compounds with macromolecules, e.g.
afla-toxin B1-deoxyguanosine adducts, sometimes
termed
‘markers of target dose’ to indicate an acute
response phase for these investigative biomarkers.
Some effect biomarkers have well-established
mech-anisms and risk correlates but are not causally
re-lated to risk. Plasma C-reactive protein (CRP), a
well-known acute-phase biomarker in inflammation,
is a good example of such a functional response
bio-marker. CRP has also been clearly associated with
stroke [
56
]. However, a dietary factor affecting CRP
may not be relevant for modulating the risk of stroke
since CRP is not on the causal pathway to ischemic
stroke [
57
].
b) Another group of effect biomarkers are those that
are also used as classical biomarkers of risk (see
section 6b), here termed risk-effect biomarkers. Used
as effect biomarkers, they include changes in, e.g.
lipoprotein ratios [
58
], blood pressure [
59
] or fasting
plasma glucose levels [
60
]. Only a dynamic change,
in these biomarkers, represents an effect, i.e. as a
re-sponse to a challenge, a dietary change, a medical
treatment, etc. This application of the measurements
are most often seen in intervention trials where the
focus is whether a certain treatment could
poten-tially affect a disease risk; in this capacity, the
risk-effect biomarkers are usually applied as surrogate
markers of the potential to alter a certain disease risk.
For example, the changes in total, LDL and HDL
chol-esterol could be used to evaluate the
hypocholestero-lemic effects of some bioactives, as in the case of
β-glucans [
61
] or even by whole food groups as in the
case of fruit and vegetables [
62
]. The changes in the
risk-effect biomarkers could also be used to evaluate
the potential effect on disease risk reduction by
fol-lowing certain dietary patterns. For instance, change
in blood pressure after intake of Mediterranean diets
during a 4-year period has been used to investigate
the potential mechanism for change in risk of
cardio-vascular disease [
63
]; also in a 6-month intervention
trial, the changes in fasting plasma glucose, fasting
serum insulin and HOMA-IR were measured to
esti-mate the effect of a defined Nordic diet on the risk of
diabetes [
64
]. These same measurements may also be
used to characterise a health status or risk in a more
static sense, e.g. as a baseline characteristic in a
nutrition trial and in this case belongs to biomarkers
of susceptibility (see 6b below).
5) Food compound status biomarkers (FCSBs)
represent the current body burden or status of
compounds from food. These compounds may be
nutrients that are actively absorbed and retained or
they may be non-nutrient compounds, including
toxicants, which are able to build up higher
concen-trations in the body because they are lipophilic or
otherwise difficult to clear from the body.
In the case of nutrient status biomarkers (NSBs),
they reveal the status of nutrients in humans, such
as a micronutrient sufficiency or deficiency. For
instance, ferritin could be used as a sensitive
indicator of iron stores [
65
,
66
]; serum cobalamin
levels can be used to detect vitamin B12 deficiency
[
67
] and red blood cell glutathione peroxidase can
be used to assess current selenium status [
29
,
68
,
69
]. The major difference between NIBs and NSBs is
their use; when a biomarker is applied for assessing
nutrient intakes, it is a NIB. When the same
biomarker measurement is used to assess current
nutritional status, it is a NSB. NSBs assess potential
vulnerability or healthiness, which is part of the
variable susceptibility that indicates closeness to
adequacy, deficiency or overload.
Likewise, in the case of non-nutrients, the
analo-gous NoNSBs represent the status of accumulating
non-nutrients (usually toxicants in the human body)
and therefore a cumulative exposure or risk. The
measurement of halogenated organics and heavy
metals themselves could serve as an indicator of their
accumulation in the body over time. For example,
cadmium can be accumulated in the kidneys,
reflect-ing not only long-term exposures but also
cadmium-related disease risk. Urinary cadmium therefore could
be used to assess the cumulative cadmium intake and
current body burden [
70
]. Since biomarkers of
toxi-cant body burden may be seen as analogous to NSBs,
they are susceptibility-related phenotypic biomarkers
as long as they are used to measure status in
compari-son with an intake limit or to evaluate ensuing health
risks. If the same compounds are measured to
esti-mate average long-term exposure, they would be
clas-sified as NoNIBs. Some hydrophobic non-nutrients
such as lutein and lycopene may also accumulate in
the body; lutein is not considered a nutrient and has
not so far been approved for health claims by EFSA
[
71
]. However, lutein in combination with certain
nu-trients has documented effects on age-related macular
degeneration following medical use [
72
] indicating
that lutein levels, particularly in the eye, may serve as
a NoNSB. Plasma lycopene has not yet been shown
host factor may be considered a personal intrinsic
quality or trait influencing susceptibility to disease—or
resilience. As described above, assessment of host
factors or risk sometimes use exactly the same
procedures or assays as those used for determining an
effect of an intervention. However, here they are used
as biomarkers to characterise the individual or a
group with respect to a functional characteristic or to
the susceptibility to develop disease. These biomarkers
represent therefore the variability between individuals
with respect to health as well as with respect to
disease risk. The classification of these biomarkers is
complicated by the fact that some physiological or
health state biomarkers are measured as a response to
a standard (dietary) challenge, e.g. the oral glucose
tolerance test (OGTT). The OGTT is therefore a
response measurement used to characterise an
individual
’s current health state or disease risk. In
analogy to the division of effect biomarkers into
biomarkers for a change in functional response and
biomarkers affecting risk, physiological or health state
biomarkers may also be subdivided into (a) host factor
biomarkers and (b) risk biomarkers.
a) Host factor biomarkers encompass a large number
of status biomarkers and cannot (yet) be used to
predict risk. Some are static, for instance, genotypes
represent one of the most static host factors of living
organisms. Obviously, it is only the known
functional gene variants (or haplotype markers) that
may be used as host factor biomarkers. Mutations
do occur but they are random while other host
factors may change over time in a predictable
manner as a functional response to exposures,
challenges or treatments as described for the effect
biomarkers above (section 4). This functional
response may actually change the susceptibility so
that a more adequate response to the challenge is
‘learned’, see Fig.
6
. Good examples of altered
susceptibility
‘learned’ by functional responses are
acquired immunity, exercise-improved fitness, and
acquired tolerance to poison by enzyme induction.
Host factors with an ability to be altered by
chal-lenges include nutritional, metabolic, epigenomic,
microbial, immunological and physiologic
pheno-types. These may form complex relationships with
ability of fast or slow metabolism of caffeine is not
directly predicting effects on sleep. Homozygotic
carriers of either allele may be equally affected in
their ability to sleep after a cup of coffee since this is
more strongly determined by a polymorphism in the
genes encoding the caffeine sensitivity of the
adeno-sine A2A receptor in the brain [
78
]. So the latter
polymorphism is the most important host factor
de-termining sleeping ability. The former may be more
important to predict the blood pressure response to
caffeine intake [
79
]. Both polymorphisms represent
(static) host factors but the latter may also be a risk
modulator related to myocardial infarction [
80
]. The
impact of these two host factors on risk is still
un-clear so they are not established risk biomarkers.
b) In contrast, risk biomarkers are normally used to
predict specific aspects of an individual’s disease risk
or development. They can be graded on a scale from
altered susceptibility to disease diagnostics or
prognostics. These susceptibility biomarkers are most
often measured in a cross-sectional or individual
set-ting. Specifically, they are used to characterise risk at
baseline in a population or they may be used
individu-ally using a sample collected at a medical practitioner
’s
office to determine whether a treatment should be
in-stituted or altered. Biomarkers like systolic blood
pres-sure, OGTT or fasting glucose levels in serum or
plasma are good examples of disease risk/diagnostic
biomarkers with clear international guidelines for how
to interpret readings from an individual and on how
and when to start treatment [
81
,
82
]. Other risk
bio-markers, such as low insulin sensitivity or age, also
have well-described relationships with risk of disease,
and combined risk scores including several
suscepti-bility biomarkers are issued by organizations such as
the American Heart Association [
83
]. Another more
complex and explorative example is a biomarker
predicting increased breast cancer risk composed of a
combination of questionnaires, metabolomics and
physiological measurements [
84
]. Such disease risk
patterns from combined data are putative risk
bio-markers but need rigorous validation.
Conclusion
The current pace of dietary and health biomarker
dis-covery and application is higher than ever before due to
the rapid development of
‘omics’ technologies and ‘big
data’ techniques. As a result, this area can be defined as
frontier research shaping the development of many
im-portant tools for future research in nutrition and health.
Several frameworks for naming and classifying
bio-markers exist. One of them is the common overall
div-ision into exposure, effect and susceptibility biomarkers.
However, this division has been previously described as
very static, resulting in a need for continuous updates
due to the rapid developments in technologies and
ap-plications. There is now an urgent need for the
classifi-cation of biomarkers to be far more flexible. This is
because the actual laboratory or clinical measurement
provided for any biomarker is not directly linked with its
use to measure exposure, effects or susceptibility. The
same assay procedure may be used for all of these
pur-poses, so we believe it is the intended use that best
de-termines the classification of a given biomarker. This
concept provides a much improved and far more flexible
classification scheme for dietary and health biomarkers
that nicely fits into the current complex scenario of
re-search in the nutrition and health area.
Acknowledgements Not applicable. Funding
FoodBAll is a project funded by the BioNH call (grant number 529051002) under the Joint Programming Initiative,‘A Healthy Diet for a Healthy Life’. The project is funded nationally by the respective Research Councils; the work was funded in part by a grant from the Danish Innovation Foundation (#4203-00002B) and a Semper Ardens grant from the Carlsberg Foundation to LOD; a grant from the China Scholarship Council (201506350127) to QG; a postdoc grant from the University of Rome La Sapienza (‘Borsa di studio per la frequenza di corsi o attività di perfezionamento all’estero’ erogata ai sensi della legge 398/89) to GP; the Swiss National Science Foundation (40HD40_160618) in the frame of the national research program‘Healthy nutrition and sustainable food protection’ (NRP69) to GV; a grant from Science Foundation Ireland (SFI 14/ JPI-HDHL/B3076) and ERC (647783) to LB; a grant from the Canadian Institutes of Health Research (CIHR) to DSW; a grant from the Spanish National Grants from the Ministry of Economy and Competitiveness (MINECO) (PCIN-2014-133-MINECO Spain), an award of 2014SGR1566 from the Generalitat de Catalunya’s Agency AGAUR, and fundings from CIBERFES (co-funded by the FEDER Program from EU)
to CAL; a grant from the Italian Ministry of Agriculture, Food and Forestry Policies (MiPAAF) within the JPI-HDHL (MIUR D.M. 115/2013) to HA.
Availability of data and materials Not applicable.
Authors’ contributions
This manuscript was drafted by LOD and QG. All other authors critically commented the manuscript. All authors read and approved the final manuscript.
Ethics approval and consent to participate Not applicable.
Consent for publication Not applicable.
Competing interests
The author Hans Verhagen is employed with the European Food Safety Authority (EFSA). However, the present article is published under the sole responsibility of Hans Verhagen and the positions and opinions presented in this article are those of the authors alone and are not intended to represent the views or scientific works of EFSA.
The other authors declare that they have no competing interests.
Publisher
’s Note
Springer Nature remains neutral with regard to jurisdictional claims in published maps and institutional affiliations.
Author details
1
Department of Nutrition, Exercise and Sports, University of Copenhagen,
Copenhagen, Denmark.2Department of Food Science, University of
Copenhagen, Copenhagen, Denmark.3Biomarkers Group, Nutrition and
Metabolism Section, International Agency for Research on Cancer (IARC),
Lyon, France.4Agroscope, Federal Office of Agriculture, Berne, Switzerland.
5University of Eastern Finland, Kuopio, Finland.6INRA, Human Nutrition Unit,
Université Clermont Auvergne, INRA, F63000 Clermont-Ferrand, France.7UCD
Institute of Food & Health, UCD School of Agriculture and Food Science,
University College Dublin, Dublin, Ireland.8Division of Human Nutrition,
Wageningen University & Research, Wageningen, The Netherlands.
9Department of Biological Sciences, University of Alberta, Edmonton, Canada.
10Biomarkers and Nutrimetabolomic Laboratory, Department of Nutrition,
Food Sciences and Gastronomy, University of Barcelona, Barcelona, Spain.
11CIBER de Fragilidad y Envejecimiento Saludable (CIBERFES), Instituto de
Salud Carlos III, Barcelona, Spain.12European Food Safety Authority (EFSA),
Parma, Italy.13University of Ulster, Coleraine, Northern Ireland, UK.
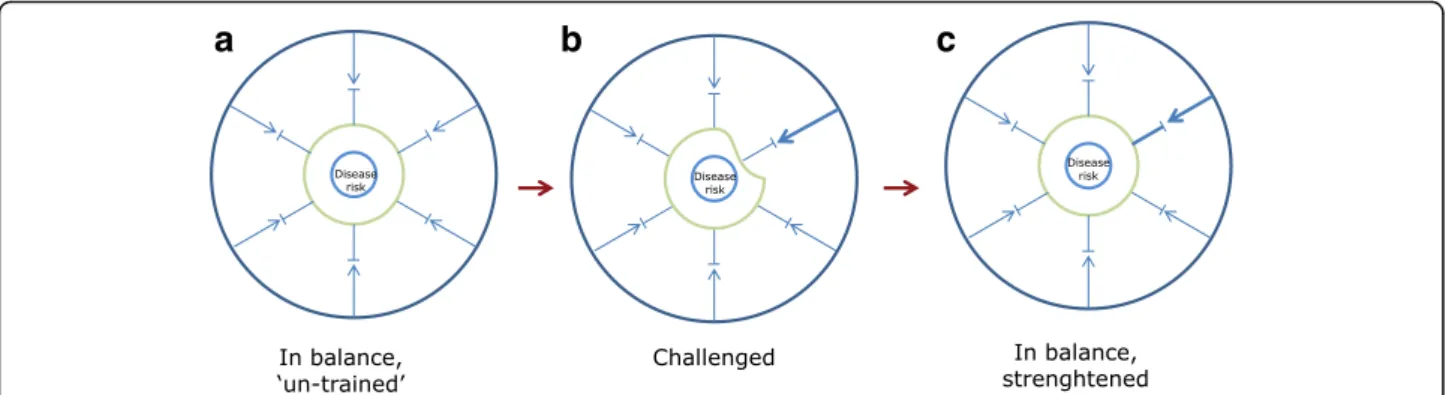
a
b
c
Fig. 6 System training by challenging. a In the naive, untrained but balanced state, the capacity to withstand a challenge is limited. b An increased challenge intensity will offset the system causing a temporary, weaker state. c Following a biological response such as enzyme induction, formation of antibodies or muscle re-building, the system becomes more resilient to challenge or stress
3. Biesalski HK, Dragsted LO, Elmadfa I, Grossklaus R, Müller M, Schrenk D, et al. Bioactive compounds: definition and assessment of activity. Nutrition. 2009;25:1202–5.
4. Potischman N. Biologic and methodologic issues for nutritional biomarkers. J Nutr. 2003;133(Suppl):875S–80S.
5. Aggett PJ, Antoine J-M, Asp N-G, Bellisle F, Contor L, Cummings JH, et al. Passclaim process for the assessment of scientific support for claims on foods. Eur J Nutr. 2005;44:I1–12.
6. Jenab M, Slimani N, Bictash M, Ferrari P, Bingham SA. Biomarkers in nutritional epidemiology: applications, needs and new horizons. Hum Genet. 2009;125:507–25.
7. Corella D, Ordovás JM. Biomarkers: background, classification and guidelines for applications in nutritional epidemiology. Nutr Hosp. 2015;31(Suppl 3):177–88. 8. Freedman LS, Kipnis V, Schatzkin A, Tasevska N, Potischman N. Can we use
biomarkers in combination with self-reports to strengthen the analysis of nutritional epidemiologic studies? Epidemiol Perspect Innov. 2010;7:2. 9. McEwen BS, Wingfield JC. The concept of allostasis in biology and
biomedicine. Horm Behav. 2003;43:2–15.
10. Miller G, Chen E, Cole SW. Health psychology: developing biologically plausible models linking the social world and physical health. Annu Rev Psychol. 2009;60:501–24.
11. Frumkin H. Beyond toxicity: human health and the natural environment. Am J Prev Med. 2001;20:234–40.
12. Flint HJ, Scott KP, Louis P, Duncan SH. The role of the gut microbiota in nutrition and health. Nat Rev Gastroenterol Hepatol. 2012;9:577–89. 13. Feil R. Environmental and nutritional effects on the epigenetic regulation of
genes. Mutat Res. 2006;600:46–57.
14. World Health Organization. Constitution of the World Health Organization. 1946.
15. Huber M, Knottnerus JA, Green L, van der Horst H, Jadad AR, Kromhout D, et al. How should we define health? BMJ. 2011;343:d4163.
16. Kaaks RJ. Biochemical markers as additional measurements in studies of the accuracy of dietary questionnaire measurements: conceptual issues. Am J Clin Nutr. 1997;65(Suppl):1232S–9S.
17. Favé G, Beckmann ME, Draper JH, Mathers JC. Measurement of dietary exposure: a challenging problem which may be overcome thanks to metabolomics? Genes and Nutrition. 2009;4:135–41.
18. Bingham SA, Gill C, Welch A, Cassidy A, Runswick SA, Oakes S, et al. Validation of dietary assessment methods in the UK arm of EPIC using weighed records, and 24-hour urinary nitrogen and potassium and serum vitamin C and carotenoids as biomarkers. Int J Epidemiol. 1997;26(Suppl 1):S137–51. 19. Da Silva Pinto M. Tea: a new perspective on health benefits. Food Res Int.
2013;53:558–67.
20. Richi EB, Baumer B, Conrad B, Darioli R, Schmid A, Keller U. Health risks associated with meat consumption: a review of epidemiological studies. Int J Vitam Nutr Res. 2015;85:70–8.
21. Cho I, Blaser MJ. The human microbiome: at the interface of health and disease. Nat Rev Genet. 2012;13:260–70.
22. Auton A, Abecasis GR, Altshuler DM, Durbin RM, Abecasis GR, Bentley DR, et al. A global reference for human genetic variation. Nature. 2015;526:68–74. 23. Sudmant PH, Rausch T, Gardner EJ, Handsaker RE, Abyzov A, Huddleston J,
et al. An integrated map of structural variation in 2,504 human genomes. Nature. 2015;526:75–81.
24. Schatzkin A, Kipnis V, Carroll RJ, Midthune D, Subar AF, Bingham S, et al. A comparison of a food frequency questionnaire with a 24-hour recall for use in an epidemiological cohort study: results from the biomarker-based observing protein and energy nutrition (OPEN) study. Int J Epidemiol. 2003;32:1054–62. 25. Day NE, McKeown N, Wong MY, Welch A, Bingham S. Epidemiological
assessment of diet: a comparison of a 7-day diary with a food frequency questionnaire using urinary markers of nitrogen, potassium and sodium. Int J Epidemiol. 2001;30:309–17.
30. Kristensen M, Engelsen SB, Dragsted LO. LC-MS metabolomics top-down approach reveals new exposure and effect biomarkers of apple and apple-pectin intake. Metabolomics. 2012;8:64–73.
31. Atkinson W, Downer P, Lever M, Chambers ST, George PM. Effects of orange juice and proline betaine on glycine betaine and homocysteine in healthy male subjects. Eur J Nutr. 2007;46:446–52.
32. Heinzmann SS, Brown IJ, Chan Q, Bictash M, Dumas M-E, Kochhar S, et al. Metabolic profiling strategy for discovery of nutritional biomarkers: proline betaine as a marker of citrus consumption. Am J Clin Nutr. 2010;92:436–43. 33. Lloyd AJ, Beckmann M, Favé G, Mathers JC, Draper J. Proline betaine and its
biotransformation products in fasting urine samples are potential biomarkers of habitual citrus fruit consumption. Br J Nutr. 2011;106:812–24. 34. Dahl H, Stephanson N, Beck O, Helander A. Comparison of urinary excretion
characteristics of ethanol and ethyl glucuronide. J Anal Toxicol. 2002;26: 201–4.
35. Wurst FM, Seidl S, Ladewig D, Müller-Spahn F, Alt A. Ethyl glucuronide: on the time course of excretion in urine during detoxification. Addict Biol. 2002;7:427–34.
36. Sarkola T, Dahl H, Eriksson CJP, Helander A. Urinary ethyl glucuronide and 5-hydroxytryptophol levels during repeated ethanol ingestion in healthy human subjects. Alcohol Alcohol. 2003;38:347–51.
37. Vázquez-Fresno R, Llorach R, Perera A, Mandal R, Feliz M, Tinahones FJ, et al. Clinical phenotype clustering in cardiovascular risk patients for the identification of responsive metabotypes after red wine polyphenol intake. J Nutr Biochem. 2016;28:114–20.
38. Gürdeniz G, Jensen MG, Meier S, Bech L, Lund E, Dragsted LO. Detecting beer intake by unique metabolite patterns. J Proteome Res. 2016;15:4544–56.
39. Linko A-M, Juntunen KS, Mykkänen HM, Adlercreutz H. Whole-grain rye bread consumption by women correlates with plasma alkylresorcinols and increases their concentration compared with low-fiber wheat bread. J Nutr. 2005;135:580–3.
40. Landberg R, Linko A-M, Kamal-Eldin A, Vessby B, Adlercreutz H, Åman P. Human plasma kinetics and relative bioavailability of alkylresorcinols after intake of rye bran. J Nutr. 2006;136:2760–5.
41. Ross AB, Kamal-Eldin A, Åman P. Dietary alkylresorcinols: absorption, bioactivities, and possible use as biomarkers of whole-grain wheat- and rye-rich foods. Nutr Rev. 2004;62:81–95.
42. Krogholm KS, Bredsdorff L, Alinia S, Christensen T, Rasmussen SE, Dragsted LO. Free fruit at workplace intervention increases total fruit intake: a validation study using 24 h dietary recall and urinary flavonoid excretion. Eur J Clin Nutr. 2010;64:1222–8.
43. Dragsted LO, Gao Q, Praticò G, Manach C, Wishart DS, Scalbert A, et al. Dietary and health biomarkers—time for an update. Genes Nutr. 2017; 12:24.
44. Bach-Faig A, Geleva D, Carrasco JL, Ribas-Barba L, Serra-Majem L. Evaluating associations between Mediterranean diet adherence indexes and biomarkers of diet and disease. Public Health Nutr. 2006;9:1110–7. 45. Andersen M-BS, Rinnan Å, Manach C, Poulsen SK, Pujos-Guillot E, Larsen TM,
et al. Untargeted metabolomics as a screening tool for estimating compliance to a dietary pattern. J Proteome Res. 2014;13:1405–18. 46. Marklund M, Magnusdottir OK, Rosqvist F, Cloetens L, Landberg R,
Kolehmainen M, et al. A dietary biomarker approach captures compliance and cardiometabolic effects of a healthy Nordic diet in individuals with metabolic syndrome. J Nutr. 2014;144:1642–9.
47. Guenther PM, Casavale KO, Reedy J, Kirkpatrick SI, Hiza HAB, Kuczynski KJ, et al. Update of the healthy eating index: HEI-2010. J Acad Nutr Diet. 2013;113:569–80.
48. Bach A, Serra-Majem L, Carrasco JL, Roman B, Ngo J, Bertomeu I, et al. The use of indexes evaluating the adherence to the Mediterranean diet in epidemiological studies: a review. Public Health Nutr. 2006;9:132–46.
49. Van Dam RM, Hunter D. Biochemical indicators of dietary intake. In: Willett W, editor. Nutritional epidemiology. 3rd ed. New York: Oxford University Press; 2012. p. 150–212.
50. Nepomnaschy PA, Baird DD, Weinberg CR, Hoppin JA, Longnecker MP, Wilcox AJ. Within-person variability in urinary bisphenol a concentrations: measurements from specimens after long-term frozen storage. Environ Res. 2009;109:734–7.
51. Sun Q, Bertrand KA, Franke AA, Rosner B, Curhan GC, Willett WC. Reproducibility of urinary biomarkers in multiple 24-h urine samples. Am J Clin Nutr. 2016;105:159–68.
52. Fahey MT, Sasaki S, Kobayashi M, Akabane M, Tsugane S. Seasonal misclassification error and magnitude of true between-person variation in dietary nutrient intake: a random coefficients analysis and implications for the Japan public health center (JPHC) cohort study. Public Health Nutr. 2002;6:385–91.
53. EFSA. Scientific opinion on the substantiation of health claims related to various food (s)/food constituent(s) and protection of cells from premature aging, antioxidant activity, antioxidant content and antioxidant properties, and protection of DNA, proteins a. EFSA J. 2010;8:1489.
54. Astley SB, Lindsay DG. European Research on the Functional Effects of Dietary Antioxidants (EUROFEDA). Conclusions. Mol Asp Med. 2002;23:287–91. 55. Hollman PCH, Cassidy A, Comte B, Heinonen M, Richelle M, Richling E, et al.
The biological relevance of direct antioxidant effects of polyphenols for cardiovascular health in humans is not established. J Nutr. 2011;141(Suppl): 989S–1009S.
56. Zhou Y, Han W, Gong D, Man C, Fan Y. Hs-CRP in stroke: a meta-analysis. Clin Chim Acta. 2016;453:21–7.
57. Zacho J, Tybjærg-Hansen A, Jensen JS, Grande P, Sillesen H, Nordestgaard BG. Genetically elevated C-reactive protein and ischemic vascular disease. N Engl J Med. 2008;359:1897–908.
58. Milllán J, Pintó X, Muñoz A, Zúñiga M, Rubiés-Prat J, Pallardo LF, et al. Lipoprotein ratios: physiological significance and clinical usefulness in cardiovascular prevention. Vasc Health Risk Manag. 2009;5:757–65. 59. Sesso HD, Stampfer MJ, Rosner B, Hennekens CH, Gaziano JM, Manson JE,
et al. Systolic and diastolic blood pressure, pulse pressure, and mean arterial pressure as predictors of cardiovascular disease risk in men. Hypertension. 2000;36:801–7.
60. Nichols GA, Hillier TA, Brown JB. Normal fasting plasma glucose and risk of type 2 diabetes diagnosis. Am J Med. 2008;121:519–24.
61. Ibru S, Kristensen M, Poulsen MW, Mikkelsen MS, Ejsing J, Jespersen BM, et al. Extracted oat and barleyβ-glucans do not affect cholesterol metabolism in young healthy adults. J Nutr. 2013;143:1579–85. 62. Dragsted LO, Krath B, Ravn-Haren G, Vogel UB, Vinggaard AM, Jensen B,
et al. Biological effects of fruit and vegetables. Proc Nutr Soc. 2006;65:61–7. 63. Toledo E, FB H, Estruch R, Buil-Cosiales P, Corella D, Salas-Salvadó J, et al.
Effect of the Mediterranean diet on blood pressure in the PREDIMED trial: results from a randomized controlled trial. BMC Med. 2013;11:207. 64. Poulsen SK, Due A, Jordy AB, Kiens B, Stark KD, Stender S, et al. Health effect
of the new Nordic diet in adults with increased waist circumference: a 6-mo randomized controlled trial. Am J Clin Nutr. 2014;99:35–45.
65. Hambidge M. Biomarkers of trace mineral intake and status. J Nutr. 2003; 133(Suppl):948S–55S.
66. EFSA. Scientific opinion on dietary reference values for iron. EFSA J. 2015;13:4254. 67. Chatthanawaree W. Biomarkers of cobalamin (vitamin B12) deficiency and
its application. J Nutr Heal Aging. 2011;15:227–31.
68. Neve J. Methods in determination of selenium states. J Trace Elem Electrolytes Health Dis. 1991;5:1–17.
69. Rea H, Thomson C, Campbell D, Robinson M. Relation between erythrocyte selenium concentrations and glutathione peroxidase (EC 1.11.1.9) activities of New Zealand residents and visitors to New Zealand. Br J Nutr. 1979;42:201–8. 70. Lauwerys RR, Bernard AM, Roels HA, Buchet J-P. Cadmium: exposure
markers as predictors of nephrotoxic effects. Clin Chem. 1994;40:1391–4. 71. Scientific EFSA. Opinion on the substantiation of health claims related to lutein
and maintenance of normal vision (ID 1603, 1604, further assessment) pursuant to article 13(1) of regulation ( EC ) no 1924/2006. EFSA J. 2012;10:2716. 72. Abdel-Aal E-SM, Akhtar H, Zaheer K, Ali R. Dietary sources of lutein and
zeaxanthin carotenoids and their role in eye health. Nutrients. 2013;5:1169–85. 73. Omoni AO, Aluko RE. The anti-carcinogenic and anti-atherogenic effects of
lycopene: a review. Trends Food Sci Technol. 2005;16:344–50. 74. Porrini M, Riso P, Testolin G. Absorption of lycopene from single or daily
portions of raw and processed tomato. Br J Nutr. 1998;80:353–61.
75. Al-Delaimy WK, Ferrari P, Slimani N, Pala V, Johansson I, Nilsson S, et al. Plasma carotenoids as biomarkers of intake of fruits and vegetables: individual-level correlations in the European Prospective Investigation into Cancer and Nutrition (EPIC). Eur J Clin Nutr. 2005;59:1387–96.
76. Krug S, Kastenmuller G, Stuckler F, Rist MJ, Skurk T, Sailer M, et al. The dynamic range of the human metabolome revealed by challenges. FASEB J. 2012;26:2607–19.
77. O’Sullivan A, Gibney MJ, Connor AO, Mion B, Kaluskar S, Cashman KD, et al. Biochemical and metabolomic phenotyping in the identification of a vitamin D responsive metabotype for markers of the metabolic syndrome. Mol Nutr Food Res. 2011;55:679–90.
78. Cornelis MC, El-sohemy A, Campos H. Genetic polymorphism of the adenosine A2A receptor is associated with habitual caffeine consumption. Am J Clin Nutr. 2007;86:240–4.
79. Palatini P, Ceolotto G, Ragazzo F, Dorigatti F, Saladini F, Papparella I, et al. CYP1A2 genotype modifies the association between coffee intake and the risk of hypertension. J Hypertens. 2009;27:1594–601.
80. Cornelis MC, El-Sohemy A, Kabagambe EK, Campos H. Coffee, CYP1A2 genotype, and risk of myocardial infarction. JAMA. 2006;295:1135. 81. Mancia G, De Backer G, Dominiczak A, Cifkova R, Fagard R, Germano G, et al.
2007 guidelines for the management of arterial hypertension. Eur Heart J. 2007;28:1462–536.
82. Rydén L, Standl E, Bartnik M, Van den Berghe G, Betteridge J, de Boer M-J, et al. Guidelines on diabetes, pre-diabetes, and cardiovascular diseases: full text. Eur Hear J Suppl. 2007;9(Suppl C):C3–74.
83. Goff DC, Lloyd-Jones DM, Bennett G, Coady S, D’Agostino RB, Gibbons R, et al. 2013 ACC/AHA guideline on the assessment of cardiovascular risk: a report of the American college of cardiology/American heart association task force on practice guidelines. Circulation. 2013;00:000.
84. Bro R, Kamstrup-Nielsen MH, Engelsen SB, Savorani F, Rasmussen MA, Hansen L, et al. Forecasting individual breast cancer risk using plasma metabolomics and biocontours. Metabolomics. 2015;11:1376–80. 85. Quifer-Rada P, Martínez-Huélamo M, Chiva-Blanch G, Jáuregui O, Estruch R,
Lamuela-Raventós RM. Urinary isoxanthohumol is a specific and accurate biomarker of beer consumption. J Nutr. 2014;144:484–8.
86. Arai Y, Uehara M, Sato Y, Kimira M, Eboshida A, Adlercreutz H, et al. Comparison of isoflavones among dietary intake, plasma concentration and urinary excretion for accurate estimation of phytoestrogen intake. J Epidemiol. 2000;10:127–35.
87. Gibbons H, Mcnulty B a, Nugent AP, Walton J, Flynn A, Gibney MJ, et al. A metabolomics approach to the identification of biomarkers of sugar-sweetened beverage intake. Am J Clin Nutr. 2015;101:471–7. 88. Garcia-Aloy M, Llorach R, Urpi-Sarda M, Tulipani S, Estruch R,
Martínez-González MA, et al. Novel multimetabolite prediction of walnut consumption by a urinary biomarker model in a free-living population: the PREDIMED study. J Proteome Res. 2014;13:3476–83.
89. Rothwell JA, Fillâtre Y, Martin JF, Lyan B, Pujos-Guillot E, Fezeu L, et al. New biomarkers of coffee consumption identified by the non-targeted metabolomic profiling of cohort study subjects. PLoS One. 2014;9:e93474.
• We accept pre-submission inquiries
• Our selector tool helps you to find the most relevant journal • We provide round the clock customer support
• Convenient online submission • Thorough peer review
• Inclusion in PubMed and all major indexing services • Maximum visibility for your research
Submit your manuscript at www.biomedcentral.com/submit