HAL Id: halshs-01403001
https://halshs.archives-ouvertes.fr/halshs-01403001
Preprint submitted on 25 Nov 2016
HAL is a multi-disciplinary open access archive for the deposit and dissemination of sci-entific research documents, whether they are pub-lished or not. The documents may come from teaching and research institutions in France or abroad, or from public or private research centers.
L’archive ouverte pluridisciplinaire HAL, est destinée au dépôt et à la diffusion de documents scientifiques de niveau recherche, publiés ou non, émanant des établissements d’enseignement et de recherche français ou étrangers, des laboratoires publics ou privés.
Aïssata Coulibaly, Urbain Thierry Yogo
To cite this version:
Aïssata Coulibaly, Urbain Thierry Yogo. Access to Financial Services and Working Poverty in Devel-oping Countries. 2016. �halshs-01403001�
C E N T R E D'E T U D E S E T D E R E C H E R C H E S S U R L E D E V E L O P P E M E N T I N T E R N A T I O N A L
SÉRIE ÉTUDES ET DOCUMENTS
Access to Financial Services and Working Poverty in Developing
Countries
Aïssata Coulibaly
Urbain Thierry Yogo
Études et Documents n° 20
November 2016To cite this document:
Coulibaly A., Yogo U. T. (2016) “Access to Financial Services and Working Poverty in Developing Countries ”, Études et Documents, n° 20 , CERDI.
http://cerdi.org/production/show/id/1833/type_production_id/1
CERDI
65 BD. F. MITTERRAND
63000 CLERMONT FERRAND – FRANCE TEL.+33473177400
FAX +33473177428
2
The authors
Aïssata Coulibaly
PhD Student in Economics
CERDI – Clermont Université, Université d’Auvergne, UMR CNRS 6587, 65 Bd F. Mitterrand, 63009 Clermont-Ferrand, France.
E-mail: caissata@gmail.com
Urbain Thierry Yogo PhD in Economics
University of Yaoundé (Cameroun) E-mail: yogout@gmail.com
Corresponding author: Aïssata Coulibaly
This work was supported by the LABEX IDGM+ (ANR-10-LABX-14-01) within the program “Investissements d’Avenir” operated by the French National Research Agency (ANR).
Études et Documents are available online at: http://www.cerdi.org/ed
Director of Publication: Vianney Dequiedt Editor: Catherine Araujo Bonjean
Publisher: Mariannick Cornec ISSN: 2114 - 7957
Disclaimer:
Études et Documents is a working papers series. Working Papers are not refereed, they constitute
research in progress. Responsibility for the contents and opinions expressed in the working papers rests solely with the authors. Comments and suggestions are welcome and should be addressed to the authors.
Abstract
This paper investigates the effect of access to financial services on the prevalence of working poor. Using a panel of 63 developing countries over the period 2004-2013, we find that improving financial access (as measured by the number of bank branches per 100,000 adults) reduces the prevalence of working poor (workers living with less than US$ 1.25 a day). This effect is even more relevant in countries affected by strong macroeconomic instability. Our findings are robust to endogeneity bias, the addition of various controls including remittances and mobile phone subscriptions, and to the shifting of the poverty line from US$ 1.25 to US$ 1.90. We also show that barriers to use banking services are correlated positively with working poverty. Moreover, our results confirm the validity of some transmissions channels such as growth (trickle-down effect) and the access of the non-poor workers to financial services, suggesting that improving financial access for the excluded non-poor can have a strong reducing-effect on working poverty.
Keywords
Financial access, Working poverty, Developing countries, Trickle-down effect.
JEL codes : 011, E44, G20
1. Introduction
A flourishing literature has emphasized a negative relationship between poverty and financial development proxied by some aggregate measures like credit to private sector , usually referred to as “private credit” or bank money deposit to GDP (Beck et al., 2007a; Jalilian and Kirkpatrick, 2002; Jeanneney and Kpodar, 2011; Odhiambo, 2009, 2010). In this study, the emphasis is on demographic branch penetration measured by the number of bank branches per 100,000 people which captures more precisely access to finance. In fact, financial development can directly reduce poverty through providing better access to financial services to the poor. First, with access to banks or formal financial services, transactions are safer, quicker, and cheaper like for payments or the transmission and receipt of remittances. Second, it also enables households and firms with credit and their saving to invest in productive activities such as fertilizer, better seeds, machinery, and other equipment. With saving and insurance, they can also smooth their income and reduce their vulnerability to unfortunate events as economic shocks, drought, disease, or death. The impact could also be indirect through growth1 or by providing access to these excluded non-poor micro and small entrepreneurs which can have a strong favourable indirect effect on the poor by increasing their employment opportunities for example (Beck et al., 2009). However, the current global deficit in quality jobs is likely to threaten several decades of efforts in poverty reduction and clearly put the sustainable development goal of ending poverty by 2030 at risk.
This article examines the poverty–reducing impact of access to finance by focusing on labor market. We argue that because the main asset of the poor is their labor, a better understanding of their working conditions is of great interest. Beyond absolute poverty, and the overall supply of labor force, we focus on the proportion of employed persons in a household whose members are living below the US$ 1.25 international poverty line, namely the working poor. This indicator has been developed by the International Labor Organization (ILO) for assessing the “decent work” agenda. According to its last estimates, they are 839 million2 of poor workers in developing countries representing one third of total employment (ILO, 2014). In fact, for the poor, unemployment is not a major concern in developing countries as they
1This is the trickle down hypothesis according to which economic growth will ultimately benefit the poor through more jobs and a higher incomes.
already have jobs; the problem is that despite working long hours, they do not earn enough to escape poverty (Fields ,2012)3.
This paper tests the hypothesis that a better access to financial services reduces the share of working poor, those receiving less than US$ 1.25 per day in the developing world. Access to finance can have an impact on labor both on the demand and the supply side. From the supply side, with better access to financial services, the poor will be able to negotiate better salaries, in other words they will supply labor more elastically. As shown by Blundell et al (2016), poor households respond to income shocks by increasing their labor supply in order to smooth their consumption. This induces a downward pressure on wages and it increases working poverty (Combes et al., 2014). For instance, with data for 257 districts in India, Jayachandran (2006) shows that in case of negative productivity shocks, with no possibility of borrowing or drawing on savings and migrate, the equilibrium wage for poor people is lower because they are constrained to work at lesser rate.
From the demand side, a better access to financial services in developing countries can be beneficial to small enterprises which can invest more and increase their demand for low qualified labor force. This could also be the case for informal businesses which can get out of informality and increase their labor demand. Consequently, the demand for unskilled labor increases as well as wages at the bottom of the distribution. For example, (Beck et al., 2010) demonstrates that branch deregulation in United States during the 1980s and 1990s reduced income inequality by boosting output and demand for unskilled labor. Thus, the wage and salary earnings of the unskilled and lower paid part of the labor force increased. It follows that
the share of poor workers decreases. Similar results have been found for Thailand (Giné and
Townsend, 2004). Furthermore, Beck et al. (2009) argue that the main impact of financial development on income inequality is through higher wages and the inclusion of a larger share of the population in the formal economy. Overall, increasing access to financial services will reduce working poverty through enhanced business performance, less informal sector and employment vulnerability.
We pay attention to the tail of the distribution of domestic wages, and look at the poorest workers (stuck in poverty traps), who represent a sizeable part of the labor supply in developing countries. Unlike previous studies which use macro focused proxy for financial deepening such as private credit, we use an indicator of financial outreach namely the number of bank branches per 100,000 people like (Mookerjee and Kalipioni, 2010). It has the
3
advantage of being correlated with aggregates measures as well as micro-indicators of barriers to finance (Beck et al., 2008, 2007b) and captures more thinly the real impact of finance through access to ordinary people in a country (Mundaca, 2009). In addition to demographic branch penetration, we also look at how barriers to use financial services may have an impact on working poverty. We test this hypothesis by replacing the number of bank branches per 100,000 people by indicators of constraints to use financial services like the amount of collateral required for a loan, the minimum amount to open and to be maintained in saving and checking account as well as the level of annual fees. These variables are more precise for assessing access to financial services, but we don’t use them as main variables of interest given the very low number of observations.
We also take advantage of a new dataset on the distribution of wages in developing countries compiled by ILO. It is the Key Indicators of Labor Market (KILM 9th Edition) which gives information on the share of individuals remunerated at less than US$1.25 per day as a proxy for the prevalence of working poor. Data are available for a large set of countries. The definition of the working poor rate in the dataset is based on (Kapsos and Bourmpoula, 2013). The ILO has continuously improved its methodology for the measurement of the working poverty rate across countries. The KILM dataset provides information on the working poverty rates, which are internationally comparable across countries, a critical requirement for the present cross-country study. Another advantage is that the KILM 9th Edition is derived from a micro-based approach to compute the working poverty rates for those countries where direct information from household and labor market surveys is not available. The approach gives robust estimations of the prevalence of working poverty with a minimized prediction error.
Using a sample of 63 developing countries spanning the period 2004 to 2013 and after factoring the endogeneity of financial development, the paper leads to the following results : (1) access to finance measured by the number of bank branches per 100,000 people reduces the share of individuals remunerated at low wages. (2) Working poverty tends to be correlated positively with the indicators of barriers to banking services. (3) This effect is even more relevant in countries affected by strong macroeconomic instability. Our findings are robust to the shifting of the poverty line from US$ 1.25 to US$ 1.90, to the introduction of new control variables namely remittances; mobile phone subscriptions and other measures of financial development such as private credit and bank concentration. Moreover, our results confirm the validity of some transmissions channels such as growth (trickle down hypothesis) and the access of non-poor workers to financial services.
The rest of this paper is organized as follows: section 2 presents a selective literature review. Section 3 describes the econometric specification and estimation method with some figures and tables on the distribution of access to financial services and working poverty. In Section 4, we discuss our results with some robustness check in section 5, then we conclude in section 6.
2. Selective literature review
An extensive literature has documented the relationship between financial development and growth, while focusing less on poverty. This is based on the assumption that financial development may trickle down to the poor through its influence on economic growth with more jobs and higher incomes. This theory has been supported by authors like Dollar and Kraay (2002), and Ravallion and Datt (2002).
In addition to this indirect effect, financial development can contribute directly to poverty reduction in many ways (Odhiambo, 2009). First, it can improve the opportunities for the poor to access formal finance by addressing the causes of financial market failures such as information asymmetry and the high fixed cost of lending to small borrowers (Jalilian and Kirkpatrick, 2005). In particular, demographic branch penetration through more bank branches reduces the distance between lenders and borrowers and improve lending conditions. For instance, Degryse and Ongena (2005) demonstrate that loan rates increase with the distance between the firm and bank branches, this could also be linked to the result of Bofondi and Gobbi (2006) who find that default rates are more than three times higher for firms outside the local market. Moreover, Brevoort and Hannan (2007) show a negative association between distance and the likelihood of a local commercial loan being granted while Gobbi and Zizza (2007) document that it is the probability of a household to hold a bank account which is correlated positively with the number of branches.
Second, with access to financial services such as credit, saving and insurance, the poor can engage in riskier high-yielding activities, start microenterprises, and reduce their vulnerability to shocks (Ellis et al., 2010). In addition, provide wider financial access to the excluded non-poor entrepreneurs can have a strongly favourable indirect effect on the poor by generating
more employment, and higher incomes and thereby reducing poverty (Beck et al., 2009).
Some of the studies which try to investigate empirically the link between financial development and poverty include (Beck et al., 2007a; Boukhatem, 2016; Burgess and Pande,
Jeanneney and Kpodar, 2011; Odhiambo, 2010, 2009; Rehman and Shahbaz, 2013)4. They generally find that financial development reduces poverty. For instance, Burgess and Pande (2005) find that opening of one bank branch per 100,000 people in a rural unbanked location reduces rural poverty by 4.7 percent in India. But this effect could partly be overshadowed out by macroeconomic and financial instability generated by financial markets expansion as the poor are the most affected (Boukhatem, 2016; Jeanneney and Kpodar, 2011).
Financial access can also have an impact on poverty through labor market. First, in developing countries, where wages are more volatile and sensitive to growth instability (Agénor et al., 2000; King and Rebelo, 1999)5, the poor tend to increase their labor supply in case of shocks, even if wages decrease (Blundell et al., 2016; Jayachandran, 2006; Sharif, 1991a, 1991b; Yamada, 2008). In other words, the elasticity of labor supply to wage is low. This is because with no possibility of borrowing or drawing on savings, the equilibrium wage for poor people is lower and they are obliged to work at lesser rate. For illustrative purposes, we can consider an economy where people are able to save or borrow. In case of bad shock which reduces the demand for labor, they will supply less labor and instead borrow or draw upon saving to smooth their consumption. But in an economy with limited access to financial services to deal with shocks, workers will increase their labor supply or reduce it to a lesser extend to meet their consumption need, resulting on a downward pressure on wages. Consequently, access to financial services can enable poor households to supply labor more elastically and manage wage volatility, thus inducing less working poor.
Second, by allowing consumption smoothing, reducing financing constraints and overall disposable income, financial access can affect the composition of the workforce and thus, the equilibrium of the labor market. In the short term, as mentioned earlier, households’ labor supply can become more elastic, leading to a lower prevalence of working poor. In the medium and long term, as long as access to finance help build human capital (De Gregorio, 1996), the economy starts to create relatively high-paid jobs.
The empirical evidence presented above has focused on poverty in general and has not paid attention on how financial development could have an impact on the poor’s wages as labor is their main asset. They also look at the overall supply of labor, but have disregarded the distinction between the poorest workers and the others. This study aims at filling this gap by
4 An extensive literature review has been compiled by (Uddin et al., 2014).
5 In the five developing countries studied by Agenor, McDermott, and Prasad (2000), the correlation between the quarterly real wage and contemporaneous domestic output ranges from .31 to .68 for 1978-95. The correlation coefficient in the U.S. is about .12 (King and Rebelo 1999).
investigating the effect of financial access on reducing the prevalence of working poor in developing countries.
3. Empirical strategy
3.1. Econometric model and data
In this section, we explore the link between financial access and working poverty on a sample of 63 developing countries over the period 2004-2013 (See appendix 1 for the list of countries). Because the estimation of working poverty uses national household surveys which in developing countries are not available on annual basis, the sample used in this study is unbalanced. Likewise, the choice of the sample period is dictated by data availability of the measure of financial access. The baseline econometric model we want to estimate is the following:
𝑤𝑝𝑖,𝑡 = 𝛽1𝑓𝑖𝑛𝑖,𝑡+ 𝑋𝑖,𝑡′ 𝛿 + 𝛼
𝑖 + 𝜀𝑖,𝑡 (1)
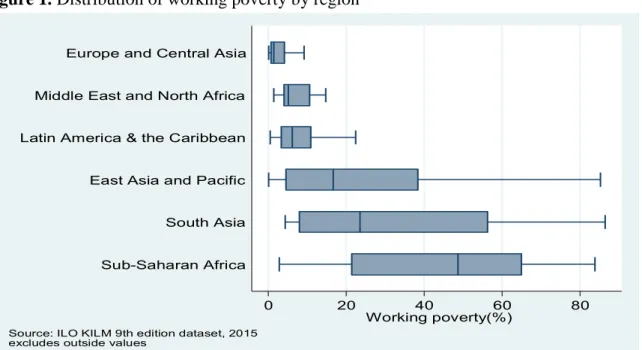
Where 𝑤𝑝𝑖,𝑡 is the share of working poor in the total employment in each country 𝑖 at year 𝑡. Following Kapsos and Bourmpoula (2013), working poverty is defined as the percentage of workers living with less than US$ 1.25 a day in PPA. The data are drawn from the 9th edition of the Key Indicators of Labor Market (KILM) made available by the International Labor Organization (ILO). Figure 1 shows the distribution of working poverty across regions. According to this figure, working poverty is more prevalent in South Asia and Sub-Saharan Africa where respectively 27% and 45% of the working force is living with less than US$ 1.25 per day.
Figure 1. Distribution of working poverty by region
Notes: In box plots, the lower and upper hinges of each box show the 25th and 75th percentiles of the samples, the line in the box indicates the respective medians, and the end-points of whiskers mark next adjacent value.
The variable 𝑓𝑖𝑛𝑖,𝑡 captures the access to financial services and is measured by the number of bank branches per 100,000 adults. This measure of financial access has been initially computed by Beck et al (2007) and later updated by the World Bank (World Development Indicators, 2014).
Figure 2. Distribution of bank branches by region
Notes: In box plots, the lower and upper hinges of each box show the 25th and 75th percentiles of the samples, the line in the box indicates the respective medians, and the end-points of whiskers mark next adjacent value.
Figure 2 displays the distribution of bank branches by regions. As expected, Sub-Saharan Africa is the region which is the less endowed with barely 4 bank branches per 100,000
0 20 40 60 80
Working poverty(%) Sub-Saharan Africa
South Asia East Asia and Pacific Latin America & the Caribbean Middle East and North Africa Europe and Central Asia
Source: ILO KILM 9th edition dataset, 2015 excludes outside values
0 20 40 60
Bank branches per 100,000 adults Europe and Central Asia
Latin America & the Caribbean Middle East and North Africa East Asia and Pacific South Asia Sub-Saharan Africa
Source: The Global Financial Development Database, World Bank excludes outside values
adults. This region has the lowest degree of financial inclusion and bank branches tend to be concentrated in the biggest cities (Guerineau and Jacolin, 2014).
In equation (1), 𝑋𝑖,𝑡′ is the matrix of control variables including the logarithm of GDP per
capita, trade openness, foreign direct investment in percentage of GDP (FDI), growth volatility and income inequality measured by the GINI index. The choice of the control variables is consistent with the literature on poverty and working poverty (see Combes et al, 2014). Country fixed effects are added to the model to control for the unobserved heterogeneity at the country level. Finally, 𝜀𝑖,𝑡 is the idiosyncratic error terms which is also likely to capture measurement error on the dependent variable.
The hypothesis tested in this paper is that increased access to financial services in developing countries may reduce the prevalence of working poverty. Specifically, we expect the coefficient 𝛽1 to be negative and significant (𝛽1 < 0). In fact, access to financial services
helps poor households to smooth their consumption by investing in productive activities which may lift them out of poverty (Beck et al, 2007; Ellis et al, 2010). In the same line, by relaxing financial constraints, better access to financial services enable the poor to raise their reservation wage, leading to the reduction of working poverty. The GDP per capita is included in the model to control for the potential effect of the level of development on working poverty. Due to the fact that the window of opportunities for poor widen with the level of development, we expect a negative effect of GDP per capita on working poverty. The effect of trade openness is ambiguous because trade affects both the demand and the supply side. Furthermore, the effect may depend on how trade affect unskilled and skilled labor. For instance, if trade openness induces an increase in the demand of skilled labor relative to the unskilled one, we may expect a positive effect on working poverty because poor are more likely to offer unskilled labor. The expected effect of FDI is negative because an increase of foreign investment is likely to reduce working poverty through the rise of labor demand. Growth volatility is measured as the rolling standard deviation of GDP growth over ten years and is expected to increase working poverty. As shown by Blundell et al (2016), poor households respond to income shocks by increasing their labor supply in order to smooth their consumption. This induces a downward pressure on wages and increases working poverty (Combes et al, 2014). Data related to GDP per capita, FDI and trade openness are drawn from the World Development Indicators of the World Bank. Finally, we expect a positive effect of income inequality through the increase of labor supply. The income inequality is measured by the Gini coefficient of market income obtained from the Standardized World Income
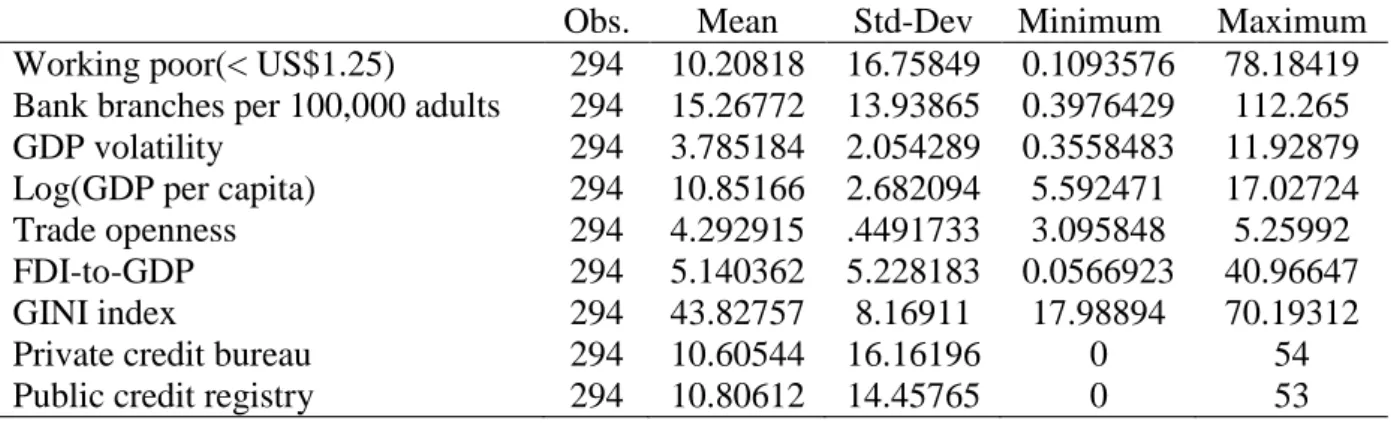
Inequality Database (SWIID) calculated by Solt (2014). The descriptive statistics related to the control variables are presented in Table 1.
Table 1. Descriptive statistics
Obs. Mean Std-Dev Minimum Maximum
Working poor(< US$1.25) 294 10.20818 16.75849 0.1093576 78.18419
Bank branches per 100,000 adults 294 15.26772 13.93865 0.3976429 112.265
GDP volatility 294 3.785184 2.054289 0.3558483 11.92879
Log(GDP per capita) 294 10.85166 2.682094 5.592471 17.02724
Trade openness 294 4.292915 .4491733 3.095848 5.25992
FDI-to-GDP 294 5.140362 5.228183 0.0566923 40.96647
GINI index 294 43.82757 8.16911 17.98894 70.19312
Private credit bureau 294 10.60544 16.16196 0 54
3.2. Identification strategy and estimation method
The standard approach to estimate the effect of financial access on working poverty is to use ordinary least square regression. Although this approach gives an idea about the correlation between the two variables, it is difficult to infer a causal effect running from financial access to working poverty. The relationship between financial access and working poverty might be driven by reverse causation. For instance, financial access might be low for poor households. Therefore, the expected negative effect of the former may only indicate this reverse causality. In addition, financial access may be measured with error. In this case, the estimated OLS effect will be attenuated (underestimation/overestimation).
The strategy adopted in this paper is to build on the existing literature on the determinants of financial development to find an exogenous source of variation in financial access. Following Djankov et al, (2007); and Beck et al, (2007), we use the existence of credit bureaus and public credit registries as source of exogenous variation in financial access in developing countries. A private credit bureau is defined as a private commercial firm or non-profit organization which maintains a database on the standing of borrowers in the financial system and has as primary purpose to facilitate the exchange of information amongst banks and financial institutions (Djankov et al, 2007). The variable takes value one if a credit bureau operate in the country and zero otherwise. Likewise a public registry is defined as a database owned by public authorities (central bank or banking supervisory authority) that collect information on the standing of borrowers and share it with financial institutions (Djankov et al, 2007). The variable equal one if the public registry operates in a country and zero otherwise. Unlike the above mentioned authors who directly make use of dummy variables, we use the number of years of operation which seems to be more relevant and relatively exogenous. For example the establishment of a credit bureau involves dealing with several issues including regulatory framework issues, lack of data or unreliable ones, information technology issues, skills and human resources issues (Baer et al., 2009). Therefore, if the establishment of a credit bureau is likely to be predictable, the time when it is set up as well as the number of years of operation are less likely to be predictable. However, to substantiate this reasoning, we test the exogeneity of our instrument while resorting to the Hansen’s overidentification test.
2009; Beck et al., 2007b). By sharing the information about borrower’s behaviour, credit bureaus and public registries increase access to bank services, support responsible lending, reduce credit losses and strengthen banking supervision (Baer et al., 2009). Since these positive effects on financial development and access are strongly correlated with poverty reduction, it appears obvious that the impact of credit bureaus and public registry on working poverty operates only through the existence of bank infrastructures. We argue that better information on borrower’s behavior drives the establishment of banks and financial institutions near poor households, improving their access to financial services and thereby leading to the reduction of working poverty.
The World development Indicators of the World Bank also proposes two measures of credit information sharing, namely private credit bureau coverage and public credit registry coverage. They represent the number of individuals or firms listed as credit bureau or public registry in percentages of the adult population. These data are available since 2004, and their use reduces our sample since with the number of year of existence, we can construct a larger dataset before 2004. So we use these measure as robustness check while our preferred instruments are the number of year of existence of these institutions for our measure of financial access (number of bank branches per 100,000 adults). Because, the 2SLS estimates can be biased if the chosen instruments are weak, we test their strength while resorting to the Kleibergen-Paap F statistic. Moreover, to further ensure that our estimates are not biased, we use the Limited Information Maximum Likelihood (LIML) which is more robust to weak instruments than the simple two stage least square.
4. Empirical findings
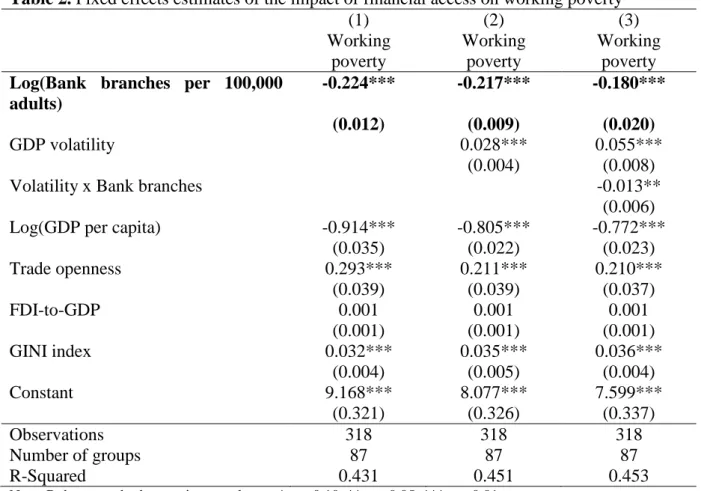
As a preliminary step of our investigation, we report in Table 2 the OLS estimates of the effect of financial access on working poverty.
The first column of the table displays the estimates of the baseline model and shows a negative and significant effect of financial access as measured by the number of bank branches on working poverty. Specifically, an increase of the number of bank branches by a one hundred percent induces a decrease of working poverty by 0.22 percentage point. Similar result is obtained when one controls for the growth volatility. Finally, the third column augments the model with an interaction between the volatility of growth and financial access. The purpose of this inclusion is to test the hypothesis according to which the magnitude of the decreasing effect of financial access is higher in countries that are strongly affected by external shocks. The coefficient of the interaction term is significant and has the expected
sign, confirming the hypothesis that access to financial services is even more relevant in countries affected by strong macroeconomic instability.
Table 2. Fixed effects estimates of the impact of financial access on working poverty
(1) (2) (3) Working poverty Working poverty Working poverty
Log(Bank branches per 100,000 adults)
-0.224*** -0.217*** -0.180***
(0.012) (0.009) (0.020)
GDP volatility 0.028*** 0.055***
(0.004) (0.008)
Volatility x Bank branches -0.013**
(0.006)
Log(GDP per capita) -0.914*** -0.805*** -0.772***
(0.035) (0.022) (0.023) Trade openness 0.293*** 0.211*** 0.210*** (0.039) (0.039) (0.037) FDI-to-GDP 0.001 0.001 0.001 (0.001) (0.001) (0.001) GINI index 0.032*** 0.035*** 0.036*** (0.004) (0.005) (0.004) Constant 9.168*** 8.077*** 7.599*** (0.321) (0.326) (0.337) Observations 318 318 318 Number of groups 87 87 87 R-Squared 0.431 0.451 0.453
Note: Robust standard errors in parentheses. * p < 0.10, ** p < 0.05, *** p < 0.01
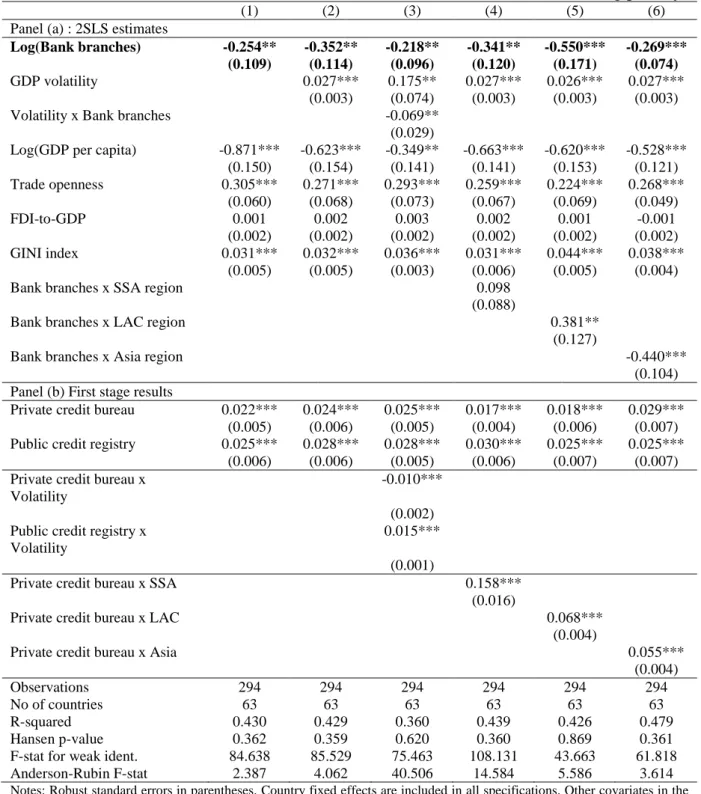
Table 3 reports the instrumental variables estimates which deal with the bias induced by the endogeneity of our interest variable. Two instruments are used to infer a causal effect of financial access on working poverty, namely the number of years a credit bureau and a public registry have been operating in a country. In order to ensure that the instruments are not weak, we report the first stage regressions which provide an idea about the strength of the correlation with the interest variable (see Panel (b))6. The first stage regressions show that our instruments are not weak as they are strongly correlated with the measure of financial access at the 1% level with the correct positive sign. In addition, we report the Wald F statistic based on the Kleibergen-Paap (2006) rk statistic which is superior to the standard Cragg-Donald (1993) statistic in the presence of heteroskedasticity and autocorrelation. The reported statistics are far above the Stock and Yogo (2005) critical values and above the value of 10 as
suggested by the “rule of thumb” of Staiger and Stock (1997). The relevance of the instruments is assessed through the Hansen test of overidentifying restrictions.
Table 3. Instrumental variable estimates of the effects of financial access on working poverty
(1) (2) (3) (4) (5) (6)
Panel (a) : 2SLS estimates
Log(Bank branches) -0.254** -0.352** -0.218** -0.341** -0.550*** -0.269***
(0.109) (0.114) (0.096) (0.120) (0.171) (0.074)
GDP volatility 0.027*** 0.175** 0.027*** 0.026*** 0.027*** (0.003) (0.074) (0.003) (0.003) (0.003) Volatility x Bank branches -0.069**
(0.029)
Log(GDP per capita) -0.871*** -0.623*** -0.349** -0.663*** -0.620*** -0.528*** (0.150) (0.154) (0.141) (0.141) (0.153) (0.121) Trade openness 0.305*** 0.271*** 0.293*** 0.259*** 0.224*** 0.268*** (0.060) (0.068) (0.073) (0.067) (0.069) (0.049) FDI-to-GDP 0.001 0.002 0.003 0.002 0.001 -0.001 (0.002) (0.002) (0.002) (0.002) (0.002) (0.002) GINI index 0.031*** 0.032*** 0.036*** 0.031*** 0.044*** 0.038*** (0.005) (0.005) (0.003) (0.006) (0.005) (0.004)
Bank branches x SSA region 0.098
(0.088)
Bank branches x LAC region 0.381**
(0.127)
Bank branches x Asia region -0.440***
(0.104) Panel (b) First stage results
Private credit bureau 0.022*** 0.024*** 0.025*** 0.017*** 0.018*** 0.029*** (0.005) (0.006) (0.005) (0.004) (0.006) (0.007) Public credit registry 0.025*** 0.028*** 0.028*** 0.030*** 0.025*** 0.025***
(0.006) (0.006) (0.005) (0.006) (0.007) (0.007) Private credit bureau x
Volatility
-0.010*** (0.002) Public credit registry x
Volatility
0.015*** (0.001)
Private credit bureau x SSA 0.158*** (0.016)
Private credit bureau x LAC 0.068***
(0.004)
Private credit bureau x Asia 0.055***
(0.004)
Observations 294 294 294 294 294 294
No of countries 63 63 63 63 63 63
R-squared 0.430 0.429 0.360 0.439 0.426 0.479 Hansen p-value 0.362 0.359 0.620 0.360 0.869 0.361 F-stat for weak ident. 84.638 85.529 75.463 108.131 43.663 61.818 Anderson-Rubin F-stat 2.387 4.062 40.506 14.584 5.586 3.614
Notes: Robust standard errors in parentheses. Country fixed effects are included in all specifications. Other covariates in the first-stage regression are omitted for the presentational convenience, more details are available in Appendix 2. SSA refers to Sub-Saharan Africa, LAC to Latin America and Caribbean.* p < 0.1, ** p < 0.05, *** p < 0.01
Based on the Hansen p-values, we cannot reject the null hypothesis that the instruments are uncorrelated with the errors terms and that the excluded instruments are correctly excluded from the estimated equation.
The first column of Table 3 presents the baseline specification and shows a negative and significant effect of financial access on working poverty. The magnitude of the effect is slightly higher than the one obtained with the OLS estimates suggesting that not taking into account the endogeneity may lead to an underestimation of the true impact. Based on these estimates, a one hundred percent increase in financial access (number of bank branches) induces 0.25 percentage point decrease in working poverty. In the second column of the Table 3, we add the volatility of GDP to the model to control for the effect of uncertainty and macroeconomic instability. The effect of financial access remains statistically significant, but the magnitude increases by about 10 percentage point. This result clearly suggests that improving financial access for the poor is very important especially in a context of macroeconomic uncertainty.
The third column reports the estimates when we control for an interaction between growth volatility and financial access. The expected negative sign is obtained, confirming the fact that the effect of financial access on working poverty is higher for countries facing macroeconomic instability. Another interpretation of this result is that the positive effect of macroeconomic volatility on working poverty is lower when poor have better access to financial services.
In the last three columns, we add interactions between regional dummies and the measure of financial access7. The reason for that is to test a specific regional effect of financial access. Surprisingly, the marginal effect of financial access conditional of being a country of Sub-Saharan Africa (SSA) is not significant. A potential explanation is the fact that the number of bank branches in Sub-Saharan Africa is almost four times lower than the within sample mean which stands at 15. Therefore, the expected effect cannot be observed because the number of bank branches is very small to reach the poor. In contrast, as expected, the marginal effect of financial access conditional of being an Asian country is negative and significant. In other words, the impact of improving financial access for the poor is very effective in Asia (second region with the highest share of working poor) compared to the other regions.
5. Testing for some transmission channels and sensitivity analysis
In this section, we test some economic assumptions based on our literature review and discuss the results of various robustness tests carried out on the baseline model.
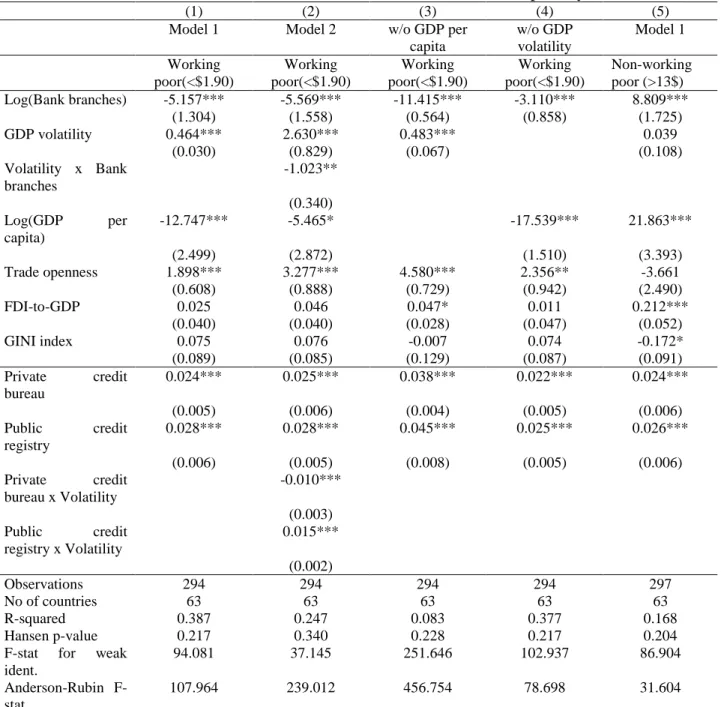
First, we check the sensitivity of our findings by changing the poverty line from US$ 1.25 to US$ 1.90 and includes as the dependent variable the share of non-working poor (people living with more than US$ 13 a day). So in the first four columns of Table 6, the dependent variable is the proportion of working poor living with less than 1.90$ while in the last column the share of non-working poor is used as dependent variable. In the first two columns, we replicate the baseline regressions controlling for the interaction between financial access and growth volatility. The results reported in Table 4 shows that the effect of financial access on working poverty remains robust. The number of bank branches per 100,000 people exerts a negative effect on the prevalence of working poor and this effect is reinforced in case of growth volatility where the poor who are more vulnerable are the most affected. The magnitude of the impact is higher compared to the baseline model suggesting that the effectiveness of financial access in reducing working poverty is higher as one goes away from the poverty trap.
In columns (3), (4) & (5) we test the effectiveness of some transmission channels based on the literature review. First, financial development may have an impact indirectly through growth by improving the level of income of all the population. Secondly, providing a better access of financial services to the excluded non-poor like micro and small entrepreneurs can have a strongly favorable indirect effect on growth and overall reducing the prevalence of working poor (Beck et al., 2007b). To test the first hypothesis, we run regressions on the prevalence of working poor (less than US$ 1.90) without the level of GDP per capita in column 3 and without growth volatility in column 4. For the second hypothesis, we test whether a better access to financial services may increase the share of the non-poor workers, measured by the proportion of workers living with more than 13$ per day by person based on the category proposed by the ILO dataset following (Kapsos and Bourmpoula, 2013).
Our results summarized in Table 4 show that the amplitude of the coefficients of financial access increases when we drop the level of GDP per capita indicating that it is a potential transmission channel. We also find that financial access increases the proportion of the non-working poor living with more than 13$ per day. This result brings a strong support to the trickle-down
hypothesis according to which by building a new class of non-poor, improving financial access for all provides more opportunities to poor workers through an increase of labor demand.
Table 4. Test of transmission channel and robustness check for different poverty line
(1) (2) (3) (4) (5)
Model 1 Model 2 w/o GDP per capita w/o GDP volatility Model 1 Working poor(<$1.90) Working poor(<$1.90) Working poor(<$1.90) Working poor(<$1.90) Non-working poor (>13$) Log(Bank branches) -5.157*** -5.569*** -11.415*** -3.110*** 8.809*** (1.304) (1.558) (0.564) (0.858) (1.725) GDP volatility 0.464*** 2.630*** 0.483*** 0.039 (0.030) (0.829) (0.067) (0.108) Volatility x Bank branches -1.023** (0.340) Log(GDP per capita) -12.747*** -5.465* -17.539*** 21.863*** (2.499) (2.872) (1.510) (3.393) Trade openness 1.898*** 3.277*** 4.580*** 2.356** -3.661 (0.608) (0.888) (0.729) (0.942) (2.490) FDI-to-GDP 0.025 0.046 0.047* 0.011 0.212*** (0.040) (0.040) (0.028) (0.047) (0.052) GINI index 0.075 0.076 -0.007 0.074 -0.172* (0.089) (0.085) (0.129) (0.087) (0.091) Private credit bureau 0.024*** 0.025*** 0.038*** 0.022*** 0.024*** (0.005) (0.006) (0.004) (0.005) (0.006) Public credit registry 0.028*** 0.028*** 0.045*** 0.025*** 0.026*** (0.006) (0.005) (0.008) (0.005) (0.006) Private credit bureau x Volatility -0.010*** (0.003) Public credit registry x Volatility 0.015*** (0.002) Observations 294 294 294 294 297 No of countries 63 63 63 63 63 R-squared 0.387 0.247 0.083 0.377 0.168 Hansen p-value 0.217 0.340 0.228 0.217 0.204 F-stat for weak
ident.
94.081 37.145 251.646 102.937 86.904 Anderson-Rubin
F-stat
107.964 239.012 456.754 78.698 31.604
Notes: Robust standard errors in parentheses. Country fixed effects are included in all specifications. Other covariates in the first-stage regression are omitted for the presentational convenience, more details are available in Appendix.* p < 0.1, ** p < 0.05, ***
p < 0.01.
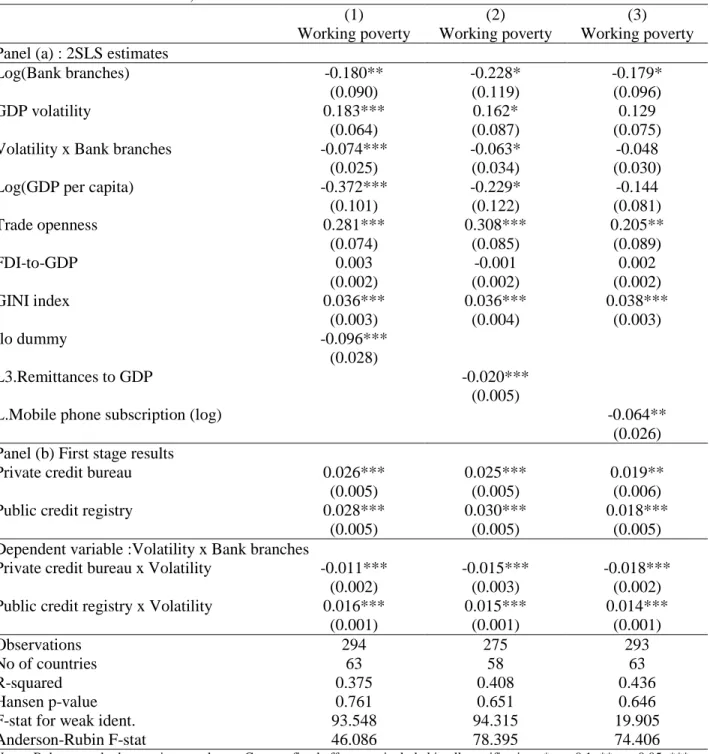
The second set of robustness tests consist in adding new controls variables to our baseline model and see how sensitive the estimates are.
Table 5. Robustness check, additional control variables
(1) (2) (3)
Working poverty Working poverty Working poverty Panel (a) : 2SLS estimates
Log(Bank branches) -0.180** -0.228* -0.179*
(0.090) (0.119) (0.096)
GDP volatility 0.183*** 0.162* 0.129
(0.064) (0.087) (0.075)
Volatility x Bank branches -0.074*** -0.063* -0.048
(0.025) (0.034) (0.030)
Log(GDP per capita) -0.372*** -0.229* -0.144
(0.101) (0.122) (0.081) Trade openness 0.281*** 0.308*** 0.205** (0.074) (0.085) (0.089) FDI-to-GDP 0.003 -0.001 0.002 (0.002) (0.002) (0.002) GINI index 0.036*** 0.036*** 0.038*** (0.003) (0.004) (0.003) Ilo dummy -0.096*** (0.028) L3.Remittances to GDP -0.020*** (0.005)
L.Mobile phone subscription (log) -0.064**
(0.026) Panel (b) First stage results
Private credit bureau 0.026*** 0.025*** 0.019**
(0.005) (0.005) (0.006)
Public credit registry 0.028*** 0.030*** 0.018***
(0.005) (0.005) (0.005)
Dependent variable :Volatility x Bank branches
Private credit bureau x Volatility -0.011*** -0.015*** -0.018***
(0.002) (0.003) (0.002)
Public credit registry x Volatility 0.016*** 0.015*** 0.014***
(0.001) (0.001) (0.001)
Observations 294 275 293
No of countries 63 58 63
R-squared 0.375 0.408 0.436
Hansen p-value 0.761 0.651 0.646
F-stat for weak ident. 93.548 94.315 19.905
Anderson-Rubin F-stat 46.086 78.395 74.406
Notes: Robust standard errors in parentheses. Country fixed effects are included in all specifications.* p < 0.1, ** p < 0.05, *** p < 0.01.
First, following Combes et al (2014), we include in the model a dummy capturing whether the observations of the working poverty are directly drawn from household surveys or computed by the ILO. Controlling for this dummy helps to rule out any persistent measurement error in the
dependent variable8. Likewise, we control for remittance inflows and mobile phone subscription. Controlling for remittances is consistent with the literature which emphasize its role on poverty reduction and labor supply (Amuedo-Dorantes and Pozo, 2012; Combes et al., 2014). In addition, controlling for remittances typically ensure that the effect captured in the model is clearly a financial infrastructure type effect and not a financial flow effect. In the same line, adding mobile phone subscription as a control variable helps taking into account the recent mobile revolution that has stimulated financial access in developing countries through phone-based money transfers (Aker and Mbiti, 2010; Asongu, 2013). Table 5 reports the results of these various robustness tests and shows that the effect of financial access on working poverty remains robust irrespective to the control variable added in the model.
In Table 6, for the first two columns, we use alternative measures for our instruments namely the number of private credit bureaus and public credit registries as percentage of the population separetely. These indicators are available in the World Development Indicators of the World Bank. Once again, our results remained unchanged with working poverty associated negatively to the number of bank branches while this effect tends to attenuate the impact of growth volatility on the poor workers. In column (3), we introduce two measures of financial development which are private credit ratio to GDP and bank concentration9 in order to ensure that our measure of bank penetration does not capture other dimensions of financial development like (Beck et al., 2014). Given their potential endogeneity, we introduce their lags of two periods. These data are available on the Global Financial Development Database of the World Bank.
In Column (4), from the same database, we introduce the value of collateral needed by a formal financial institution for a loan or a line of credit as a percentage of the loan value. This is to control for the barrier to use financial services in addition to their physical access. We find that bank concentration and the value of collateral tend to increase working poverty while the ratio of private credit despite its negative sign is not significant. This is logical as concentration reflects a low level of financial deepening and a high level of collateral prevent poor to benefit from access to financial services. For the value of collateral, we only have 42 observations compared to 294 observations when we use demographic branch penetration. This emphasizes the scarcity of data on the constraints to use financial services faced by households. We also use alternative measures
for these barriers10 which are the number of locations to open a deposit account, the number of documents needed to open a saving and a deposit account, the minimum amount to open and to be maintained in these accounts as well as , the annual fees associated as percentage GDP per capita.
Table 6. Controlling for alternative measures of financial development and barriers to use
financial services (1) (2) (3) (4) Working poverty Working poverty Working poverty Working poverty Log(Bank branches) -0.267*** -0.139 -0.520*** -0.432*** (0.082) (0.098) (0.120) (0.055) GDP volatility 0.020*** 0.099** 0.216* -0.055** (0.006) (0.043) (0.113) (0.016)
Volatility x Bank branches -0.035* -0.089* 0.023***
(0.018) (0.043) (0.004)
Log(GDP per capita) -0.540*** -0.429*** 0.315 -0.555*
(0.059) (0.115) (0.193) (0.254) Trade openness 0.165 0.149* 0.465*** 0.361** (0.094) (0.071) (0.131) (0.119) FDI-to-GDP 0.000 0.001 0.001 0.009 (0.001) (0.001) (0.002) (0.011) GINI index 0.051*** 0.058*** 0.020*** 0.075*** (0.004) (0.006) (0.005) (0.006)
L2.Private credit ratio to GDP(log)
-0.047 (0.033)
L2.log(Bank concentration) 0.342***
(0.095) log (Value of collateral(%loan
amount)) 0.249*** (0.053) Observations 253 253 270 42 No of countries 54.000 54.000 54.000 20.000 R-squared 0.452 0.453 0.089 0.537 Hansen p-value 0.404 ;0.467 0.6204 0.1981
F-stat for weak ident. 32.917 26.469 66.177 3.985
Anderson-Rubin F-stat 17.124 21.772 49.507 186.308
Notes: Robust standard errors in parentheses. Country fixed effects are included in all specifications.* p < 0.1, ** p < 0.05, *** p < 0.01. Instruments for the first two columns are private credit and pubic registry coverage while in the other column we use the number of years of existence for these two institutions.
10
These data are retrieved from (Beck et al., 2008) and are available only for the year 2004-2005 which considerably reduces our sample to 24 observations. So, we are not inferring for causality but for simple correlations. The number of location to open a deposit account is based on the fact that even if there is a wide network of bank offices, they offer different services. This indicator takes a value of 1 to 3 depending on whether an account can be opened at headquarters only (1), at headquarters or a branch (2), or at headquarters, branches, or non-branch offices (3). The number of documents to open an account is an indicator of eligibility based on the fact that besides identification card, banks in some countries can required other documents including wage slips, recommendation letters… The other indicators about the amount needed to open and to be maintained in a saving and a checking account as well as annual fees measure the affordability of these services. More details are given in the article by Beck et al. (2008). The results when we introduce barriers to use banking services are presented in Appendices (7) and (8) for OLS estimates and in Appendices (10) and (11) for instrumental variables estimates. We use the same instruments as for bank branches. Our findings confirm the fact that barriers to use banking services are correlated positively to working poverty. Especially for checking account, the number of documents to open an account is significant in all specifications. It is the same case for saving, with in addition, the level of annual fees, and the amount to be maintained in the account which are also significant in the OLS and instrumental variables estimates.
6. Conclusion
According to the proponents of the trickle-down economics a rising tide lifts all boats. In other words economic growth will ultimately benefit the poor through more jobs and higher incomes. However, despite decades of economic growth in the developing world, in 2013 about 375 million workers lived with less than US$ 1.25 a day (ILO, 2014). This paper complements the existing literature by investigating the effect of financial access on the reduction of the prevalence of working poor in developing countries.
Using a sample of 63 developing countries over the period 2004-2013, this paper shows that improving financial access (as measured by the number of bank branches per 100,000 adults) reduces the prevalence of working poor (workers living with less than US$ 1.25 a day). This effect is robust to endogeneity bias, measurement error in the dependent variable and the addition of various controls including a measure of macroeconomic instability, remittances and mobile phone subscriptions. In addition, the impact of financial access still holds when the poverty line is shifted from US$ 1.25 to US$ 1.90. In the same line, the study shows that improving financial access for the excluded non-poor can have a strong reducing-effect on working poverty. We also document that barriers to use banking services can increase working poverty.
Overall, the paper points to an increase of the number of bank branches per 100,000 adults in order to ease the access of both the poor and the excluded non-poor to financial services in developing countries. Improving banking sector outreach by building more bank branches and bringing financial services to the poor is a pressing development priority.
References
Agénor, P.-R., McDermott, C.J., Prasad, E.S., 2000. Macroeconomic Fluctuations in Developing Countries: Some Stylized Facts. World Bank Econ Rev 14, 251–285. doi:10.1093/wber/14.2.251
Aker, J.C., Mbiti, I.M., 2010. Mobile Phones and Economic Development in Africa. Journal of Economic Perspectives 24, 207–232. doi:10.1257/jep.24.3.207
Amuedo-Dorantes, C., Pozo, S., 2012. Remittance Income Volatility and Labor Supply in Mexico. Remittance Income Volatility and Labor Supply 79, 257–276. doi:10.4284/0038-4038-2011.102
Asongu, S.A., 2013. How has Mobile Phone Penetration Stimulated Financial Development in Africa? Journal of African Business 14, 7–18. doi:10.1080/15228916.2013.765309
Ayyagari, M., Demirgüç-Kunt, A., Maksimovic, V., 2008. How Important Are Financing Constraints? The Role of Finance in the Business Environment. World Bank Econ Rev 22, 483–516. doi:10.1093/wber/lhn018
Baer, T., Carassinu, M., Del Miglio, A., Fabiani, C., Ginevra, E., 2009. The national credit bureau: A key enabler of financial infrastructure and lending in developing economies (McKinsey Working Papers on Risk No. 14). McKinsey & Company.
Beck, T., Demirgüç-Kunt, A., Honohan, P., 2009. Access to Financial Services: Measurement, Impact, and Policies. World Bank Res Obs 24, 119–145. doi:10.1093/wbro/lkn008
Beck, T., Demirgüç-Kunt, A., Levine, R., 2007a. Finance, inequality and the poor. J Econ Growth 12, 27–49. doi:10.1007/s10887-007-9010-6
Beck, T., Demirguc-Kunt, A., Martinez Peria, M.S., 2008. Banking Services for Everyone? Barriers to Bank Access and Use around the World. The World Bank Economic Review 22, 397–430. doi:10.1093/wber/lhn020
Beck, T., Demirguc-Kunt, A., Martinez Peria, M.S., 2007b. Reaching out: Access to and use of banking services across countries. Journal of Financial Economics 85, 234–266. doi:10.1016/j.jfineco.2006.07.002
Beck, T., Levine, R., Levkov, A., 2010. Big Bad Banks? The Winners and Losers from Bank Deregulation in the United States. The Journal of Finance 65, 1637–1667.
Beck, T., Lin, C., Ma, Y., 2014. Why do firms evade taxes? The role of information sharing and financial sector outreach. The Journal of Finance 69, 763–817.
Blundell, R., Pistaferri, L., Saporta-Eksten, I., 2016. Consumption Inequality and Family Labor Supply. American Economic Review 106, 387–435. doi:10.1257/aer.20121549
Bofondi, M., Gobbi, G., 2006. Informational Barriers to Entry into Credit Markets. Review of Finance 10, 39–67. doi:10.1007/s10679-006-6978-2
Boukhatem, J., 2016. Assessing the Direct Effect of Financial Development on Poverty Reduction in a Panel of Low-and Middle-Income Countries. Research in International Business and Finance 37, 214–230. doi:10.1016/j.ribaf.2015.11.008
Brevoort, K.P., Hannan, T.H., 2007. Commercial Lending and Distance: Evidence from Community Reinvestment Act Data. Journal of Money, Credit, and Banking 38, 1991– 2012. doi:10.1353/mcb.2007.0000
Combes, J.-L., Ebeke, C.H., Maurel, M., Yogo, T.U., 2014. Remittances and Working Poverty. The Journal of Development Studies 50, 1348–1361. doi:10.1080/00220388.2014.940912 Cragg, J.G., Donald, S.G., 1993. Testing Identifiability and Specification in Instrumental
Variable Models. Econometric Theory 9, 222–240.
De Gregorio, J., 1996. Borrowing constraints, human capital accumulation, and growth. Journal of Monetary Economics 37, 49–71. doi:10.1016/0304-3932(95)01234-6
Degryse, H., Ongena, S., 2005. Distance, Lending Relationships, and Competition. The Journal of Finance 60, 231–266. doi:10.1111/j.1540-6261.2005.00729.x
Dollar, D., Kraay, A., 2002. Growth is Good for the Poor. Journal of Economic Growth 7, 195– 225. doi:10.1023/A:1020139631000
Ellis, K., Lemma, A., Rud, J.-P., 2010. Investigating the impact of access to financial services on household investment. Department for International Development (DFID), London, UK.
Fields, G.S., 2012. Working Hard, Working Poor: A Global Journey. Oxford University Press, USA.
Giné, X., Townsend, R.M., 2004. Evaluation of financial liberalization: a general equilibrium model with constrained occupation choice. Journal of Development Economics 74, 269– 307. doi:10.1016/j.jdeveco.2003.03.005
Gobbi, G., Zizza, R., 2007. Does the Underground Economy Hold Back Financial Deepening? Evidence from the Italian Credit Market. doi:10.2139/ssrn.1075182
Guerineau, S., Jacolin, L., 2014. L’inclusion financière en Afrique sub-saharienne : faits stylisés et déterminants. Revue d’économie financière 116, 57–80.
Honohan, P., 2008. Cross-country variation in household access to financial services. Journal of Banking & Finance 32, 2493–2500. doi:10.1016/j.jbankfin.2008.05.004
ILO (Ed.), 2014. Developing with jobs, 2. ed. rev. ed, World of work report. ILO, Geneva.
Inoue, T., Hamori, S., 2012. How has financial deepening affected poverty reduction in India? Empirical analysis using state-level panel data. Applied Financial Economics 22, 395– 408. doi:10.1080/09603107.2011.613764
Jalilian, H., Kirkpatrick, C., 2005. Does Financial Development Contribute to Poverty
Reduction? The Journal of Development Studies 41, 636–656.
doi:10.1080/00220380500092754
Jalilian, H., Kirkpatrick, C., 2002. Financial development and poverty reduction in developing countries. Int. J. Fin. Econ. 7, 97–108. doi:10.1002/ijfe.179
Jayachandran, S., 2006. Selling labor low: Wage responses to productivity shocks in developing countries. Journal of political Economy 114, 538–575.
Jeanneney, S.G., Kpodar, K., 2011. Financial Development and Poverty Reduction: Can There be a Benefit without a Cost? Journal of Development Studies 47, 143–163. doi:10.1080/00220388.2010.506918
Kapsos, S., Bourmpoula, E., 2013. Employment and economic class in the developing world. ILO Research Paper No. 6.
King, R., Rebelo, S., 1999. Resucitating Real Business Cycles (No. Working Paper 7534). National Bureau of Economic Research.
Kleibergen, F., Paap, R., 2006. Generalized reduced rank tests using the singular value
decomposition. Journal of Econometrics 133, 97–126.
Mookerjee, R., Kalipioni, P., 2010. Availability of financial services and income inequality: The evidence from many countries. Emerging Markets Review 11, 404–408. doi:10.1016/j.ememar.2010.07.001
Mundaca, B.G., 2009. Remittances, Financial Market Development, and Economic Growth: The Case of Latin America and the Caribbean. Review of Development Economics 13, 288– 303. doi:10.1111/j.1467-9361.2008.00487.x
Odhiambo, N.M., 2010. Is financial development a spur to poverty reduction? Kenya’s experience. Journal of Economic Studies 37, 343–353. doi:10.1108/01443581011061311 Odhiambo, N.M., 2009. Financial deepening and poverty reduction in Zambia: an empirical
investigation. Int J of Social Economics 37, 41–53. doi:10.1108/03068291011006166 Ravallion, M., Datt, G., 2002. Why has economic growth been more pro-poor in some states of
India than others? Journal of Development Economics 68, 381–400. doi:10.1016/S0304-3878(02)00018-4
Rehman, I.U., Shahbaz, M., 2013. Multivariate-based Granger Causality between Financial Deepening and Poverty: the Case of Pakistan. Qual Quant 48, 3221–3241. doi:10.1007/s11135-013-9952-z
Semykina, A., Wooldridge, J.M., 2010. Estimating panel data models in the presence of endogeneity and selection. Journal of Econometrics 157, 375–380. doi:10.1016/j.jeconom.2010.03.039
Sharif, M., 1991a. Poverty and the forward-falling labor supply function: A microeconomic analysis. World Development 19, 1075–1093. doi:10.1016/0305-750X(91)90126-3
Sharif, M., 1991b. Landholdings, Living Standards, and Labour Supply Functions: Evidence from a Poor Agrarian Economy. Journal of Development Studies 27, 256.
Solt, F., 2014. The Standardized World Income Inequality Database. Working paper SWIID Version 5.0.
Staiger, D., Stock, J.H., 1997. Instrumental Variables Regression with Weak Instruments. Econometrica 65, 557–586. doi:10.2307/2171753
Stock, J.H., Yogo, M., 2005. Testing for weak instruments in linear IV regression. Chapter 5 in Identification and Inference in Econometric Models: Essays in Honor of Thomas J. Rothenberg, edited by DWK Andrews and JH Stock.
Verbeek, M., Nijman, T., 1992. Testing for Selectivity Bias in Panel Data Models. International Economic Review 33, 681–703. doi:10.2307/2527133
Yamada, G., 2008. A Downward-Sloping Labor Supply Curve: The Case of Peru. Review of Development Economics 12, 737–750.
Appendix
Appendix 1. List of countries
Albania; Argentina; Armenia; Azerbaijan; Bangladesh; Belarus; Bolivia; Brazil; Bhutan; Central African Republic; Chile; Colombia; Costa Rica; Dominican Republic; Ecuador; Egypt, Arab Rep.; Georgia; Guatemala; Honduras; Indonesia; India; Iran, Islamic Rep.; Jordan; Kazakhstan; Kyrgyz Republic; Cambodia; Sri Lanka; Moldova; Madagascar; Maldives; Mexico; Macedonia, FYR; Mali; Montenegro; Mongolia; Malawi; Malaysia; Namibia; Niger; Nigeria; Nicaragua; Pakistan; Panama; Peru; Philippines; Paraguay; Russian Federation; Rwanda; Senegal; El Salvador; Serbia; Togo; Thailand; Tajikistan; Tunisia; Turkey; Uganda; Ukraine; Uruguay; Venezuela, RB; Vietnam; South Africa; Zambia.
Appendix 2. First stage regression table results for instrumental variable estimates of the effects of financial access on working poverty (1) (2) (3) (4) (5) (6) (7) (8) (9) (10) Log(Bank branches) Log(Bank branches) Log(Bank branches) Volatility x Bank branches Log(Bank branches ) Bank branches x SSA-region Log(Bank branches) Bank branches x LAC-region Log(Bank branches) Bank branches x Asia GDP volatility -0.020** 0.002 2.049*** -0.020** -0.005*** -0.020** -0.008* -0.020** -0.005** (0.007) (0.008) (0.088) (0.007) (0.001) (0.007) (0.004) (0.007) (0.002) Log(GDP per capita) 0.860*** 0.720*** 0.802*** 4.578*** 0.717*** -0.039* 0.760*** 0.523*** 0.763*** 0.212*** (0.054) (0.068) (0.121) (0.419) (0.082) (0.020) (0.066) (0.077) (0.062) (0.023) Trade openness 0.488** 0.554*** 0.532*** 1.529** 0.498** 0.022* 0.561*** 0.482*** 0.558*** 0.078** (0.193) (0.157) (0.146) (0.489) (0.174) (0.011) (0.162) (0.105) (0.162) (0.026) FDI-to-GDP 0.005 0.004* 0.003 0.015 0.003 0.002* 0.004* 0.001 0.004* -0.003** (0.003) (0.002) (0.003) (0.013) (0.002) (0.001) (0.002) (0.002) (0.002) (0.001) GINI index -0.015** -0.016*** -0.024*** -0.005 -0.018** 0.016*** -0.015*** -0.033*** -0.016*** 0.009*** (0.005) (0.005) (0.007) (0.018) (0.006) (0.002) (0.004) (0.004) (0.005) (0.002) Private credit bureau 0.022*** 0.024*** 0.025*** 0.020 0.017*** -0.003* 0.018*** -0.032*** 0.029*** -0.010*** (0.005) (0.006) (0.005) (0.042) (0.004) (0.001) (0.006) (0.005) (0.008) (0.001) Public credit registry 0.025*** 0.028*** 0.028*** 0.081*** 0.030*** 0.018*** 0.025*** 0.014* 0.025*** 0.010*** (0.006) (0.006) (0.005) (0.022) (0.006) (0.003) (0.007) (0.006) (0.007) (0.001) Private credit bureau x Volatility -0.004*** -0.010*** (0.001) (0.002) Public credit registry x Volatility 0.001 0.015*** (0.001) (0.001) Private credit bureau x SSA 0.092*** 0.158*** (0.023) (0.016) Private credit bureau x LAC 0.012** 0.068*** (0.005) (0.004) Private credit bureau x Asia -0.016** 0.055*** (0.006) (0.004) Observations 294 294 294 294 294 294 294 294 294 294 No of countries 63.000 63.000 63.000 63.000 63.000 63.000 63.000 63.000 63.000 63.000 R-squared 0.266 0.273 0.290 0.847 0.285 0.409 0.274 0.279 0.274 0.493
Appendix 3. First stage regression table results for robustness check, additional control variables (1) (2) (3) (4) (5) (6) Log(Bank branches) Volatility x Bank branches Log(Bank branches) Volatility x Bank branches Log(Bank branches) Volatility x Bank branches GDP volatility 0.002 2.046*** 0.009 2.137*** 0.019 2.174*** (0.008) (0.085) (0.012) (0.065) (0.013) (0.078) Log(GDP per capita) 0.793*** 4.487*** 0.725*** 4.067*** 0.040 -1.001 (0.109) (0.371) (0.107) (0.529) (0.160) (0.609) Trade openness 0.532*** 1.528** 0.617*** 2.343*** 0.594*** 1.985*** (0.142) (0.491) (0.163) (0.484) (0.139) (0.364) FDI-to-GDP 0.003 0.016 -0.001 -0.008 0.001 -0.000 (0.002) (0.012) (0.004) (0.010) (0.004) (0.020) GINI index -0.025*** -0.010 -0.028*** 0.017 -0.028*** -0.037* (0.006) (0.016) (0.007) (0.013) (0.008) (0.020) Ilo dummy -0.038 -0.392*** (0.026) (0.062) L3.Remittances to GDP 0.005* 0.050*** (0.002) (0.010) L.Mobile phone subscription(log) 0.158*** 1.177*** (0.015) (0.100) Private credit bureau 0.026*** 0.033 0.025*** 0.038 0.019** -0.022 (0.005) (0.040) (0.005) (0.032) (0.006) (0.044) Public credit registry 0.028*** 0.078*** 0.030*** 0.100*** 0.018*** -0.001 (0.005) (0.020) (0.005) (0.022) (0.005) (0.023) Private credit bureau x Volatility -0.004*** -0.011*** -0.005*** -0.015*** -0.005*** -0.018*** (0.001) (0.002) (0.001) (0.003) (0.001) (0.002) Public credit registry x Volatility 0.001 0.016*** 0.001 0.015*** 0.001 0.014*** (0.001) (0.001) (0.001) (0.001) (0.001) (0.001) Observations 294 294 275 275 293 293 No of countries 63.000 63.000 58.000 58.000 63.000 63.000 R-squared 0.291 0.848 0.296 0.849 0.331 0.874
Appendix 4. First stage regression tables for test of transmission channel and robustness
check for different poverty line
(1) (2) (3) (4) (5) (6) Log(Bank branches) Log(Bank branches) Volatility x Bank branches Log(Bank branches) Log(Bank branches) Log(Bank branches) GDP volatility -0.020** 0.002 2.049*** -0.033*** -0.020** (0.007) (0.010) (0.100) (0.004) (0.007) Log(GDP per capita) 0.720*** 0.802*** 4.578*** 0.860*** 0.745*** (0.065) (0.138) (0.519) (0.048) (0.066) Trade openness 0.554*** 0.532** 1.529** 0.629*** 0.488** 0.526*** (0.150) (0.187) (0.653) (0.137) (0.174) (0.154) FDI-to-GDP 0.004* 0.003 0.015 0.005*** 0.005* 0.007*** (0.002) (0.003) (0.018) (0.001) (0.002) (0.001) GINI index -0.016*** -0.024*** -0.005 -0.017*** -0.015*** -0.016*** (0.005) (0.007) (0.023) (0.005) (0.004) (0.005) Private credit bureau 0.024*** 0.025*** 0.020 0.038*** 0.022*** 0.024*** (0.005) (0.006) (0.046) (0.004) (0.005) (0.006) Public credit registry 0.028*** 0.028*** 0.081** 0.045*** 0.025*** 0.026*** (0.006) (0.005) (0.029) (0.008) (0.005) (0.006) Private credit bureau x Volatility -0.004*** -0.010*** (0.001) (0.003) Public credit registry x Volatility 0.001 0.015*** (0.001) (0.002) Observations 294 294 294 294 294 297 No of countries 63.000 63.000 63.000 63.000 63.000 63.000 R-squared 0.273 0.290 0.847 0.253 0.266 0.276 Note: Standard errors in parentheses.* p < 0.1, ** p < 0.05, *** p < 0.01
Appendix 5. Testing for attrition bias in the sample
(1) (2)
Dependent variable : working poverty OLS-FE IV-FE
Log(Bank branches) -0.214*** -0.356*
(0.052) (0.177)
Selection indicator (lagged value) -0.017 -0.036
(0.135) (0.025)
Selection indicator (forward value) -0.074 -0.068
(0.100) (0.063)
Observations 314 290
Number of groups 87 63
Joint significance test of selection variables, P-value 0.6580 0.1299
Notes: Robust standard errors in parentheses. The models estimated in columns 1 and 2 include the full set of control variables. In column 2, the number of bank branches per 100,000 adults is instrumented by the existence of private credit bureau and / or public credit registry. ***p < 0.01, **p < 0.05, *p < 0.1.
The procedure (Semykina and Wooldridge, 2010; Verbeek and Nijman, 1992) consists in adding time-varying functions of selection indicators as explanatory variables, and obtaining simple t or joint Wald tests. If we call Si,t the indicator of selection which takes 1 when the dependent variable is observed at each year t and 0 otherwise, we can add Si,t-1, and Si,t+1 in the model for the working poor and test their joint significance. Under the null hypothesis of no attrition bias, the coefficients of these variables (𝜌1 and 𝜌2 ) should not be statistically
different from zero. More formally, the equation to be estimated is: 𝑤𝑝𝑖,𝑡 = 𝜌1𝑆𝑖,𝑡−1+ 𝜌2𝑆𝑖,𝑡+1+ 𝛽1𝑓𝑖𝑛𝑖,𝑡+ 𝑋𝑖,𝑡′ 𝛿 + 𝛼
𝑖 + 𝜀𝑖,𝑡
Regardless of the specifications, the coefficients associated with the lagged and forward “selection” dummy variables are not individually and jointly significant.