HAL Id: inserm-00176120
https://www.hal.inserm.fr/inserm-00176120
Submitted on 2 Oct 2007HAL is a multi-disciplinary open access archive for the deposit and dissemination of sci-entific research documents, whether they are pub-lished or not. The documents may come from teaching and research institutions in France or abroad, or from public or private research centers.
L’archive ouverte pluridisciplinaire HAL, est destinée au dépôt et à la diffusion de documents scientifiques de niveau recherche, publiés ou non, émanant des établissements d’enseignement et de recherche français ou étrangers, des laboratoires publics ou privés.
Relative validity and reproducibility of a French dietary
history questionnaire.
Marti van Liere, François Lucas, Françoise Clavel, Nadia Slimani, Sylvie
Villeminot
To cite this version:
Marti van Liere, François Lucas, Françoise Clavel, Nadia Slimani, Sylvie Villeminot. Relative validity and reproducibility of a French dietary history questionnaire.. International Journal of Epidemiology, Oxford University Press (OUP), 1997, 26 Suppl 1, pp.S128-36. �inserm-00176120�
Relative Validity and Reproducibility of a French Dietary History
Questionnaire
Marti J Van Liere1,* François Lucas1,2, Françoise Clavel1,* Nadia Slimani3 and Sylvie Villemot1
1
Institut Gustave-Roussy, INSERM (Institut National de la Santé et de la Recherche Médicale) Unité 351, 39, Rue Camille Desmoulins, 94805 Villejuif Cedex, France,
2
Department of Psychology, Brooklyn College of CUNY, Brooklyn, NY 11120, USA.
3
IARC, International Agency for Research on Cancer, 150, Cours Albert Thomas, 69372 Lyon Cedex 05, France.
Background. A self-administered dietary history questionnaire, especially developed for use in a large French prospective cohort study, was tested for accuracy of food intake measurement by comparing it to the average of 9–12 24-hour recalls. This questionnaire was structured according to the French meal pattern. An important feature of the questionnaire was the separation into a quantification part and qualification part. The first part quantifies consumption by frequency and portion sizes per food group or food item. The second part provides more detailed qualitative information on separate items within one food group. The total number of food items in the questionnaire was 238.
Methods. The questionnaire was administered twice to 119 study subjects, with an interval of approximately one year (1990–1991). During that year, 24-hour recalls were carried out monthly. Reproducibility and relative validity of the questionnaire were assessed.
Results. The correlation coefficients for reproducibility ranged from 0.40 to 0.74 for foods and from 0.54 to 0.75 for nutrients. The correlation coefficients for relative validity ranged from 0.10 to 0.71 for foods and from 0.29 to 0.81 for nutrients (adjustment for total energy and attenuation for nutrients). Percentage of subjects classified in the same or adjacent quintile by questionnaire as well as by 24-hour recall was on average 76% for foods and 72% for nutrients.
Conclusions. These data indicate that this questionnaire can be used to classify study subjects according to their food or nutrient intake over a one-year period, within a known degree of precision.
Keywords: relative validity, reproducibility, dietary history questionnaire, recall, France, EPIC
The role of dietary factors in the aetiology of different types of cancer is increasingly accepted, although few associations have been reported consistently. One of the bottlenecks of studies focusing on dietary factors is due to the limitations of the methodology used to estimate dietary intake. The choice of one method or another depends not only on the type of information sought but also on the practicality of the method. For large cohorts, a self-administered questionnaire seems the most convenient method when aiming at a description of habitual diet. Although French studies1–3 have been collecting information on food consumption using interviews or food diaries, no self-administered French food questionnaire was available which could be used to gather information from a large number of subjects. A dietary history questionnaire was therefore especially developed for use in a large French cohort study, called E3N (Etude Epidémiologique auprès de Femmes de l’Education Nationale), with 103 809 volunteers who agreed to participate from 1990, and which is part of the European Prospective Investigation into Cancer and Nutrition (EPIC).4 Since it concerns a prospective study on nutrition and cancer for which hypotheses are still open, the questionnaire was designed with the aim of collection of information on all possible foods consumed, avoiding oversimplification of food description and identification typical of short food frequency questionnaires.
*
Reprint requests to: Dr F Clavel.
This is a pre-copy-editing, author-produced PDF of an article accepted for publication in International Journal of Epidemiology following peer review.
The definitive publisher-authenticated version Int J Epidemiol. 1997;26 Suppl 1:S128-36 is available online at: http://ije.oxfordjournals.org/cgi/reprint/26/suppl_1/S128
HAL author manuscript inserm-00176120, version 1
HAL author manuscript
The objective of the present study was to test the accuracy of food intake assessment by the French dietary history questionnaire in order to determine whether the questionnaire is reliable and valid for ranking individuals by dietary and nutrient intake.
STUDY DESIGN Subjects
Female employees (n = 784) of a large anti-cancer hospital (Institut Gustave-Roussy) in Villejuif, aged 36–65 years, were contacted and asked to participate in the study. Of 123 study subjects who were initially enrolled, one died, one moved away and two others dropped out. All study subjects signed a consent form to comply with the rules of the French ethical committee for medical research. The study subjects had an average of 45 years and represented a wide variety of professional categories within the hospital: medical staff, nurses, administrative staff, technicians and researchers. The 15% participation rate suggests that only compliant women who were interested in nutrition participated in the study.
Methods
Dietary history questionnaire. Study subjects were asked to complete two self-administered dietary history
questionnaires at the beginning and end of a one-year study period—starting in May–July 1990. We developed the questionnaire, according to the French meal pattern, in a similar way to the interview method of Péquignot.1,2 Questions were asked about all consumption occasions from breakfast to after-dinner snacks, including in-between meals such as the aperitif before lunch or dinner. Usually two hot meals are eaten per day in France, lunch and dinner, often with similar foods. Another important feature of the questionnaire was the separation into two parts for most food groups of the quantification of food consumption from the description of qualitative aspects of different food items within each food group.
The first part included questions on consumption frequency and portion sizes of 66 food types or items grouped by meal: 38 items for breakfast and in-between snacks, 50 for lunch and dinner, and 13 for aperitifs. For frequency, the following 11 categories were allowed: never or less than once a month, one, two or three times a month and one to seven times a week. Portion sizes were estimated with the help of an album with photos of 42 food items and dishes. Study subjects could choose portions smaller than, equal to or larger than the three portion sizes shown, and indicate the different types of bread or biscuits consumed, as represented by photos. Foods which could not be represented by pictures, were estimated in natural units (e.g. eggs, biscuits, croissants). The second part of the questionnaire contained qualitative questions concerning specific food items within one of the generic food groups which were used in the first part. Study subjects were asked to score their relative consumption frequency for each single food item within the group (four answer categories were allowed: never or seldom, every now and then, regularly, very often). For example, questions in the first part concerned fish as a generic food group whereas the question in the second part concerned the relative consumption frequency of different types of fish such as mackerel, tuna and cod. A weighting factor can be attributed to the nutrient values of different types of fish consumed and applied to the frequency and quantity of fish consumed as mentioned in part 1 of the questionnaire. In this way, combining the first and the second part of the questionnaire, together with the photo album, permitted an increase in the total number of items on which qualitative and quantitative information was available to a total of 238 food items. Specific attention was paid to the fat and sugar content of dairy products consumed by the study subjects as well as to cooking habits concerning the type and quantity of fat used. A complete list of all 66 general food groups is given in Appendix 1. No specific questions were asked about vitamin or mineral supplements.
24-hour recalls. The reference method with which the questionnaire assessments were to be compared consisted
of 12 24-hour recalls carried out monthly, during the year between the first and the second administration of the food questionnaire. Due to holidays or other reasons of absence, some subjects had less than 12 recalls (27% 11 recalls, 6% 10 recalls, 2% 9 recalls). The interviews were carried out by two experienced dieticians, who were specifically trained for this study. In order to ensure consistency of data, each subject was followed by the same dietician during the entire study period. The level of agreement between the first questionnaire and 24-hour recalls according to the interviewer was not assessed. The dieticians were instructed to proceed according to a common protocol agreed with other EPIC countries and consistent with usual practice.5,6 For each subject, the recall days were distributed across the days of the week: Sundays through Thursdays were sampled twice,
Fridays and Saturdays were sampled once. Study subjects were asked to recall what they had eaten the previous day, except for data for Saturdays which were collected on Mondays with data for Sundays. The recall interviews were performed face-to-face without previous notice, except for the Friday recalls which were recalled by telephone on Saturdays, and about which the study subjects were informed in advance.
During the interview, care was taken to identify foods and beverages as precisely as possible and special attention was paid to the quantification of added fats used for cooking and seasoning. Visual aids (household measures, a photo album for 42 foods, and three-dimensional food models for seven foods) were provided in order to estimate portion sizes. The number of portion sizes on photos ranged from 3 to 10, depending on the item represented. For telephone interviews the study subjects were asked to use the photo album which they had received with the first questionnaire, or household measures. Since most subjects had lunch in the hospital cafeteria on working days, average portion sizes were provided by the cafeteria in case a subject could not recall the portion size.
Photographs. Two different albums with photographs of 42 foods and beverages were made by a professional
photographer. The album which was used for the self-administered questionnaire presented 3–5 different portion sizes per item (A, B, and C in increasing order). However, subjects could choose between seven response categories since they could also indicate the consumption of a portion smaller than or larger than each photograph (e.g. ‘smaller than A’, or ‘between A and B’). For the 24-hour recalls the same food items were presented but the number of photos ranged from 3 to 10 portion sizes and the subjects had to choose one of these portion sizes and nothing in between. The subjects’ ability to recognize correct portion sizes with the help of pictures was evaluated in a separate study.7
DATA ANALYSIS
For four study subjects, data from the first administration of the questionnaire were incomplete (n = 115), and this applied to 11 subjects for the second questionnaire (n = 108). For all study subjects an average was calculated from the total number of 24-hour recalls. Conversion of foods into nutrients was carried out using a French food composition table compiled ad hoc for this study which was derived from a major French table,8 the McCance and Widdowson’s food composition table9 and several other published sources. The second part of the questionnaire served to calculate the relative weighting of different food items within a major food group and their contribution to total food intake. A significance test has been carried out on the averages of the differences between the first questionnaire and the 24-hour recalls.
Reproducibility of the questionnaire assessments was estimated by calculating the correlation coefficient between the first and the second questionnaire for each food group and nutrient of interest. An estimate for relative validity of the questionnaire was obtained by calculating the correlation coefficient between the first questionnaire and the average of 9–12 24-hour recalls per subject. Spearman correlation coefficients were used for food groups and Pearson correlation coefficients were used for nutrients. For some nutrients a log transformation was used to obtain a sample distribution of intake values which was closer to normal. For nutrients adjustments for total energy intake and attenuation were carried out. Adjustment for total energy intake was needed because we are interested in whether a correlation found for a nutrient is independent of energy intake and not just because those subjects who eat more, eat more of everything. This adjustment also simulates the type of analyses that will be carried out later for the relation between food intake and disease causation which is independent of factors such as body size, physical activity or individual metabolic efficiency, all related to energy intake.10 A correction for attenuation is carried out in order to adjust for the within-subject random errors of the reference measurements.11,12 However, such corrections are only permitted when the variables follow a normal distribution, as is the case for nutrients.
Relative over- or underestimation of food or nutrient intake as estimated by the questionnaire are expressed as percentages of the intake as estimated by the recalls.
In order to estimate the level of misclassification between the questionnaire and 24-hour recalls data were grouped in a tertile and a quintile classification. Percentage of concordant classification for the same tertile are given, together with concordant classification in the same or adjacent quintile.
RESULTS
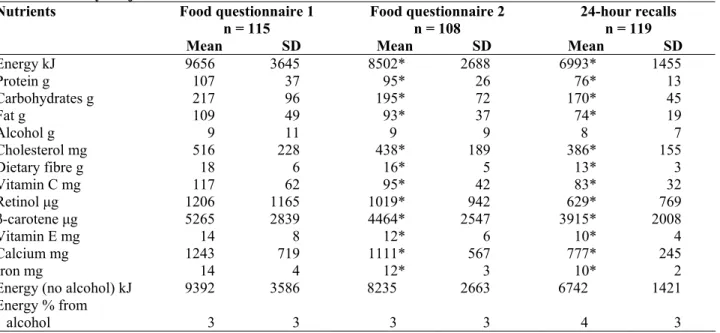
Means of daily consumption of different food group and nutrients as estimated by the first and second administration of the questionnaire and the 24-hour recalls are shown in Tables 1 and 2, respectively. Dietary intakes were generally overestimated by the first questionnaire in comparison to the recalls, both for foods and nutrients. For the 115 subjects with data for both the first questionnaire and the 24-hour recalls, an important average overestimation of 155 g/day was found for dairy products and for non-alcoholic beverages (165 g/day). Food groups with a modest average under- or overestimation were potatoes (–8 g/day), meat (16 g/day), sugar and sweets (0 g/day) and alcoholic beverages (–6 g/day). The overestimation of nutrients seemed to be rather general. Energy was on average overestimated by 2596 kJ/day, protein by 30 g/day and cholesterol by 129 mg/day. Such a systematic overestimation will not interfere when using the dietary questionnaire for ranking subjects according to food consumption.
Table 1. Average daily intake of food groups (in g) as estimated by the first and second questionnaire and by 24-hour
recalls for French study subjects
Foods Food questionnaire 1
n = 115
Food questionnaire 2 n = 108
24-hour recalls
n = 119
Mean SD Mean SD Mean SD
Potatoes 37 32 34 33 45* 32 Vegetables 254 124 221* 111 198* 83 Legumes 11 16 13 18 5* 10 Fruits 197 133 162* 98 166 86 Dairy products 395 287 359 222 239* 132 Cereals 179 106 171 94 137* 49 Meat 141 65 125* 58 123* 43 Fish 37 25 32* 33 28* 18 Eggs 34 28 27* 22 23* 19 Fats 29 28 20* 20 22* 11
Sugar and sweets 34 41 24* 23 34* 21
Cakes 29 42 31 29 39* 28
Non-alcoholic beverages 1425 616 1214* 488 1247* 456
Alcoholic beverages 91 105 93 103 94 80 Seasoning and sauces 18 18 17 15 13* 14
Soups 55 90 61 85 33 51
Mixed dishes 45 58 35 39 11* 13
Miscellaneous 0 0 0 0 1* 3
* Significantly different from the value of the first questionnaire: Signed rank test for foods, Student’s t-test P = 0.05 for nutrients.
Table 2. Average daily intake of nutrients as estimated by the first and second questionnaire and by 24-hour recalls
for French study subjects
Nutrients Food questionnaire 1
n = 115
Food questionnaire 2 n = 108
24-hour recalls n = 119
Mean SD Mean SD Mean SD
Energy kJ 9656 3645 8502* 2688 6993* 1455 Protein g 107 37 95* 26 76* 13 Carbohydrates g 217 96 195* 72 170* 45 Fat g 109 49 93* 37 74* 19 Alcohol g 9 11 9 9 8 7 Cholesterol mg 516 228 438* 189 386* 155 Dietary fibre g 18 6 16* 5 13* 3 Vitamin C mg 117 62 95* 42 83* 32 Retinol μg 1206 1165 1019* 942 629* 769 β-carotene μg 5265 2839 4464* 2547 3915* 2008 Vitamin E mg 14 8 12* 6 10* 4 Calcium mg 1243 719 1111* 567 777* 245 Iron mg 14 4 12* 3 10* 2
Energy (no alcohol) kJ 9392 3586 8235 2663 6742 1421 Energy % from
alcohol 3 3 3 3 4 3
protein 19 4 19 4 18 3 carbohydrate 37 8 38 8 41 6
fat 42 7 41 7 39 4
* Significantly different from the value of the first questionnaire: Signed rank test for foods, Student’s t-test P = 0.05.
Reproducibility as estimated by correlations of intakes between the first questionnaire and the second questionnaire, and relative validity as estimated by correlations of intakes between the first questionnaire and the 24-hour recalls are presented in Table 3. Correlation coefficients for reproducibility range from 0.40 (seasoning and sauces) to 0.74 (fats) for food groups and from 0.54 (vitamin E) to 0.75 (calcium) for nutrients. Correlation coefficients for relative validity range from 0.12 (seasoning and sauces) to 0.71 (alcoholic beverages) for food groups and from 0.28 (iron) to 0.63 (alcohol and carotene) for nutrients. These are uncorrected correlation coefficients. Corrections for attenuation and for total energy intake have been made for nutrients (Table 4). Correlation coefficients adjusted for energy and attenuation range from 0.29 (retinol) to 0.81 (carotene).
Another way to examine the level of agreement in ranking between the two dietary assessment methods is by cross-classification in tertiles or quintiles. Although quintile classification is more precise and therefore preferable, the number of subjects in our study was not always sufficient to fill a 5 x 5 contingency table. Both analyses are shown here to allow comparison with other studies described in the literature (Table 5). The percentage of subjects classified in the same tertile by both methods was 53% for foods and 51% for nutrients. The percentage of subjects classified in the same or the adjacent quintile by questionnaire as well as by 24-hour recall was on average 76% for foods and 72% for nutrients. No gross misclassification (subjects in two tertiles away) occurred.
Table 3. Reproducibility and relative validity of a self-administered dietary history questionnaire for food groups
and nutrientsa
Food groupsb Reproducibility Q1e versus Q2f n = 105 Relative validity 24h recall n = 115 Nutrientsc Reproducibility Q1 versus Q2 n = 105 Relative validity 24h recall n = 115 Potatoes 0.67 0.52 Energy 0.70 0.40 Vegetables 0.64 0.50 Protein 0.69 0.29 Legumes 0.63 0.25 Carbohydrates 0.59 0.42 Fruits 0.59 0.44 Fat 0.73 0.49
Dairy products 0.73 0.67 Alcohold 0.68 0.63 Cereals 0.61 0.56 Cholesterold 0.65 0.46
Meat 0.64 0.43 Dietary fibre 0.59 0.44
Fish 0.51 0.39 Vitamin Cd 0.73 0.55
Eggs 0.57 0.40 Retinold 0.66 0.33
Fats 0.74 0.58 Carotened 0.66 0.63
Sugar and sweets 0.69 0.62 Vitamin Ed 0.54 0.44
Cakes 0.50 0.43 Calcium 0.75 0.38
Non-alcoholic beverages 0.61 0.55 Iron 0.62 0.28 Alcoholic beverages 0.69 0.71 Energy, no alcohol 0.71 0.40 Seasoning and sauces 0.40 0.12 Energy % from 0.78
alcohol 0.75
Soups 0.67 0.41 protein 0.60 0.66 Mixed dishes 0.62 0.10 carbohydrates 0.69 0.59 fat 0.62 0.50
a
95% confidence intervals for N = 110 are: –0.09, 0.28 for r = 0.1; 0.01, 0.37 for r = 0.2; 0.12, 0.46 for r = 0.3; 0.27, 0.54 for r = 0.4; 0.35, 0.63 for r = 0.5; 0.46, 0.71 for r = 0.6; 0.59, 0.79 for r = 0.7; 0.72, 0.86 for r = 0.8; 0.86, 0.93 for r = 0.9.
b
For food groups a Spearman correlation is used. cFor nutrients a Pearson correlation is used. d
Log transformed data. e
Q1 = first questionnaire. f
Q2 = second questionnaire.
DISCUSSION
This study evaluated the reproducibility and relative validity of a self-administered dietary history questionnaire used in the French cohort study which is part of the European Prospective Investigation into Cancer. The questionnaire was developed by us, and was structured according to the French meal pattern. This structure was already used for interviews carried out in another French study.1,2 Boutron13 compared two questionnaires used by a dietician for interviews, one organized by meal and one by food group. The results appeared to be better for the questionnaires organized by meal than by food group.
Table 4. Relative validity of a self-administered dietary history questionnaire; nutrients corrected for attenuation
and energy (Pearson correlation)a
Nutrients Correlation recalls
versus Q1c
Correlation adjusted for attenuation
Correlation adjusted for energy
Correlation adjusted for energy
and attenuation Energy 0.40 0.43 – – Protein 0.29 0.35 0.46 0.56 Carbohydrates 0.42 0.45 0.58 0.64 Fat 0.49 0.55 0.43 0.49 Alcoholb 0.63 0.70 0.65 0.71 Cholesterolb 0.46 0.53 0.54 0.68 Dietary fibre 0.44 0.51 0.61 0.72 Vitamin Cb 0.55 0.63 0.60 0.69 Retinolb 0.33 0.37 0.25 0.29 β-caroteneb 0.63 0.79 0.64 0.81 Vitamin E 0.44 0.49 0.36 0.42 Calcium 0.38 0.42 0.47 0.53 Iron 0.28 0.34 0.49 0.63 Energy % alcohol 0.78 0.86 – – Protein 0.66 0.67 – – carbohydrates 0.59 0.74 – – Fat 0.50 0.60 – – a
95% confidence intervals for N = 110 are: –0.09, 0.28 for r = 0.1; 0.01, 0.37 for r = 0.2; 0.12, 0.46 for r = 0.3; 0.27, 0.54 for r = 0.4; 0.35, 0.63 for r = 0.5; 0.46, 0.71 for r = 0.6; 0.59, 0.79 for r = 0.7; 0.72, 0.86 for r = 0.8; 0.86, 0.93 for r = 0.9.
b
Log transformed data. c
Q1 = First questionnaire.
Table 5. Agreement between classification by intake level by 24-hour recall and by questionnaire
Food groups % of study
subjects classified in same tertile % of study subjects classified in same or adjacent quintile Nutrients % of study subjects classified in same tertile % of study subjects classified in same or adjacent quintile Potatoes 59 76 Energy 51 70 Vegetables 56 75 Protein 47 63
Legumes (pulses)a 46 – Carbohydrates 50 72
Fruits 52 68 Fat 50 72
Dairy products 60 85 Alcohol 66 90
Cereals 60 72 Cholesterol 54 73
Meat 50 70 Dietary fibre 49 73
Fish 46 74 Vitamin C 50 75
Eggs 53 70 Retinol 45 64
Fats 56 76 β-carotene 59 77
Sugar and sweets 66 83 Vitamin E 53 73
Cakes 47 67 Calcium 51 70
Non-alcoholic beverages 58 81 Iron 41 57 Alcoholic beverages 63 90 Energy, no alcohol 48 72
Seasoning and saucesa 46 –
Soupsa 50 –
Mixed dishesa 33 –
Miscellaneousa 56 –
a
These food groups have a large number of non-consumers (>20%) and therefore classes have been defined as follows: class = 1 when consumption = 0; class = 2 when consumption 0–p50, class = 3 when consumption is >p50. It was of no use to classify these variables in quintiles because of the small number of consumers.
All dietary assessment methods have their limitations and do not necessarily provide a true and absolute estimate of food consumption. Comparison of intake estimates with minimal energy requirements provides an indirect indication of bias. Basal metabolic rate (BMR) was calculated using weight according to the equation of Schofield.14 Energy requirements, as given by WHO,14 are 1.56*BMR for light activity level, 1.64*BMR for moderate activity level, and 1.82*BMR for high activity level. Energy intake as estimated in our study by the 24-hour recalls is below the requirements for light activities (1.27*BMR, 95% CI : 1.22–1.32) and below the cutoff point (1.35*BMR) as defined by Goldberg et al.15 whereas the energy intake as estimated by the questionnaire corresponds to requirements for moderate and high activity level (1.76*BMR, 95% CI : 1.64–1.88). No systematic underestimation of food consumption as estimated by the 24-hour recalls was found for subjects with an energy intake below 1.27*BMR when comparing them to subjects with an energy intake of 1.27*BMR and higher. Our reference method seems to be biased and underestimates energy intake. Part of the absolute differences between the 24-hour recall and dietary questionnaire data may be explained by this bias.
Important relative overestimation by the dietary questionnaire of certain food groups, especially dairy products and non-alcoholic beverages, may account for the overestimation of some nutrients (calcium, cholesterol). The overestimation of non-alcoholic beverages may be caused by water consumption which is classified in this group and which is systematically asked in the questionnaire but easily forgotten during the 24-hour recall. No explanation is found for the overestimation of dairy products.
Our study showed a good reproducibility for foods (range: 0.40–0.74) and for nutrients (range: 0.54– 0.75). Reproducibility in other studies does not differ from ours since wide ranges from 0.20 to 0.80 are found.16–
19 An important factor influencing reproducibility is the time period between the two questionnaires. Since some
of the subjects were late in answering the questionnaire, the time span between the two questionnaires was 14– 18 months, which means that the two questionnaires were administered in different seasons.
Relative validity was tested by comparing the first questionnaire with the average of the 24-hour recalls. Although correlations between the second questionnaire and the recalls were generally better (data not shown), it was chosen to focus the statistical analyses for relative validity on the first questionnaire to avoid bias due to a learning effect in the second questionnaire. This situation is closer to the real cohort where subjects do not have any previous experience in quantifying their diet. The crude correlation between questionnaire assessment and mean 24-hour recalls ranged from 0.10 to 0.71 for foods and from 0.28 to 0.78 for nutrients. The lowest correlations were found for foods which are not consumed regularly such as legumes, (pulses) fish or seasoning and sauces. Adjustment for total energy intake and for attenuation improved correlation coefficients for nutrients (range: 0.29–0.81).
Among the validation studies of dietary questionnaires carried out so far, most show correlations ranging from 0.45 to 0.70.18–20 The results of an evaluation of relative validity depend on several factors which have been mentioned by Block.20 These factors include choice of reference method, the degree of homogeneity of intake values within the population, recall period, and the number of days of record collection. The last factor is not relevant provided the sample size is large enough, when values are corrected for attenuation. The reference method used in our study was an average of 9–12 24-hour recalls over a one-year period. Our study population was a group of women with a fairly homogeneous life style, (they were working in the same hospital and often eating in the same cafeteria); this may partly account for the moderate correlations. The large national cohort study is carried out in a more heterogeneous group of 103 809 female volunteers in all regions of France. However, the study populations of both the validation study and the cohort study consist of women aged 40–65 years with a comparable level of education. Response rate was also comparable for the two populations (validation study: 15%, cohort study: 20%).
Despite some overestimations in both foods and nutrients by the questionnaire, agreement in classification is comparable to what other studies have shown. Classification in the same tertile shows a mean of over 50% agreement21 and classification in the same or next quintile shows an agreement of over 70% agreement.22,23
Study subjects classified as non-consumers were compared for both methods (data not shown). Because the recall covered at most 12 days of the year, foods eaten with a frequency of less than once in 12 days, such as legumes, were missed in the recalls but not in the questionnaire. On the other hand, underreporting in the questionnaire occurred when people did not report consumption of some foods, but did consume them during one of the recall days. Food groups such as sugar and sweets or alcoholic beverages, which are considered by the subjects as socially undesirable can be underestimated in this way.
This study reveals the errors involved in the use of the dietary history questionnaire. It can be concluded that the questionnaire can be used to classify study subjects according to their food or nutrient intake over a one-year period. It is important to note that this methodological study was carried out before starting the real cohort and it was therefore possible to make several changes in the structure and the layout of the questionnaire suggested by the results of the relative validity study. Instructions to fill out the questionnaire were more detailed in the final version of the questionnaire. The picture book for portion size quantification has been printed by professionals and several pictures have been revised. Some foods have been deleted or combined in one item and the final questionnaire contains 202 food items. The effect of these changes on the validity and reproducibility of the questionnaire has not been tested.
This questionnaire has been sent to those study subjects of the cohort study having answered the first two questionnaires and data analysis started in 1996.
Acknowledgements
This research was financially supported by the National and Departmental League against Cancer, the Europe against Cancer programme of the European Community, the MGEN (Mutuelle Génerale de l’Education Nationale), HCEIA, 3M and Astra-Calvé. The authors would like to thank Corinne Casagrande, Michelle Deheeger, Hélène Goulard, Bertrand Hémon, Rudolf Kaaks, Michelle Legrand and Maryvonne Niravong for their assistance.
References
1. Péquignot G, Tuyns A J, Riboli E, Lowenfels A. Résultats d’une enquête alimentaire dans le Calvados. Ration alimentaire, consommation de tabac et d’alcool. Gastroenterol Clin Biol 1985; 9: 422–33.
2. Péquignot G, Cubeau J. Enquêtes méthodologiques comparant chez les mêmes sujets la consommation alimentaire appréciée par interrogatoire à la consommation mesurée par pesée. Rev Epidemiol Méd Soc Santé Publique 1973;
21: 585–608.
3. Monica-France, Nicaud V, Ducimetière P (eds). Facteurs sociogéographiques influençant l’équilibre nutritionnel et la consommation de grandes classes d’aliments. Cah Nutri Diét 1990; 25: 347–54.
4. Riboli E. Nutrition and Cancer: Background and rationale of the European Prospective Investigation into Cancer and Nutrition (EPIC). Ann Oncol 1992; 3: 783–91.
5. Callmer E, Hagman U, Haraldsdóttir J, Löken E B, Seppanen R, Trygg K. Proposal for the standardisation of 24-hour recall and similar interview methods. Vär Föda1986; 4 (Suppl.): 259–70.
6. Cameron M E, van Staveren W A. Manual on Methodology for Food Consumption Studies. New York: Oxford University Press, 1988.
7. Lucas F, Niravong M, Villeminot S, Kaaks R, Clavel-Chapelon F. Estimation of food portion size using photographs: Relative validity, strengths, weaknesses and recommendations. J Hum Nutr Diet 1995; 8: 65–74. 8. Feinberg M, Favier J C, Ireland-Ripert J. Répertoire Géneral des Aliments. Paris: INRA, CIQUAL, Technique et
Documentation, Lavoisier, 1991.
9. Paul A A, Southgate D A T. McCance & Widdowson’s the Food Composition of Foods. 4th Edition MRC Special
Report No. 297. Amsterdam, New York, Oxford: Elsevier, North-Holland, Biomedia Press, 1976.
10. Willett W C, Stampfer M J. Total energy intake: implications for epidemiological analyses. Am J Epidemiol 1986;
124: 17–27.
11. Rosner B, Willett W C. Interval estimates for correlation coefficients corrected for within-person variation: implications for study design and hypothesis testing. Am J Epidemiol 1988; 127: 377–86.
12. Beaton G H, Milner J, Corey P et al. Sources of variance in 24-hour dietary recall data: implications for nutrition study design and interpretation. Am J Clin Nutr 1979; 32: 2546–59.
13. Boutron M C, Faivre J, Milan C, Lorcerie B, Estève J. A comparison of two diet history questionnaires that measure usual food intake. Nutr Cancer 1989; 12: 83–91.
14. World Health Organization. Energy and Protein Requirements. Technical Report Series No. 724. Geneva: WHO, 1985.
15. Goldberg G R, Black A E, Jebb S A et al. Critical evaluation of energy intake data using fundamental principles of energy physiology 1. Derivation of cut-off limits to identify underrecording. Eur J Clin Nutr 1991; 45: 569–81. 16. Jacobsen B K, Bönaa K H. The reproducibility of dietary data from a self-administered questionnaire: The Tromsö
study. Int J Epidemiol 1990; 19: 349–53.
17. Nomura A, Hankin J H, Rhoads G G. The reproducibility of dietary intake data in a prospective study of gastrointestinal cancer. Am J Clin Nutr 1976; 29: 1432–36.
18. Salvini S, Hunter D J, Sampson L et al. Food-based validation of a dietary questionnaire: the effects of week-to-week variation in food consumption. Int J Epidemiol 1989; 18: 858–67.
19. Rimm E B, Giovannucci E L, Stampfer M J, Colditz G A, Litin L B, Willett W C. Reproducibility and relative validity of an expanded self-administered semiquantitative food frequency questionnaire among male health professionals. Am J Epidemiol 1992; 135: 1114–26.
20. Block G, Woods M, Potosky A, Clifford C. Validation of a selfadministered diet history questionnaire using multiple diet records. J Clin Epidemiol 1990; 43: 1327–35.
21. Jain M G, Harrison L, Howe G R, Miller A B. Evaluation of a self-administered dietary questionnaire for use in a cohort study. Am J Clin Nutr 1982; 36: 931–35.
22. Pietinen P, Hartman A M, Haapa E et al. Reproducibility and relative validity of dietary assessment instruments. II. A qualitative food frequency questionnaire. Am J Epidemiol 1988; 128: 667–76.
23. Willett W C, Simpson L, Stampfer M J. Reproducibility and relative validity of a semiquantitative food frequency questionnaire. Am J Epidemiol 1985; 122: 51–65.
APPENDIX
Foods and food groups mentioned in first part of the French dietary history questionnaire
No. Food No. Food
1 water 34 port, martini, etc 2 fruit juice 35 punch, cocktail
3 sodas 36 whiskey, gin, etc
4 fruits 37 pastis
5 chicory 38 brandy, rum
6 coffee with milk/black coffee 39 olives
7 tea 40 salty biscuits
8 chocolate drink 41 cheese cubes
9 milk 42 soup
10 bread 43 green salad
11 crackers 44 composed salad 12 butter, margarine 45 fish conserves
13 cereals 46 shellfish
14 croissants 47 sausage, hot meal
15 biscuits 48 fish
16 jam, honey 49 liver
17 yoghurt 50 other offals
18 fresh cheese 51 meat
19 ‘petit suisse’ 52 pizza, quiche, etc 20 cream dessert 53 sandwich, hamburger, etc 21 dried fruits 54 salty pancakes
22 nuts 55 pasta
23 chocolate bars 56 rice 24 chocolate 57 french fries
25 bonbons 58 potatoes
26 boiled egg/fried egg 59 legumes (pulses)
27 ham 60 vegetables
28 sausage, cold meat product 61 cream cakes
29 paté 62 fruit pie
30 cheese 63 other pies
31 beer 64 canned fruits
32 cider 65 sweet pancakes
33 wine 66 milk dessert (rice pudding etc)
Foods mentioned only in second part
sugar/sweetener onions
salt red peppers
pepper salad dressing
garlic cooking fats