Design and Build of Artificial Blood Vessels with Variable Compliance
byEmily Cimmino
Submitted to the Department of Mechanical Engineering in Partial Fulfillment of the Requirements for the Degree of
Bachelor of Science in Mechanical Engineering at the
Massachusetts Institute of Technology
June 2019
C2019 Massachusetts Institute of Technology. All rights reserved.
Signature of A uthor: ...
Sig
Certified by: ...Signature redacted
Departmet of Mechanical Engineeringnature redacted
Ellen Roche sistant Professor of Mechanical Engineering
Thesis Supervisor
C ertified b y : ...
Maria Yang Professor of Mechanical Engineering Undergraduate Officer *3 MASSACHUSETTS INSTITUTE' OF TECHNOLOGY
JUL 16
2019
Signature
reaactea
Design and Build of Artificial Blood Vessels with Variable Compliance
by
Emily Cimmino
Submitted to the Department of Mechanical Engineering on May 10, 2019 in Partial Fulfillment of the
Requirements for the Degree of
Bachelor of Science in Mechanical Engineering
ABSTRACT
To more accurately recreate hemodynamic conditions in a benchtop circulatory simulator, it is important to develop artificial blood vessels with tunable mechanical characteristics. These vessels simulate the varying properties of blood vessels at different regions within the circulatory system
by mimicking the compliance and therefore recreating physiological flow velocities and pressure
waveforms. The compliance of a blood vessel defines how its volume will change in response to a pressure change. This project recreates variable compliance through a mechanism called laminar jamming, which utilizes friction between layers to tune the stiffness of a composite material. In the first experiment, a sample of composites with a wide range of materials and designs were tested, and looped materials exhibited behavior most similar to the mechanics of blood vessels. In the second experiment, a sample of looped materials was tested to further characterize the effects of different parameters on the composite's response to laminar jamming. Finally, in the third experiment, laminar jamming was applied to a tubular composite to mimic the shape of a blood vessel, and changes in the artificial vessel's compliance were observed through its volume-pressure relationship. These artificial vessels will be incorporated into a benchtop circulatory simulator to mimic disease physiology and evaluate cardiovascular support devices.
Thesis Supervisor: Ellen Roche
Acknowledgments
I would like to thank Dr. Ellen Roche, Markus Horvath, and the Therapeutic Technology
Design & Development lab for providing guidance, support, and invaluable mentorship throughout this project.
Table of Contents Abstract 2 Acknowledgements 3 Table of Contents 4 List of Figures 5 List of Tables 7 1. Introduction 8 2. Background 8
2.1 Blood Vessel Compliance 8
2.2 Structural Characteristics of Blood Vessels 11
2.3 Artificial Blood Vessels 12
2.4 Laminar Jamming 13
2.5 Laminar Jamming to Control Material Elasticity 15
3. Experimental Design 16 3.1 Experiment 1 16 3.2 Experiment 2 25 3.3 Experiment 3 28 4. Results 32 4.1 Experiment 1 32 4.2 Experiment 2 37 4.3 Experiment 3 42 5. Discussion 44 6. Conclusion 47 7. Appendices 48
Appendix A: Matlab Script for Data Analysis 48
List of Figures
Figure 1: Volume-pressure curves for aorta and vena cava 9
Figure 2: Aortic volume-pressure curves for different ages 10
Figure 3: Three layers of the aortic wall 11
Figure 4: Representative stress-strain curve of aorta 12
Figure 5: Illustration of laminar jamming mechanism 14
Figure 6: Sample of patterns tested in Experiment 1 17
Figure 7: Process to fabricate silicone membranes 19
Figure 8: Process to combine silicone membranes and inner materials 20
Figure 9: Schematic of pouch manufacturing process 21
Figure 10: Final silicone pouches before separating 22
Figure 11: Completed pouch with tube fitting 22
Figure 12: Instron setup for Experiment 1 24
Figure 13: Warp vs. weft stitches 26
Figure 14: Thread elasticities compared in Experiment 2 26
Figure 15: Yarn thicknesses compared in Experiment 2 26
Figure 16: Loop sizes compared in Experiment 2 26
Figure 17: Stitch orientations compared in Experiment 2 27
Figure 18: Process to create knit tubes 28
Figure 19: Process to enclose knit tubes in silicone pouch 29
Figure 20: Setup for Experiment 3 30
Figure 21: Data analysis in Experiment 3 31
Figure 22: Warp wool fibers response in Experiment 1 32
Figure 23: Weft wool fibers response in Experiment 1 33
Figure 24: Looped wool response in Experiment 1 33
Figure 25: Looped wool with layered wool response in Experiment 1 34
Figure 26: Meandering elastic thread response in Experiment 1 34
Figure 27: Meandering elastic thread with layered wool response in Experiment 1 35
Figure 28: Vertical mesh response in Experiment 1 35
Figure 32: Effect of yam elasticity in Experiment 2 39
Figure 31: Effect of yam thickness in Experiment 2 41
Figure 34: Volume-pressure curves obtained from Experiment 3 42
List of Tables
Table 1: Summary of 22 material-design combinations tested in Experiment 1 18
1. Introduction
The cardiovascular system consists of the heart, blood, and blood vessels that work together to provide oxygenated blood to the entire body. The system is characterized by complex
interactions between physiological processes and control mechanisms to identify and respond to the body's needs [1]. Scientists and engineers have sought to create models of the cardiovascular
system, a difficult task due to the complexity of the system. For instance, lumped parameter models are often used as mathematical tools to model the cardiovascular system [1].
While many properties of the cardiovascular system can be accurately modelled
mathematically, some properties remain difficult to recreate in a benchtop model. Blood vessel compliance is one such property. Compliance is an important property of blood vessels because
it allows them to expand and contract in order to regulate blood flow throughout the body. This property is well understood, but benchtop models currently lack the tools to recreate blood vessels of variable compliance.
Therefore, the goal of this project is to design and build a benchtop model of blood vessels with tunable compliance. These vessels will simulate the varying properties of blood vessels at different regions within the circulatory system by mimicking the compliance and therefore recreating physiological flow velocities and pressure waveforms. These artificial vessels will ultimately be incorporated into a benchtop circulatory simulator to mimic disease physiology and evaluate cardiovascular support devices.
2. Background
2.1 Blood Vessel Compliance
An important property of blood vessels is their ability to expand and contract in response to changes in transmural pressure, the pressure difference across the vessel wall. This property is known as vessel compliance, and is defined as the change in volume, AV, divided by the change in transmural pressure, AP [2].
AV
Compliance is a crucial property of blood vessels as it allows for regulation of blood flow through the body. Blood flow from the heart is pulsatile - if blood vessels were entirely rigid, blood flow throughout the body would also be pulsatile, and a significant amount of energy would be lost as blood flowed from the heart to remote vessels. Instead, compliance allows blood vessels to convert pulsatile to continuous flow. Capillaries, the smallest blood vessels in the body, are optimized for continuous flow to allow for better diffusion properties.
The compliance of a vessel can be determined from the slope of its volume-pressure curve. In a healthy human body, these curves are typically not linear - compliance decreases as pressure increases, meaning vessels get stiffer as they expand.
Vessel compliance varies significantly throughout the cardiovascular system according to the location and specific function of each type of vessel. Veins, known as "capacitance vessels" because they store 70% of total blood volume in the body, are thirty times more compliant than arteries [2]. In contrast, the main function of arteries, known as "resistance vessels", is to regulate resistance in the peripheral vasculature in order to regulate blood pressure and flow; therefore, arteries are smaller in diameter and less compliant than veins. The vast differences in vessel compliance are shown in Figure 1, which displays shows volume-pressure curves for varying vessel dimensions in the venous and aortic vasculature (note the difference in pressure scale).
4-0
0
( 3 Aorta Vena cava
Z CD
0
2-I I I I
0 80 160 240 300 0 8 16 24
Transmural Pressure in cns of water
There are several factors that can alter blood vessel compliance. As illustrated in Figure 2, compliance decreases with age. This can be attributed to elastin thinning and increased collagen deposition with age [4]. Furthermore, cardiovascular disease can lead to damage of blood vessel walls and alter vessel compliance. Hypertension and atherosclerosis can alter arterial wall structure, leading to an increase in blood pressure and decrease in compliance [4]. These physiological changes can be augmented by lifestyle decisions like diet and smoking, which accelerates blood vessel damage and leads to a reduction in compliance.
Compliance can also be adversely affected by interventions intended to improve a patient's cardiovascular health, such as drug administration and implants. Vasodilatory drugs often decrease blood pressure, which will in turn affect compliance [4]. Any implants or devices in the blood vessel, such as a catheter or stent, may cause damage to the arterial walls and lead to decreased compliance. 275 -2-24 yn 250-225 -. 1 00 -7 -7 175 -3642yn 0 125 -S 100_ 17 75 75 50-25 0 25 50 75 100 125 150 175 200 225 Pressure - mmHg
Figure 2: Aortic volume-pressure curves obtained from human autopsies at different ages. Slope of
2.2 Structural Characteristics of Blood Vessels
cob
Figure 3: Three layers of the aortic wall - intima, media, and adventitia [6]
The mechanical behavior of human tissue is governed by the tissue microstructure. The walls of the aorta are comprised of three main components - collagen fibrils, elastic fibers, and
vascular smooth muscle cells [7]. These components make up three concentric layers of the aortic walls as illustrated in Figure 3 - the intima, media, and adventitia, from innermost to outermost. The mechanical behavior of the aortic wall is governed by the media. This layer is comprised of collagen fibrils and smooth muscle cells sandwiched between elastic fibers. These repeating sandwiched units, called medial lamellar units (MLU), store elastic energy and drive recoil of the aortic walls, allowing for smooth flow even at high pressures [7].
Blood vessels exhibit overall non-linear stress-strain behavior, but their response can be
divided into two relatively linear regions [6]. At low strains, the effective modulus is in the range of 0.2-0.6 MPa, and mechanical behavior in this regime is dominated by the stretching of elastin fibrils. The response of vessels under physiological pressures tends to fall within this regime. At high strains (usually over 50%), the effective modulus is higher, on the order of 2-6 MPa, and the
1.2
Young's Elastic Modulus (E = air) 1.0 0.8 0.6 0.4 0.2 Low Strain Aa Region I --0 01 02 03 04 06 08 01 00 1201 40 Strain (%)
Figure 4: Representative stress-strain curve of human aorta. Effective modulus can be obtained
from the slope of the curve. Low effective modulus in low strain region as elastin fibrils are stretched. Higher effective modulus in high strain region as stiffer collagen fibers are stretched [6].
Blood vessels exhibit viscoelastic behavior, meaning they exhibit properties of both a viscous liquid and an elastic solid. Studies have shown that the elastic properties of blood vessels are largely due to elastin, while collagen has been found to contribute to viscous behavior.
Elastin fibers are easily stretched, while collagen fibers are much stiffer.
Collagen consists of both flexible and rigid regions. When in tension, the flexible regions elongate first, contributing to the vessel's elastic response. At high strains, when the flexible regions are fully elongated, the rigid regions prevent the vessel from further elongating. The presence of this rigid region in collagen contributes to the higher effective modulus of blood vessels at high strains - the more a vessel expands, the stiffer it becomes.
2.3 Artificial Blood Vessels
Engineers and scientists have been striving to recreate blood vessels for decades through various methods. The reason for engineered blood vessels is based on clinical needs, such as the fabrication of vascular grafts for bypass procedures, as well as benchtpo models to test medical devices and safety of procedures. Compliance is a key determinant of graft success; a
compliance mismatch between native vessels and grafts can disrupt blood flow and lead to premature graft failure. Historically, synthetic grafts such as polyethylene terephthalate graft (PET, Dacron@) and poly-tetrafluoroethylene (PTFE, Goretex@) have been used; however,
many studies found that these grafts ultimately failed, due to a foreign body reaction and thrombosis or compliance mismatch with the native vessels [8].
To develop improved artificial blood vessels, tissue engineering techniques have been utilized. Synthetic biodegradable polymers such as poly(glycolic acid), poly(lactic acid), and poly(caprolactone) are extensively used to build vascular scaffolds. They are often still limited in their mechanical integrity and mismatch with native vessels; researchers are currently building multi-layer scaffolds to improve the mechanical properties [8]. Electrospun vascular grafts have
also been developed to better match the compliance of native vessels and improve clinical outcomes. Compliance in these technologies is tuned by altering the material chemistry and graft microarchitecture [9].
Despite these biological techniques to build blood vessels, there are no benchtop models that allow for non-biological fabrication of vessels that can be tuned to recreate physiological properties. Incorporating these vessels into benchtop flow loops could be used to simulate
different disease states or mimic the physiology of patients of different ages. These vessels could also be used for benchtop testing of medical device prototypes and medical devices with
adjustable mechanics to the individual patient.
2.4 Laminar Jamming
The method explored in this project to create elements of variable compliance involves techniques of laminar jamming. Laminarjamming, also known as "layer jamming", is a mechanism which can manipulate the mechanical properties of a material and tune its bending stiffness. It consists of applying a vacuum to a composite material. The vacuum acts as a normal force between the layers of the jamming mechanism which increases friction, as the layers are now 'jammed' together. During bending of the composite material, the individual layers have to slide on top of each other depending on the bending radius. By increasing friction between layers of the composite, this relative displacement is reduced which results in an elevated bending stiffness of the system. After releasing the vacuum, the layers are free to slide past one another, making the composite more flexible again [10].
P
FF
L
Figure 5: Illustration of laminar jamming mechanism [10]
Figure 5 illustrates this jamming mechanism. There are n layers of a material with coefficient of friction p, overlapping over length L and width w. When a vacuum pressure P is applied to this composite, the maximum tensile force to stretch this element is given by equation 2. The resisting force, and therefore the effective bending modulus of the material composite, can be altered by changing any of these variables.
F= y *n*P*w*L (2)
Laminar jamming is an emerging technology in the field of soft robotics. Both soft machines and traditional rigid robotics have distinct benefits and limitations. Soft machines made of compliant materials are able to deform to complex shapes and interact safely with the body, while traditional rigid robotics made of stiff materials can resist deformation, apply high forces, and perform tasks precisely. Researchers are trying to create more versatile robots with tunable stiffness that can selectively function as either soft or rigid robots. However, most current technologies to create tunable stiffness either cannot be tuned to a wide stiffness range, have low tuning resolution, or transition slowly between states of varied stiffness. Variable-damping mechanisms, often hydraulic or electromagnetic, are heavy, expensive, and difficult to manufacture [11].
Laminar jamming is a promising alternative because it can achieve a wide range of stiffnesses, be tuned to precise stiffnesses, and be actuated quickly. In contrast to other
mechanisms to achieve variable stiffness, laminar jamming is lightweight, low-cost, and simple to manufacture [11]. Laminar jamming has been applied in haptics, medical devices,
build wearables and garments that can support injured body parts and restrict motion to prevent overexertion. As the patient recovers, the stiffness of the garments can be altered to expand the allowed movement and help the patient regain full mobility [13].
2.5 Laminar Jamming to Control Material Elasticity
Current applications of laminar jamming allow for adjustment of the material's bending stiffness. Applying similar design approaches in a tubular structure will allow for creation of engineered vessels with variable compliance. Unlike previous research on variable bending stiffness due to laminar jamming, testing in this project will focus on stretching properties of the jammed composite. The goal of this project is to create vessels with adjustable compliance to use
in physiological modeling of vascular trees in order to mimic disease physiology and test medical devices.
3. Experimental Design
3.1 Experiment 1: Tensile testing for broad exploration of designs and materials Goals:
Determine whether laminar jamming is an effective mechanism for altering the effective modulus of a material.
Identify the most promising designs and materials to pursue in future experiments to recreate blood vessels.
Hypothesis:
A composite's response to laminar jamming depends on the jammed material, the
geometry of the jammed material, the number of jammed layers, and the presence of a decoupling layer.
In the first experiment, it was necessary to determine whether laminar jamming was a feasible and effective mechanism for altering the effective modulus of a material. Previous mechanical testing on jammed materials had focused on bending stiffness, but no prior research has been published on how laminar jamming affects the effective modulus of a material in tension.
Material and Design Selection
Based on the mechanism of laminar jamming, where the tensile force is given by F = M *
n * P * w * L (Section 2.4), the hypothesis was that a composite's response to jamming may be
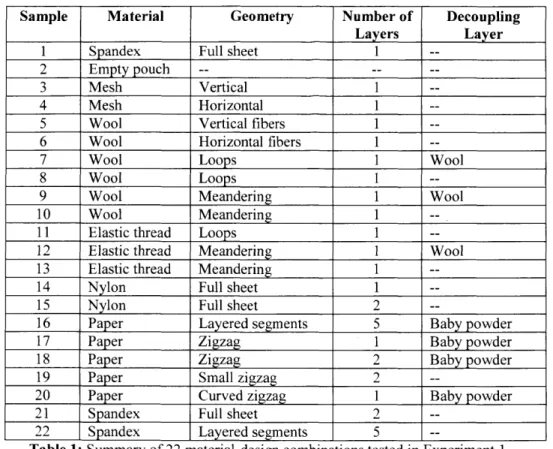
influenced by four variables: the jammed material, the geometry of the jammed material, the number of jammed layers, and the presence of a decoupling layer. A variety of designs and materials were selected for testing in order to answer the following questions. A full summary of the 22 material-design combinations tested in Experiment 1 can be found in Table 1.
1. How does the
jammed
material affect the composite's response to laminar jamming?a. 6 materials with different elastic material properties were tested: i. Spandex
iii. Mesh
iv. Wool
v. Elastic thread vi. Paper
2. How does the geometry of the jammed material affect the composite's response to laminar jamming?
a. 7 geometries tested:
i. Looped ii. Meandering
iii. Zigzag iv. Full sheet
v. Layered segments vi. Warp fibers vii. Weft fibers
3. How do the number ofJammed layers affect the composite's response to laminar jamming?
a. Number of layers tested: i. One
ii. Two
4. How does the presence of a decoupling layer between the jammed material and the silicone membrane affect the composite's response to laminar jamming?
a. 2 decoupling layers tested:
i. Wool
ii. Baby powder
a) b) c) d) e) f)
Figure 6: Sample of patterns tested in Experiment 1. (a) Wool, warp fibers. (b) Looped wool. (c)
Looped wool with weft wool decoupling layer. (d) Meandering wool. (e) Meandering elastic thread.
Sample Material Geometry Number of Decoupling
Layers Layer
1 Spandex Full sheet 1
--2 Empty pouch -- --
--3 Mesh Vertical 1
--4 Mesh Horizontal 1
--5 Wool Vertical fibers 1
--6 Wool Horizontal fibers 1
--7 Wool Loops 1 Wool
8 Wool Loops 1
--9 Wool Meandering 1 Wool
10 Wool Meandering 1
--11 Elastic thread Loops 1
--12 Elastic thread Meandering 1 Wool 13 Elastic thread Meandering 1
--14 Nylon Full sheet 1
--15 Nylon Full sheet 2
--16 Paper Layered segments 5 Baby powder
17 Paper Zigzag 1 Baby powder
18 Paper Zigzag 2 Baby powder
19 Paper Small zigzag 2
--20 Paper Curved zigzag 1 Baby powder
21 Spandex Full sheet 2
--22 Spandex Layered segments 5
--Table 1: Summary of 22 material-design combinations tested in Experiment 1
Pouch Manufacturing Method:
To compare jamming designs, it was necessary to manufacture pouches that could be jammed in a standardized way. The following method was developed to create silicone pouches of 30x8Omm.
I. Creating silicone membranes (Figure 7) 1. Prepare two-component silicone.
a. Combine 8g of each part of Ecoflex 00-30 silicone in a small cup.
b. Spin down for 1 minute in centrifugal mixer at 2000rpm to ensure thorough mixing
and degassing of the two parts.
2. Pour silicone mixture onto a clean, flat acrylic board (Figure 7a).
3. Use a custom-made film applicator to create a flat silicone sheet of uniform thickness (300 micrometers) (Figure 7b).
4. Put in the oven at 60'C and let cure for 30 minutes.
a)
Figure 7: Process to fabricate silicone membranes. (a) After mixing silicone, pour onto a clean, flat
acrylic board. (b) Slowly glide over the silicone with the handle to create a flat sheet of uniform thickness.
II. Combining silicone membranes and inner materials (Figures 8 and 9) 1. Remove silicone sheets from the oven.
2. Use a blade to remove 5mm from each side of the sheet on the board (Figure 8a).
3. Lay down tape along each cut edge to create a 50 micrometer offset for the film
applicator (Figure 8b).
4. Lay down the custom positioning frame centrally on the silicone sheet and place four paper sheets in the windows of the frame (Figure 8c).
5. Remove positioning frame, leaving the paper sheets stuck to the silicone (Figure 8d).
6. Prepare more uncured silicone: Combine 6g of each part of Smooth-On EcoFlex 00-30
silicone in a small cup.
7. Spin down for 1 minute in centrifugal mixer at 2000rpm to ensure thorough mixing and
degassing of the two parts.
8. Pour liquid silicone on top of paper sheets and spread it across the entire silicone sheet
using the custom film applicator (Figure 8e).
9. Remove paper sheets with tweezers leaving the underlying parts of the silicone free of
uncured silicone (Figure 8f).
10. Lay down inner materials in dry windows that paper sheets were removed from (Figure 8g).
11. Lay down the 2nd completely cured silicone sheet that was set aside, making sure to align
it with the edges of the underlying silicone sheet, and covering all inner materials (Figure b)
12. Lay down positioning frame on top of the composite, in the same position that it was aligned before (Figure 8i).
13. Sandwich the aperture in additional acrylic sheets and compress them for curing with
binder clips along the edges (Figure 8j). 14. Allow the composite to cure for 24 hours.
b) g) c) h) d) i) j)
Figure 8: Process to combine silicone membranes and inner materials. (a) Use a blade to remove
5mm from each side of the sheet on the board. (b) Lay down tape along each cut edge. (c) Lay down positioning frame and four paper sheets in the windows. (d) Remove positioning frame, leaving paper sheets stuck to the silicone. (e) Pour uncured silicone on top of paper sheets and glide over with custom film applicator. (f) Remove paper sheets with tweezers. (g) Lay down inner materials in windows. (h) Lay down the other cured silicone sheet on top. (i) Lay down the positioning frame on top of the composite. (j) Fasten the entire composite with 10 binder clips along the edges. a)
a) b) C) d) e) f) g) Support base Cured silicone sheet
Paper masking sheet Positioning frame Uncured silicone Inner material
Figure 9: Schematic of pouch manufacturing process: side view, step by step, layer by layer. (a)
Cured first silicone sheet on support base. (b) Lay down positioning frame and paper masking sheets inside. (c) Remove positioning frame, leaving masking sheets stuck to the silicone. (d) Second uncured silicone layer on top of cured base silicone layer and masking sheets. (e) Remove paper masking sheets. (f) Lay down inner materials for jamming in place of masking sheets. (g) Seal with
cured silicone sheet on top.
III. Creating the pouches (Figure 10)
1. Remove the binder clips and carefully peel the silicone composite from the acrylic
boards.
2. Separate the pouches by carefully cutting along the centerlines.
3. Trim along the edges of the silicone pouches if there is excessive silicone, making sure
not to cut too deeply into the pouch. 4. Cut a small slit on one side of the pouch.
5. Insert tube fittings (Figure 11).
6. Seal the tube fitting to the silicone pouch using Smooth-On Sil-Poxy. '7
Figure 10: Final silicone pouches before separating.
a) b)
Figure 11: Completed pouch with tube fitting (a) for attachment to vacuum line (b).
Tensile Testing Method
The following tensile test method was developed and executed on each of the 22 pouches manufactured:
I. Instron setup
1. Install 2kN load cell and screw side-action grips in Instron.
2. Create a tensile test method with a crosshead speed of 500 mm/min (according to
ASTM standard D412 for Tension Testing of Rubbers and Elastomers) and the end of
test at 6N. (This force was chosen to keep testing within a physiologically relevant range (four times higher than the physiological force of 1.4N in the aorta determined
II. Sample setup
1. Measure the starting dimensions (length and width) of the pouch (not including
excess silicone on the edges).
2. Position four wooden sticks to sandwich the silicone material safely between the clamps of the tensile tester, making sure to clamp the edges of the inner material for a firm grip to avoid tearing.
3. Use four binder clips to clamp the wooden sticks on both ends.
4. Use calipers to measure the clamped length and record.
5. Align the center of the pouch with the top clamps on the Instron and use an allen key to fasten securely.
6. Attach the vacuum tube to the vacuum port on the pouch.
7. Balance the force on the Instron without any load on the load cell. 8. Turn on the vacuum.
9. Raise or lower Instron crosshead as necessary to align the bottom of the pouch with
the bottom clamps.
10. Use an allen key to fasten bottom clamps securely.
III. Test Execution
1. Raise or lower the Instron crosshead until the force reads ON.
2. Zero the displacement on the Instron.
3. Press "Start Test".
4. Between each test run, adjust the crosshead until the force reads 0 1 OOmN, and zero the displacement.
5. Perform ten test runs with the pouch jammed.
6. Remove vacuum line and re-balance force.
7. Perform ten test runs with no vacuum applied to the pouch. Again, between each test run, adjust the crosshead until the force reads 0 1 OOmN, and zero the displacement.
Figure 12: Experiment 1 Instron setup.
Data Analysis
The outputs of Experiment 1 tests were data sets of force vs. displacement for each of the 20 test runs (10 vacuum, 10 no-vacuum) for each of the 22 pouches tested. In data analysis, the
first 5 trials of both vacuum and no-vacuum were ignored in order to eliminate the possibility of hysteresis confounding results.
A Matlab script was written to convert the force vs. displacement inputs to stress vs.
strain, in order to create stress-strain curves and calculate the experimental Effective modulus for each trial. The full Matlab script can be found in Appendix A.
Engineering stress a was calculated as
F
0- = - (3)
A 0
where F is the load and AO is the initial cross sectional area, given by
AO = Lw (4)
where L and w are the initial clamped length and width of the pouch, respectively. Engineering strain E was calculated as
E = (5)
L
where S is the displacement and L is the initial clamped length of the pouch.
Stress-strain curves were plotted for each test run. The effective modulus at each point was calculated as the derivative of the stress-strain curve at each point. Plots of the variation of
effective modulus vs. strain were also created, in order to observe the material's response to jamming.
3.2 Experiment 2: Characterizing parameters for tunable effective modulus
Goal:
Identify and characterize the specific parameters that affect how a material composite responds to laminar jamming.
Hypothesis:
The response of a knit composite to laminar jamming depends on the yam elasticity, yarn thickness, loop size, and loop orientation.
The results of Experiment 1 (Section 4.1) suggested that knit patterns were favorable for creating elements of tunable effective modulus via laminar jamming. Therefore, the goals of Experiment 2 were to further understand and characterize the parameters that affect the response of knit materials to laminar jamming. The experiment aimed to answer four questions:
1. How does the elasticity of the yarn affect how the knit composite responds to laminar
jamming?
a. Two yarn elasticities tested (Figure 14): i. Extensible (pink)
ii. Inextensible (blue)
2. How does the thickness of the yarn affect how the knit composite responds to laminar jamming?
a. Three yarn thicknesses tested (Figure 15): i. Thin (blue), d = 1.5mm
ii. Medium (red), d = 2.5mm
iii. Thick (white), d = 4.0mm
3. How does the thickness of the knit loops affect how the knit composite responds to
laminar jamming?
a. Three loop sizes tested (via varying the needle size used to knit) (Figure 16): i. 3.5mm
ii. 5mm
1. 1i. Figure 13: Warp vs. a) !M weft stitches. b)
Figure 14: Extensible thread (a) vs. inextensible yarn (b) compared in Experiment 2
a) b)
Figure 15: 1.5mm thread (a) vs. 2.5mm thread (b)
2
c)
vs. 4.0mm thread (c) comparcd in Experiment
Figure 16: 3.5inm b) f s . 4 (a) vs. 5mm (b) vs. A c) 7ie. f'
10mm (c) needle sizes compared in Experiment 2
Warp (vertical stitch) Weft (horizontal stitch)
W
a) b)
Figure 17: Warp stitch (a) vs. weft stitch (b) compared in Experiment 2
Sample Yarn Elasticity Needle size Stitch
thickness Orientation 3 1.5mm Extensible 10mm Warp 4 1.5mm Extensible 10mm Weft 5 2.5mm Inextensible 3.5mm Weft 6 1.5mm Extensible 3.5mm Weft 7 4.0mm Inextensible 3.5mm Weft 8 1.5mm Inextensible 3.5mm Weft 9 1.5mm Inextensible 5mm Weft 10 1.5mm Inextensible 10mm Weft 11 1.5mm Inextensible 5mm Warp
Table 2: Summary of knit samples tested in Experiment 2
Pouch Manufacturing Method
The same pouch manufacturing method as outlined in Section 3.1 was used to make pouches.
Tensile Testing Method
The same tensile testing method as outlined in Section 3.1 was used to perform tensile testing.
Data Analysis
3.3 Experiment 3: Creating tubes with variable compliance
Goal:
Create an artificial vessel of variable compliance by assembling the materials and mechanisms in Experiments 1 and 2 in a tubular configuration.
Hypothesis:
Creating a composite pouch in tubular form and applying laminar jamming will alter its compliance and change its volume-pressure relationship.
After confinning that laminar jamming is an effective mechanism to create pouches of variable stiffness, the purpose of Experiment 3 was to implement the same techniques in a tubular form, mimicking the shape of a blood vessel.
Vessel Manufacturing Method
I. Creating knit tubes (Figure 18)
1. Obtain a circular loom (LAYOER Knit Spool Loom, d = 6cm) with 8 pegs of diameter
7mm (Figure 18a).
2. Follow manufacturer's instructions for knitting on circular loom.
3. Continue knitting until the tube is 4" in length, then cast off.
a) b)
C)
Figure 18: Process to create knit tubes. (a) Casting Yarn onto circular loom. (b) Selection of
completed round knits, top view and (c) side view. II. Enclosing knit tubes in silicone pouch (Figure 19)
2. Inflate a custom-made thermoplastic elastomer balloon (L =110mm) to 24mm diameter.
3. Wrap the balloon in one silicone membrane, creating the inner surface of the vessel. Pour
uncured silicone along the edge as an adhesive (Figure 19 a,b). 4. Let cure for 20 minutes.
5. Pull knit tube over the balloon and silicone membrane.
6. Wrap another silicone membrane around the knit tube, creating the outer layer of the
vessel. Pour uncured silicone along the edge as an adhesive, and on each end of the tube to allow the inner and outer silicone membranes to adhere at each end.
7. Clamp on both ends of the tube to help with adhesion and let cure for 20 minutes (Figure 19c).
a) b) c)
d)
Figure 19: Process to enclose knit tubes in silicone pouch. (a) Wrap balloon in silicone membrane
for inner layer of pouch. (b) Pour uncured silicone along the edge as adhesive. (c) After pulling the knit tube over the balloon and wrapping another silicone membrane as an outer layer, clamp both ends of the tube to help with adhesion. (d) Final vessel after clamps are removed.
Testing
I. Experimental setup (Figure 20)
1. Secure both ends of vessel to a rigid connector with round clamps. Ensure both ends of
the knit layer are clamped (Figure 20a).
2. Secure a 3-way stopcock with two luer locks to one end of the rigid connector (Figure 20a).
4. Connect the other luer lock to a pressure transducer (ArgoTrans Model 2/Neonatal, Argon Medical Devices Inc., USA) via 1/8" polyurethane tubing (SMC Inc., USA)..
a) b)
Figure 20: Setup for Experiment 3, testing vessel compliance. (a) Both ends of vessel secured to a rigid connector with round clamps. (b) View through center of vessel.
II. Test execution
1. Flush pressure transducer before beginning data collection.
2. Fill the vessel with water (via the luer lock on three-way stopcock) until the transmural pressure (read by the transducer) is 2mmHg.
a. Hold the vessel vertically to eliminate air bubbles inside during filling.
3. Begin continuous recording of pressure readings.
4. Set the output rate of the syringe pump to 12mL/min.
5. Inject ImL at a time into the vessel via the syringe pump. Wait 5 seconds between each injection. Continue until a volume of IOmL has been injected. After each injection, the pressure transducer is manually touched to signal the next injected volume on the pressure recording.
6. Repeat Step 4 for two additional trials (yielding three data sets for the unjammed
configuration).
7. Attach vacuum line to vessel and apply vacuum to jam the vessel structure. 8. Repeat Steps 4 and 5 for four trials (yielding four data sets for the jammed case,
including an extra to account for hysteresis).
Data Analysis
1. Plot the pressure traces for each trial conducted in Matlab (Figure 21a).
2. Each large spike signifies the moment before the next mL was injected. Zoom into the moment just before each large spike (Figure 21b).
3. Zoom in further to observe the average pressure reading at that point. Use the Matlab data
cursor to choose a data point that lies on the midline of the data trace (Figure 21 c). Record this data point as the transmural pressure for that volume injected.
4. Repeat this process for each volume injection for each trial (3 unjammed, 4 jammed).
5. Plot volume vs. pressure for each of the trials.
6. Calculate compliance, C = -, by calculating the change in pressure between each lmL injection.
7. Plot compliance vs. volume to observe changes in
25 20 15 10 5 0 0.5 1 1.5 2 2.5 3 Data point 3.5 4 4.5 X 10⁵ b) 15 10 *1 5 0
compliance over the trial.
3 3.5 4 Data point c) 3 2.9 2.8 2.7 12.6 2.5 2.4 2.3 2.2 2.1 2 X 4.54h.+04 W Y:2.49 II 4.46 4.48 4.5 4.52 4.54 4.8 4.58 4.6 4.62 4.64 Data pot x104
Figure 21: Process to obtain transmural pressures from raw pressure traces. (a) Full trace for one
trial with all 10 volume injections. (b) Zoomed into the red box of plot (a), showing a close-up of the moment before the second volume injection. (c) Zoomed into the red box of (b), providing an
a)
L
~ t ~
r r
r
F*
r
F
F
F
*
4.5 5 X 1044. Results
4.1 Results of Experiment 1: Tensile testing for broad exploration of designs and materials
For the pouch with warp wool fibers, the effective modulus was constant at 3kPa when the pouch was not jammed. When the pouch was jammed, the effective modulus was also 3kPa until 5% strain, when it began to rapidly increase to a maximum of 58kPa at 12% strain (Figure 22). a) 3 b) 0 2.5 -0v 2 no.. .4 40 7 no Va no Vacss 120 0.5 LU10 00 -0.5 0 0.05 0.1 0.15 0.2 025 0.3 0.35 0.4 0 0.05 0.1 0.15 0.2 0.25 0.3 0.35 0.4 Strain fIStrain(J
Figure 22: Warp wool fibers response in Experiment 1, tensile testing to 6N. Comparison of
jammed vs. unjammed test runs. (a) Stress-strain curves. (b) Effective modulus vs. strain.
For the pouch with weft wool fibers, the effective modulus was constant at 2kPa when the pouch was not jammed. When the pouch was jammed, the effective modulus was also 2kPa until 30% strain, when it began to gradually increase to a maximum of 7kPa at 80% strain (Figure 23).
a) ___ b) vIu 2.5 - V C2 35 -no Vs vac3 va04 30 2 vac5 no vaci 25 no vac2 o 1.5 no vac3 20 no vao4 20 * no vacS SE 1 1I 10-0.5 - W 5 0 -0.5 1' '' '' -0 0.2 0.4 0.6 0.8 1 0 0.2 0.4 0.6 0.8 1 Strain [I StrainIn
Figure 23: Weft wool fibers response in Experiment 1, tensile testing to 6N. Comparison ofj ammed vs. unjammed test runs. (a) Stress-strain curves. (b) Effective modulus vs. strain.
For the pouch with looped wool, the effective modulus was constant at 2kPa when the pouch was not jammed. When the pouch was jammed, the effective modulus was also 2kPa until
10% strain, when it began to gradually increase to a maximum of 22kPa at 35% strain (Figure
24). a) ' b) 50 Vinci 2.5-45 -i n45 -vac3 no vacuum Vac4 4 2 - vac5 novacI no vac2 no vac3 0 C. 1.5 no vac4 .2 no vacS fto 0 15 .10 5 0 0 0 0.1 0.2 0.3 0.4 0.5 0 0.1 0.2 0.3 0.4 0.5 Strain [A StrainI
Figure 24: Looped wool response in Experiment 1, tensile testing to 6N. Comparison of jammed vs. unjammed test runs. (a) Stress-strain curves. (b) Effective modulus vs. strain.
For the pouch with looped wool with a decoupling layer of wool fibers, the effective modulus was constant at 2kPa when the pouch was not jammed. When the pouch was jammed, the effective modulus was also 2kPa until 8% strain, then increased to a maximum of 65kPa at
a) b) 2.5 va0 vac3 60 vac4 2 vacS - 50 no vad q. no vac2 40 CL 1.5 .2ac -- o VWAn 30 no 20 10 0.5 ^ -20 -0.5 0 0.05 0.1 0.15 0.2 0 0.05 0.1 0.15 0.2 Strain I strainf
Figure 25: Looped wool with decoupling layered wool: response in Experiment 1, tensile testing to
6N. Comparison ofjammed vs. unjammed test runs. (a) Stress-strain curves. (b) Effective modulus
vs. strain.
For the pouch with meandering elastic thread, the average effective modulus was constant at 2kPa for both the jammed and not jammed states (Figure 26).
30 a) b) ___ 2.5 - vac2 25 -vac3 25 0. 1.5 --_ no vmo4 -. 1 no vacd no vww E 10 0 0.1 0.2 0.3 0.4 0.5 0 0.1 0.2 0.3 0.4 0.5 Strain [n Strain[nl
Figure 26: Meandering elastic thread response in Experiment 1, tensile testing to 6N. Comparison
of jammed vs. unjammed test runs. (a) Stress-strain curves. (b) Effective modulus vs. strain.
For the pouch with meandering elastic thread with a layer of wool, the effective modulus was constant at 2.5kPa when the pouch was not jammed. When the pouch was jammed, the effective modulus was also 2.5kPa until 10% strain, when it increased to a
a) b) 2.5-20 - ac5 2 - aot -- no Yac2 15 1.5 no vea3 1n 10 -0.5 U1 5 0 -0.5 0 0.1 0.2 0.3 0.4 0.5 0 0.1 0.2 0.3 0.4 0.5 Stain [4 staln4
Figure 27: Meandering elastic thread with layered wool: response in Experiment 1, tensile testing
to 6N. Comparison of jammed vs. unjammed test runs. (a) Stress-strain curves. (b) Effective modulus vs. strain.
For the pouch with vertical mesh, the effective modulus was constant at 2.5kPa when the pouch was not jammed. When the pouch was jammed, the effective modulus was also 2.5kPa until 15% strain, when it increased to a peak of 13kPa at 18% strain, and then equilibrated to
lOkPa (Figure 28). a) __ b) 40 2.5- vac2 - -voc3 am4 30 2 noac1 25 no vac2 no v 20 no vecS 15 1 . E 1 10 0.5- W 5 0 0-.5 -0.5-0 0.1 0.2 0.3 0.4 0.5 0 0.1 0.2 0.3 0.4 0.5 Stain [n SVM4n
Figure 28: Vertical mesh response in Experiment 1, tensile testing to 6N. Comparison of jammed
vs. unjammed test runs. (a) Stress-strain curves. (b) Effective modulus vs. strain.
For the pouch with two layers of black spandex, the effective modulus was constant at 7kPa when the pouch was not jammed. When the pouch was jammed, the effective modulus had
2.5 25 L i- 2 - 20 1.5 - -15 -1- 1. 510 0.5 .D Va1 - 5 __--m vac2 0 no W4 vacS01 0 0.05 0.1 0.15 0.2 0.25 0.3 0.35 0.4 0 0.05 0.1 0.15 0.2 0.25 0.3 0.35 0.4 Strin (n strain/
Figure 29: Two-layer spandex response in Experiment 1, tensile testing to 6N. Comparison of jammed vs. unjammed test runs. (a) Stress-strain curves. (b) Effective modulus vs. strain.
4.2 Results of Experiment 2: Characterizing parameters for tunable effective modulus 4 -- CI 3.5 -wa waa no Val 2.5 no Vad -uno Vad 2 -- no VWm no Vacs 0.5 0 0.05 0.1 0.15 0.2 0.25 0.3 0.35 0.4 Strain [1) 3.5 - aO4 vaC5 3 no Val ___no vac2 2.5 novacd novacO 2 novacS 1.5 01 -0.5 0--ni 3.5 3 2.5 2 1.5 1 0.5 0 -0.5 0 0.05 01 0.15 0.2 0.25 0.3 0.35 0.4 Strain [in -- -vac1 --- vac2 vac3 v804 - - vacS no WWI nowac no vacS no vac4 0 0.05 0.1 0.15 0.2 0.25 0.3 0.35 0.4 Strain [1] b) 35 30 25 20 S15 W 5 d) 45 40 E 0 15 w 10 5 0 -5 f) 30 25 iw 20 E 15 0 0 0.05 0.1 0.15 0.2 0.25 0.3 0.35 0.4 Strail/ 0 0.05 0.1 0.15 0.2 0.25 0.3 0.35 0.4 Strainll 0 0.05 0.1 0.15 0.2 0.25 0.3 0.35 0.4 Strainu/
Figure 30: Experiment 2: Examining effect of loop size on tuning of Effective modulus via laminar jamming. 3.5mm (a, b) vs. 5mm (c, d) vs. 10mm (e, f). All blue yarn. a) C) 0-iE. I e) a C.
I
0) ZIWUM noVCM no vscum] -.the unjammed pouch was constant at 5kPa until 20% strain, where it began to gradually increase to l2kPa. The effective modulus of the jammed pouch reached a peak of 37kPa at 3% strain and then equilibrated to 27kPa from 5% to 12% strain (Figure 30 a, b). For the 5mm loop size, the effective modulus of the unjammed pouch was constant at 5kPa until 25% strain, where it began to gradually increase to 1 OkPa. The effective modulus of the jammed pouch reached a peak of 47kPa at 5% strain, then decreased to 35kPa from 8% to 12% strain (Figure 30 c, d). For the
10mm loop size, the effective modulus of the unjammed pouch was constant at 2.5kPa for the duration of the test. The effective modulus of the jammed pouch gradually increased to a peak of 32kPa at 20% strain (Figure 30 e, f).
b) 45 ---- VOcUur 40 - no vacuumn 35 -E2 0 115 U) 10 1 0 -5 0 0.05 0.1 0.15 0.2 0.25 0.3 0.35 0.4 Stramnj 5 4/ 3 2/ vinCI vOC2 Vuc3 - no vOCI no vine nova 0 0.05 0.1 0.15 Strain [4 d) . E 0.2 0.25 0.3 0 0.05 0.1 0.15 Strain[n 0.2 0.25 0.3
Figure 31: Experiment 2: Examining effect of stitch orientation on tuning of
Effective modulus via laminar jamming. Weft loops (a, b) vs. warp loops (c, d). Both blue yarn, 5mm needle size.
Figure 31 compares the stress-strain plots and effective modulus-strain plots for the two stitch orientations tested - weft and warp. For the pouch with the weft stitch, the effective
a) CIS 4. 3. 2. 1. 0. 5 4 vOCl vaC3 3 vac 5 V=4 3 novac __no vac2 5 - nov=c3 2 no v&64 5 5 0 0.05 0.1 0.15 0.2 0.25 0.3 0.35 0.4 Strain 11 c) LU 0. I Co 'UWU 80 no vacuu 50 , 40 30 20 10 0\
modulus of the unjammed pouch was constant at 5kPa until 25% strain, when it gradually
increased to 1 OkPa at 40% strain. When the pouch was jammed, the effective modulus reached a peak of 47kPa at 4% strain, then decreased to 35kPa from 8% to 12% strain (Figure 31 a, b). For the pouch with the warp stitch, the effective modulus of the unjammed pouch started at 7kPa and increased to a peak of 60kPa at 25% strain. When the pouch was jammed, the effective modulus reached a peak of 40kPa at 5% strain, then decreased to 30kPa from 10% to 15% strain (Figure
31 c, d). -Val voc3 -yaCO vsc5 no VWnc no Vaa __no wc3 __no V04 nova 0 0.05 0.1 0.15 0.2 0.25 0.3 0.35 0.4 Strain [14 4 3.5 -vaC2 vaC3 3 V804 ---- acS 2.5 - -- no Vac 2 nO W104 1.5 0.5 b) g 80 70 2:0 W to 40 30 w 20 10 0 0 0.05 0.1 0.15 0.2 0.25 0.3 0.35 0.4 Strainin d) a E3 wu 0 0.05 0.1 0.15 0.2 0.25 0.3 0.35 0.4 Strain (n 35 30 25 20 15 10 5 0 0 0.05 0.1 0.15 0.2 0.25 0.3 0.35 0.4 Strain[i
Figure 32: Experiment 2: Examining effect of yarn elasticity on tuning of
Effective modulus via laminar jamming. Extensible thread (ab) vs. inextensible blue yarn (c,d). Both weft stitch and 3.5mm needle size.
Figure 32 compares the stress-strain plots and effective modulus-strain plots for the two yam elasticities tested - extensible vs. stiff. For the pouch with extensible thread, the effective modulus of the unjammed pouch was constant at lOkPa. When the pouch was jammed, the
a) a 0. iE. I Co 6 5 4 3 2 0. c) E N/V'1 VOWUM no vamm 0. -1 -- -no vacu
effective modulus reached a peak of 85kPa at 1% strain, then decreased exponentially to l5kPa
by 20% strain. (Figure 32 a, b). For the pouch with inextensible yam, the effective modulus of
the unjammed pouch was constant at 5kPa until 20% strain, where it began to gradually increase to l2kPa. The effective modulus of the jammed pouch reached a peak of 37kPa at 2% strain and then equilibrated to 27kPa from 5% to 12% strain (Figure 32 c, d).
Figure 33 compares the stress-strain plots and effective modulus-strain plots for the three yam thicknesses tested - thin, medium, and thick. For the pouch with thin yam, the effective modulus of the unjammed pouch was constant at 5kPa until 20% strain, where it began to gradually increase to 12kPa. The effective modulus of the jammed pouch reached a peak of 37kPa at 2% strain and then equilibrated to 27kPa from 5% to 12% strain (Figure 33 a, b). For the pouch with medium yam, the effective modulus of the unjammed pouch was constant at
IOkPa until 10% strain, when it began to gradually increase to 25kPa at 32% strain. When the pouch was jammed, the effective modulus peaked at 225kPa at 1% strain, then decreased
exponentially to 45kPa at 8% strain (Figure 33 c, d). For the pouch with thick yam, the effective modulus in the unjammed pouch was constant at 1 OkPa until 10% strain, when it began to gradually increase to 25kPa at 32% strain. When the pouch was jammed, the effective modulus peaked at 260kPa at 1% strain, then decreased to 75kPa at 5% strain (Figure 33 e, f).
a) 3.5 veC2 3 V=4 Vaa no veci 2.5 - novac2 -- no vc3 02 Moaa 1.5 ro ,a 1.5 0.5 0-0 0.05 0.1 0.15 0.2 0.25 0.3 0.36 0.4 Strain [/3 0 0.05 0.1 0.15 0.2 0.25 0.3 0.3 Strain / -- vc1 Vc2 vac3 no val - no vac2 no v8c no vo4 no Va -0 0.05 0.1 0.15 0.2 Strain [/ 0.25 0.3 0.35 b) 35 30 .25 20 15 0 0 0.05 0.1 0.15 0.2 Strain[n 025 0.3 0.35 0.4 250 200 150 100 50 0 450 0 0.05 0.1 0.15 0.2 0.25 0.3 0.35 Stramnj MrcUU d) 0. E .2
i1
EJ f) 250 ~2001
2150
100 w 50 0 -50 0 0.05 0.1 0.15 0.2 0.25 0.3 Strain[IFigure 33: Experiment 2: Examining effect of yarn thickness on tuning of effective modulus via laminar jamming. Thin (a,b) vs. medium (c,d) vs. thick (e,f). All weft stitch and 3.5mm needle size. c) U 0. 4.5 4 3.5 3 2.5 2 1.5 1 0.5 0 no veaC no ya* no ya5 e) 6 5 4 3 1 -1 0.35 - A\ V ' ' ' ' ' ' ' -0.5
4.3 Results of Experiment 3
The vessel used in this testing was created from inextensible fine yam (d = 1.5mm) and
two silicone membranes, as described in Section 3.3.
Figure 34 shows volume-pressure curves obtained from testing outlined in Section 3.3. Three curves depict the vessel's volume-pressure response in the unjammed state (Figure 34a), and four curves represent the jammed state. Figure 34b shows all seven curves obtained from both jammed and unjammed trials. Volumes injected to the vessel ranged from lmL to lOmL for all trials. In the unjammed state, pressures reached 5.8 mmHg. In the jammed state, pressures reached 56.3 mmHg. a) 10 8 E -0 -6-Unjammed 1 E -eUnjammed 2 .2 4 >- Unjammed 3 2 0 .0 1 2 3 4 5 6 Pressure (mmHg) b) 10 or e O 8 01 - ---- Unjammed 2 E p , S - -- e-Unjammed 2 S6--Unjammed W- 3 E /- Jammed 4 -2 4 A 0 > .0 -p Jammed 2 / -~ -~Jammed 3 - 0 -as- Jammed 4 0 0 10 20 30 40 50 60 Pressure (mmHg)
Figure 34: Volume-pressure curves obtained from Experiment 3. (a) Three trials in unjammed state. (b) Comparison of unjammed vs. jammed states. Note differences in pressure scale.
Figure 35 compares compliance vs. volume traces for the unjammed and jammed states. Compliance curves from the unjammed and jammed trials were each averaged into one curve. In the unjammed state, compliance ranged from 2.15 to 3.26 mL/mmHg, with an average of 3.03 mL/mmHg, and showed an increasing trend as volume increased. In the jammed state, compliance ranged from 0.13 to 0.47 mL/mmHg, with an average of 0.28 mL/mmHg, also showing an increasing trend as volume increased. Therefore, on average, laminar jamming caused the compliance of the vessel to decrease by 91%.
4 3.5 3 E E-2.5 E2 -Unjammed, average 1.5 -Jammed, average 0 U 1 0.5 0 0 2 4 6 Volume added [mL]
Figure 35: Compliance-volume curves obtained from Experiment 3. jammed states.
Comparison of unjammed vs.
liii
II
5. Discussion
The results of Experiment 1 confirmed that laminar jamming has the potential to be used as effective mechanism for tuning the effective modulus of an elastic composite material. The hypothesis that a composite's response to laminar jamming depends on the jammed material, the geometry of the material, the number of jammed layers, and the presence of a decoupling layer was confirmed.
Most of the pouches exhibited the same response in their unjammed state, with a low effective modulus constant around 3kPa. This result can be attributed to the silicone membrane in tension dominating the pouch response. In contrast, most of the pouches became less elastic (higher effective modulus) when they were jammed. As predicted by the mechanism of laminar jamming discussed in Section 2.4, the maximum tensile force required to stretch jammed pouches increases when a vacuum is applied due to friction between the jammed layers.
Therefore, in the jammed state, the response of most pouches was dominated by the properties of the inner material in tension.
The response of a composite to laminar jamming depends on the orientation of the inner material. Figures 22 and 23 illustrate the difference between warp wool fibers and weft wool fibers. When the stitch was warp, the jammed pouch reached 58kPa, but when the stitch was weft, the jammed pouch only reached 7kPa. The higher effective modulus for the pouch with warp fibers is likely due to the pouch response being dominated by the wool fibers in tension because each end was clamped. In contrast, when the stitch was weft, the silicone membrane in tension dominated the pouch response because the ends of the fibers were not clamped and the textile fibers were more easily separated within the silicone pouch.
In some pouches, when jammed, the effective modulus immediately increased. For example, Figure 29 illustrates that in the pouch with two layers of spandex, the effective modulus in the jammed condition reached 26kPa immediately, at 1% strain. This result is expected because there was no slack in the spandex sheets, and therefore the response was immediately dominated by the spandex in tension. In contrast, Figure 25 illustrates the response of the pouch with looped wool. In this case, the effective modulus in the jammed condition is the
35% strain. This result suggests that the response at low strains was dominated by the silicone
membrane in tension, as the wool was still in loops and not in tension yet. Then, once the loops had straightened out, the response at higher strains was dominated by the wool in tension.
The presence of a decoupling layer of wool drastically changed the pouch responses. Comparing Figures 24 and 25 - looped wool with and without a decoupling layer of wool - the jammed pouch gets much stiffer with the decoupling layer of wool. Figures 26 and 27 illustrate this same phenomenon for the cases of the elastic thread with and without a decoupling layer of wool. This effect can likely be attributed to the wool adding to the jammed surface area,
increasing the friction between layers and therefore increasing the stiffness.
The stiffness of the inner material affected the composite's response to laminar jamming. As shown in Figure 26, the stiffness of the pouch with an elastic thread was the same in both the jammed and unjammed conditions. This is likely because the elasticity of the stretchable thread
was lower compared to that of the silicone membrane; so although the elastic thread was being stretched at high strains, the stiffness of the overall composite did not change.
One of the goals of this experiment was to identify promising materials and patterns to move forward with in further testing. Considering the overall goal to recreate the mechanics of blood vessels, which exhibit lower stiffnesses at low strains and higher stiffnesses at high strains due to the stretching of collagen and elastin fibers (Figure 5), the pouches that exhibited
comparable behavior were identified as most promising. As discussed above, the response of looped wool in Figure 24 was most similar to this two-regime behavior.
Therefore, the goals of Experiment 2 were to further examine the response of looped patterns to laminar jamming. This response was examined through testing knit samples, since the structure of knit patterns consists of many small loops. Experiment 2 confirmed that the response of a knit composite to laminar jamming depends on the yarn elasticity, yarn thickness, loop size, and stitch orientation.
As shown in Figure 30, the pouches with smaller loop sizes responded to jamming at lower strains, while the pouches with larger loop sizes responded to jamming at higher strains.


![Figure 3: Three layers of the aortic wall - intima, media, and adventitia [6]](https://thumb-eu.123doks.com/thumbv2/123doknet/14677881.558458/11.917.242.629.163.399/figure-layers-aortic-wall-intima-media-adventitia.webp)

![Figure 5: Illustration of laminar jamming mechanism [10]](https://thumb-eu.123doks.com/thumbv2/123doknet/14677881.558458/14.917.269.647.113.286/figure-illustration-laminar-jamming-mechanism.webp)