by
STEVEN KNIGHT CHARLES
B.S. Mechanical Engineering Brigham Young University, 2001
Submitted to the Department of Mechanical Engineering in Requirements for the Degree of
Partial Fulfillment of the
Master of Science in Mechanical Engineering
at the
Massachusetts Institute of Technology
June 2004
C 2004 Massachusetts Institute of Technology All rights reserved
Signature of A uthor: ... n. Department of M~echanical'Engineering 7 May 2004 C ertified by : ... A ccepted by: ... H. Frederick Bowman Thesis Supervisor Ain A. Sonin Chairman, Department Committee on Graduate Students
iMASACHUSE1TS INSAE
OF TECHNOLOGY
RKER
JAN 2
3
2007
LIBRARIES
DESIGN AND THERMAL MODELING OF A NON-INVASIVE PROBE FOR MEASURING PERFUSION BY THERMODIFFUSION
by
STEVEN KNIGHT CHARLES
Submitted to the Department of Mechanical Engineering on 7 May 2004 in Partial Fulfillment of the Requirements for the
Degree of Master of Science in Mechanical Engineering
ABSTRACT
This research 1) explores the feasibility of developing a non-invasive probe to precisely quantify microcirculatory blood flow (tissue perfusion), in real time and in absolute units, and 2) presents designs and models of such a probe, along with an evaluation of various design-model combinations.
Bowman et al. have developed an invasive thermodiffusion probe that measures tissue perfusion accurately, continuously, and in real time. This method employs a self-heated thermistor placed in perfused tissue. From a knowledge of the power required to heat the thermistor probe to a given temperature, perfusion can be calculated using an analytical or numerical model.
Using Bowman's thermodiffusion probe (designed for invasive use) in a non-invasive manner, a perfusion study was performed. The data clearly show the promise of a non-invasive thermodiffusion perfusion probe (designed for non-non-invasive use), and the design of such a probe was pursued by adapting the invasive technology for a non-invasive probe. Because perfusion is not actually measured but calculated from measured
quantities by a model of the probe and perfused tissue, the design of the non-invasive probe occurred hand-in-hand with the development of analytical models.
The results of the clinical study are presented, as well as two designs together with possible one-dimensional analytical models. Using a finite-difference model of the two probe designs and the underlying perfused tissue, the errors that result from
approximating these designs as one-dimensional models have been determined. It is shown that modeling a thin, disk-shaped thermistor probe as a hemisphere of appropriate radius can result in an error in calculated perfusion which is small enough for clinical use.
Thesis Supervisor: Dr. H. Frederick Bowman
Title: Senior Academic Administrator for the
Harvard/MIT Division of Health Sciences and Technology
Acknowledgments
My experience in the masters program over the last three years has taken me for
months at a time to patients' bedsides, to Utah for two summers and Boston for three winters, from friendly BYU to competitive MIT, from traditional mechanical engineering design, dynamics and control through optics and signal and image processing to
cardiovascular and renal disease and back to heat transfer. I have been to the depths of the Ph.D. qualifying exams and to the heights of knowing that I have given my best. Through all these experiences I have felt the hand of God guiding and blessing, healing, lifting and loving.
My advisor, Fred Bowman, has taught me the importance of taking a real,
personal interest in people. I don't know how many times he has started off a research meeting asking how my family was doing. He has been understanding and supportive despite me changing research preferences and long periods of research drought. Greg Martin has deep engineering insight and a broad range of experience. Always friendly and always available, he has a way of giving feedback and advice in an uplifting way, even after long, after-hours quals practice presentations. I thank Bora Mikic for his kind
and undeserved help. His suggestions were important in advancing my research, and his class prepared me wonderfully for the second pass of the qualifying exams.
I am grateful to Brian Whisenant, an interventional cardiologist who was brave
enough to share his office and laptop with me for two summers, even after I locked him out of his own computer. John Lund was very helpful in making me feel at home at the University of Utah hospital.
Paul George has been a true friend since we met the week before our MIT experiences began. We feel like brothers even though I'm three years older but three years behind him in school. The fact that my desk has been right next to his has been one of the great blessings of my masters program. When you spend eight or nine hours a day next to a guy with two first names, a so-ugly-he's-cute bulldog and not a clean square inch on his desk, there's bound to be fun in the HST lounge.
I love going home at night because I get to kick off my shoes and roll on the floor
with Sam, 3, and Ben, 11 months. Sam and I have gotten along since I comforted him during his neo-natal checkup. I never thought I'd be best friends with a three-year old, but whether it's playing rescue heroes, talking about robots, or philosophizing over a bowl of "Frosted Ninny-Veets" (true quote: "The world is our spaceship."), Sam is my pal.
Ben was a gift during the most difficult period of my masters experience. Part of the gift was his generously laughing personality and fat, cuddly body. The other part of the gift was the fact that dirty diapers, sleepless nights, and an ever-hungry mouth tend to shift the focus away from research and quals to more important things.
My deepest appreciation and love go to my wife Cristie. During 13 months of
quals preparations and three years of masters research and classes, she has put her interests on the backburner. She has supported me not knowing what decision I would make, cheered me on, been kind when I needed kindness, and been happy for my success.
I know she did it for love. My greatest accomplishment to-date is not turning in this
Table of Contents
TABLE OF CONTENTS ... 7 LIST OF SYMBOLS ... 11 LIST OF SUBSCRIPTS ... 12 LIST OF VALUES ... 12 LIST OF FIGURES ... 13 LIST OF TABLES ... 15 C INTRODUCTION ... 17 1.1 M otivation...17 1.2 A pplications...17 1.3 O ther M ethods ... 182 TRHBE THERMODIFFUSION PRO... ... 21
2.1 B asic O peration ... 21
2.2 History of the Development of the Invasive Probe...22
2.3 History of the Development of the Non-invasive Probe... 24
3 CLINICAL STUDY: USING THE INVASIVE PROBE IN A NON-INVASIVE MANNER ... 29
3.1 Introduction...29
3.1.1 Cardiovascular Disease and Atherosclerosis...29
3 .1.2 E ndothelial D ysfunction ... 29
3.1.3 A ssessm ent of Endothelial Dysfunction... 30
3.2 D ata G athering...31
3 .2 .1 P ro to c o l ... 3 1 3 .2 .1.1 P ro b e P lacem ent ... 3 1 3 .2 .1.2 C o n tact G e ls ... 3 2 3.2.1.3 Insulation of the H and ... . 32
3.2.1.4 M anual M ode vs. A utom atic M ode ... 32
3 .2 .1.5 P atien t at R est ... 32
3.2.1.6 M easurem ent D uration ... 33
3 .2 .2 M easurem ent Issues ... 33
3.2.3.1 Event Site to Test Site... 35
3.2.3.2 Test Site to Sense Site... 35
3.3 Database of M easurem ent Data and Subject Inform ation ... 36
3.3.1 M easurement Data ... 36
3.3.2 Subject Inform ation...36
3.4 A nalysis...37 3.4.1 Physiological Issues ... 37 3 .4 .2 F ilte rin g ... 3 7 3 .4 .3 P e rfu sio n ... 3 8 3.4.3.1 BART ... 38 3.4.3.2 Baseline ... 39 3.4.4 Tem perature ... 40 3.4.4.1 BART ... 40 3.4.4.2 Baseline ... 40
3.4.5 Frequency-dom ain Analysis... 41
3.4.6 Conclusions...41
3.4.6.1 Feasibility of a N on-invasive Therm odiffusion Probe... 42
3.4.6.2 Cutaneous Circulation and Endothelial Dysfunction... 42
4 THEORETICAL STUDY: DESIGN AND THERMAL MODELING OF A NON-IN V A S IV E P R O B E ... 51
4.1 G overning Equations ... 51
4.1.1 Therm istor Probe...51
4 .1.2 T issu e ... 5 2 4.1.2.1 M icroscopic Tissue Heterogeneity ... 52
4.1.2.2 M acroscopic Tissue Heterogeneity... 53
4.1.2.3 Transport of Heat by the Circulatory System ... 54
4.1.3 Probe-Tissue System ... 55
4.1.4 Non-dim ensionalized Equations ... 56
4.2 Solutions... . --.57
4.2.1 One-dimensional solutions... 57
4.2.1.1 Heated Sphere in Infinite, Perfused Tissue... 58
4.2.1.2 Heated, Infinite Slab on Sem i-Infinite, Perfused Tissue... 58
4.2.1.3 Heated, Infinite Cylinder in Infinite, Perfused Tissue ... 60
4.2.2 Higher-dimensional Solutions... 60
4.3 Error Analysis ... 60
4.4 Sim ultaneous Selection of Designs and M odels ... 62
4.5 Design-M odel Com binations... 62
4.5.1 Disk Design...62
4.5.1.1 Description ... 62
4.5.1.2 Dimensions ... 62
4.5.2 D isk and Ring Design ... 63
4.5.2.1 Description ... 63
4.5.2.2 D imensions ... 63
4 .5 .3 M o d e ls...6 4 4.6 Method for Obtaining the Error in Calculated Perfusion due to 1-D Approximation...65
4.6.1.1 Extra Degree of Freedom for the Spherical Approximation ... 66
4 .6 .2 F inite-D iffercn ce M odel...66
4 .6 .2 .1 S e tu p ... 6 6 4 .6 .2 .2 V a lid atio n ... 6 7 4.7 Temperature Distributions... 69
4.7.1 Probe and Tissue Temperature Profiles...69
4.7.2 Volume-averaged Temperature Increment of the Probe, AT ... 69
4.8 Results: Error in Calculated Perfusion due to 1-D Approximation ... 70
4 .8 .1 D isk D e sig n ... 7 0 4 .8 .2 D isk an d R in g ... 7 1 4.9 D iscussion ... 72
4.10 Suggestions for Further Work ... 72
5 CONCLUSION ... 87
G BIBLIO RAPH6 ... BI A...89
7 APPENDIX A: FINITE-DIFFERENCE MODEL ... 93
8 APPENDIX B: ERROR DUE TO FINITE EXTENT OF FDM...101
9 APPENDIX C: FDM ISOTHERM PLOTS OF PROBE AND TISSUE...103
9.1 D isk D esign ... 103
List of Symbols
Symbol Description Units
A area under hyperemia curve kg/m3
a radius of disk-shaped thermistor probe m
a * radius of spherical approximation m
c specific heat J/(kgK)
h height of disk thermistor probe m
I current passing through the thermistor probe A
k thermal conductivity W/(mK)
L characteristic length used in non-dimensionalization m
N sample size (Ch. 3) or intermediate parameter (Ch. 4)
q heat W
q heat flux W/m2
q"' volumetric heat generation W/m3
r distance from origin/axis in spherical/cylindrical coordinates m
R radius of T,,=Ti boundary condition in FDM m
t time s
T temperature C
t* dimensionless time
v temperature minus initial temperature *C
w tissue perfusion [1 kg/(m3*s) = 6 ml/(100g*min)]
kg/(m3s)
x general variable used in non-dimensional analysis
y general variable used in non-dimensional analysis
z depth in tissue, measured from free probe surface m
a thermal diffusivity m2/s
y dimensionless perfusion
_ deviation of adiabat from normal m
Ah finite-difference cell height m
Jr finite-difference cell width m
At time interval s
A Tb volume-averaged probe temperature minus T C
r_ sensitivity
0 dimensionless temperature
p density kg/m3
(P dimensionless thermal conductivity
List of Subscripts
Subscript Description
1 relating to the time interval from deflation to maximum in BART
2 relating to the time interval from deflation to baseline in BART
art arterial
b thermistor probe (originally from "bead")
base baseline
bl blood
calc calculated
cond conduction
conv convection
error error between true perfusion and calculated perfusion
i initial, i.e. before heating the thermistor probe
in inner disk
m tissue (originally from "medium")
max maximum
m,n indices of finite-difference cells
out outer ring
true true, actual
ven venous
List of Values'
Symbol Description Value Units
Cbl specific heat of blood 4187 J/(kgK)
km thermal conductivity of tissue 0.485 W/(mK)
kb thermal conductivity of thermistor probe material 0.1173 W/(mK)
Ti initial temperature of probe and tissue 35 0C
1 These are the values used in calculations throughout this thesis. They are within the range of normal values. For a more complete list of typical ranges of thermal properties of biological substances, see [34].
List of Figures
Figure 1.1 The microcirculation in the context of the entire circulation...19 Figure 2.1 The thermodiffusion probe produced by Hemedex, Inc. [15]...25 Figure 2.2 Temperature profile of thermistor probe and tissue before heating...25 Figure 2.3 Temperature profile of the thermistor probe and tissue after heating, at two
different levels of perfusion. k,=tissue thermal conductivity, I=current, R=probe re sistan ce . ... 2 6
Figure 2.4 Heating the thermistor probe: temperature vs. time and power input vs. time.
... 2 6
Figure 3.1 Non-invasive placement of the thermodiffusion probe (originally designed for invasive use) for non-invasive clinical study (the object shown is not the actual p ro b e )...4 3 Figure 3.2 Challenges and strengths of the thermodiffusion method...45 Figure 3.3 Non-collocation of event, test, and sense sites...46 Figure 3.4 Flow chart of segmentation, filtering, and analysis process. ... 47
Figure 3.5 Commonly used metrics in the Brachial Artery Reactivity Test (BART) (top curve is temperature, bottom curve is perfusion). ... 48
Figure 3.6 Results from the BART study: percent increase in flow (left) and time from deflation to maximum perfusion (right). Bars show one standard deviation.
N = sam ple size... . 49
Figure 3.7 Rate at which perfusion changes from increasing to decreasing or vice versa, at tw o different frequencies ... 50
Figure 3.8 Result from the study of the frequency at which baseline perfusion changes from increasing to decreasing or vice versa, analyzed at low frequency (band-pass filtered with cut-off frequencies at 0.025 and 0.06 Hz). N=sample size...50 Figure 4.1 Temperature profile in a spherical probe and surrounding tissue for various
levels of perfusion. Perfusion units are kg/m s. a=Imm and q .''=3MW/m3 . . . 73 Figure 4.2 Temperature profile in an infinite slab and abutting tissue for various levels of
perfusion. Perfusion units are kg/m s. h=Imm and q '''=0.3MW/m3. ... ... . . . 73
Figure 4.3 Sensitivity of wac on errors in the measurement of A Tb for a sphere, infinite cylinder and infinite slab. ... 74 Figure 4.4 Sensitivity of calculated perfusion on errors in the measurement of h, A Tb,
q b"' , k
n,
an d Cbl...74 Figure 4.5 Tw o probe designs. ... 75Figure 4.6 Increasing the ratio of a0u, to ain causes the heat transfer pattern in the tissue
abutting a disk to approach the pattern in tissue abutting an infinite slab, as evidenced by the fact that the adiabat approaches a straight line. The size of the outer ring shown here is for au,/ain=4.3. In all cases, ai,=0.35mm...76 Figure 4.7 Two-dimensional designs and their proposed one-dimensional models...77 Figure 4.8 Flow of information in the thermodiffusion method...78 Figure 4.9 In modeling the disk-shaped probe as a hemisphere, the radius of the
hem isphere, a*, is a free variable. ... 79
Figure 4.11 Validation of the finite-difference model with Carslaw & Jaeger's exact solution of the temperature profile in a semi-infinite, unperfused medium heated with uniform flux over a spherical region on its surface [45]. ... 81
Figure 4.12 Validation of the finite-difference model of a heated sphere in perfused tissue. Wtrue and wcalc are compared according to the method presented in Section 4 .6 .1 . ... 8 1
Figure 4.13 Output from the finite-difference model of the Disk design: 4Tb vs. w, for
two probe radii (in mm). h=0.2mm. q .''=7.5MW/m3 for a=lmm and
qb ''=O M W /m l 3 for a=0.5m m ... 82
Figure 4.14 Output from the finite-difference model of the Disk and Ring design: 4 T vs.
w, for two values of a0 ,/ain (aou,=2mm in both cases). h=0.2mm.
qou,' ' qin' '= 5M W / i 3. ... . . . .. . . .. . . 82
Figure 4.15 Disk design: Wcalc vs. Wtrue for the hemi-spherical model for various choices
of a* (see 4.8.1 for criteria) and the planar model. Left: a=lmm; Right: a=0.5mm.84 Figure 4.16 Disk and Ring design: Wcalc vs. WIrue for the planar model for two values of
the ratio aou/ain (aou,=2mm in both cases). ... 85
Figure 7.1 Layout of the FDM, including cell nomenclature (lower left)...95 Figure 8.1 4 Th vs. R (slid line) with second-order polynomial fit (dashed line) and
equation. C orrelation= 1...102 Figure 9.1 Disk design: tissue isotherms at w=0 (top: far-view, bottom: close-view). Axis
dimension: mm; temperature dimension: C. T,=35*C. ... 104
Figure 9.2 Disk design: tissue isotherms at w=5 kg/m3s (top: far-view, bottom: close-view). Axis dimension: mm; temperature dimension: C. T=350C. ... 105
Figure 9.3 Disk design: tissue isotherms at w=15 kg/m3s (top: far-view, bottom: close-view). Axis dimension: mm; temperature dimension: C. T=350C. ... 106
Figure 9.4 Disk design: probe isotherms at w=0 (top), w=5 kg/m3s (middle), and w=15
kg/m3s (bottom). Axis dimension: mm; temperature dimension: 'C. Ti=35*C. ... 107
Figure 9.5 Disk and Ring design: tissue isotherms at w=0 (top: far-view, bottom: close-view). Axis dimension: mm; temperature dimension: C. T,=35"C. ... 108 Figure 9.6 Disk and Ring design: tissue isotherms at w=5 kg/m3s (top: far-view, bottom:
close-view). Axis dimension: mm; temperature dimension: C. Tj=35C...109 Figure 9.7 Disk and Ring design: tissue isotherms at w=5 kg/m3s (top: far-view, bottom:
close-view). Axis dimension: mm; temperature dimension: C. Tj=35C...110 Figure 9.8 Disk and Ring design: probe isotherms at w=0 (top), w=5 kg/m3s (middle),
and w= 15 kg/m3s (bottom). Axis dimension: mm; temperature dimension: 'C.
List of Tables
Table 1.1 Current methods of measuring perfusion in a clinical setting ... 19
Table 2.1 The development of the invasive thermodiffusion probe from the 1960's until p re se n t...2 7
Table 3.1 Two tests for endothelial dysfunction. ... 43 Table 3.2 Comparison of three of the most popular sense methods used in tests of
endothelial dysfunction... 44 Table 4.1 w ,alc vs. wtrue for a=lm m . ... 83
1
Introduction
1.1 Motivation
The main function of the circulation is to deliver 02 and nutrients to tissue and remove CO2 and other waste products; transport substances, such as hormones, platelets,
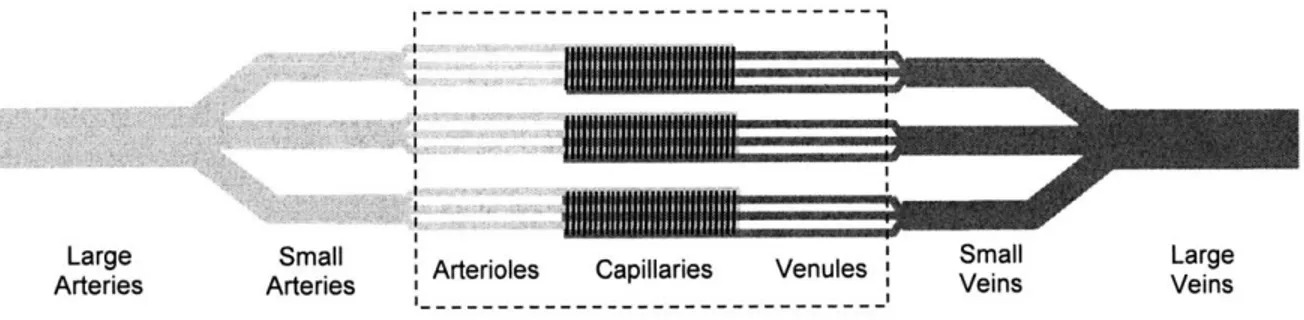
and white blood cells to specific sites in the body; distribute water, solutes and heat throughout the body; and generally maintain homeostasis. Most of these functions involve delivery or removal of gases or solutes or heat. The major site of this exchange is the microcirculation. Figure 1.1 shows a diagram of the circulation. The microcirculation is comprised of arterioles, capillaries, venules, and arteriovenous anastomoses. The blood flowing through this microcirculatory network is defined as tissue perfusion, or simply perfusion. Blood flow through larger vessels is spatially focused and directional. In contrast, tissue perfusion is more of a non-directional, volumetric measure. Perfusion is discussed more formally in Section 4.1.2.
Although there exist many modalities for quantifying blood flow in larger vessels, there currently exist no routine, non-invasive methods for quantifying microcirculatory blood flow (i.e. perfusion) in absolute units in a clinical setting. Given the abundance of exchange that occurs in the microcirculation, however, it is not surprising that an
accurate, real-time knowledge of microcirculatory flow would be invaluable in many applications.
1.2 Applications
Potential applications of a non-invasive perfusion probe are many and involve both research and clinical care. Being non-invasive, the probe would be ideally suited for routine check-ups or semi-permanent measurements. In addition to the applications for which the probe must be non-invasive, many of the applications that have in the past employed an invasive probe would greatly benefit from switching to a non-invasive probe, thereby reducing the risk of the procedure, patient suffering, expense, and healing time. Examples of applications of a non-invasive probe include:
* Monitoring ischemia and wound repair in diabetes
* Testing the effect of pharmacological agents on the microcirculation * Managing shock in a critical care setting
* Investigating vasomotor activity as a potential indicator of cardiovascular status
" Observing the impact of therapy, diet, and life style changes on the
microcirculation
In addition, the thermodiffusion method offers the possibility of determining tissue thermal properties such as thermal conductivity and diffusivity [1].
1.3 Other Methods
Methods of measuring perfusion currently used in a clinical setting can be roughly divided into two groups depending on whether the measurement is relative or absolute [2]. Table 1.1 lists the most common techniques. Relative measurement techniques include those which measure tissue perfusion directly, but in relative units, and those techniques which measure another quantity, such as blood flow through large vessels (in absolute or relative units), from which tissue perfusion (in relative units) can then be extrapolated. Table 1.1 also divides the measurement modalities into invasive and non-invasive techniques, showing that there is currently a complete lack of clinical techniques which measure perfusion non-invasively and in absolute units.
Bowman [3], Valvano [2] and Walsh [4] present a more thorough review of current and past techniques for measuring tissue perfusion. Webster's book on medical instrumentation is a good resource for learning about common blood flow measurement techniques (through large vessels) [5].
---Large Small Arterioles Capillaries Venules
Arteries Arteries |
Figure 1.1 The microcirculation in the context of the entire circulation.
Relative Perfusion Absolute Perfusion
Angiography Xenon Washout
Indicator Dilution PET
Invasive Thermal Clearance
Thermodiffusion
Temperature & Color Blood pressure Plethysmography Non-invasive Laser Doppler
MRI
Ultrasound Doppler
Table 1.1 Current methods of measuring perfusion in a clinical setting.
Small Large
2 Thermodiffusion Probe
2.1 Basic Operation
The thermodiffusion method is a technique by which tissue perfusion can be measured. The method works much like a hot-wire anemometer in that perfusion is determined from the rate at which heat is conducted and convected away from a heated probe. Bowman et al. have developed an invasive thermodiffusion probe [1, 6]. It consists of a spherically-shaped self-heatable thermistor probe perched at the end of a catheter sheath or hypodermic needle, and is meant to be placed in, and completely surrounded by, perfused tissue (see Figure 2.1).
Measuring perfusion by the thermodiffusion method involves the following steps:
1. A thermistor probe is placed in perfused tissue and the baseline or initial tissue
temperature, Ti, is established (see Figure 2.2).
2. The thermistor probe is self-heated such that its temperature is raised to and maintained at a fixed value above Ti (see Figure 2.3). The difference between the volume-averaged probe temperature and T is defined as J Tb. The
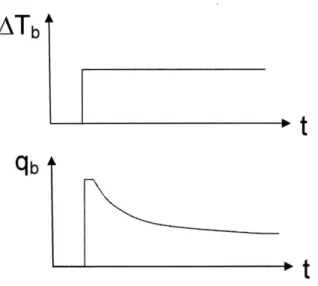
volume-averaged temperature of the thermistor probe reaches its steady-state value almost instantaneously, while the power, q, required to establish and maintain this temperature is initially very large and then drops off to a steady-state value (see Figure 2.4). The power applied to heat the thermistor probe in the form of resistive heating (I2R) escapes by conduction (q'",nd) through the tissue and by
convection (q',) due to perfusion. The convection of heat due to perfusion is discussed in more detail in Section 4.1.2.3.
3. From a knowledge of the controlled probe temperature, z Tb; the power required to maintain it, q; and other, physical parameters of the probe and the surrounding tissue, perfusion is calculated using an analytical or numerical model.
Rather than presenting the governing equations and solutions for the invasive method here, I refer the reader to the work by Bowman, Balasubramaniam and Valvano
[1, 6, 7], and instead give a more detailed presentation of the governing equations,
2.2 History of the Development of the Invasive Probe
In a nutshell, the development of the invasive thermodiffusion method consisted of laying the intellectual foundation for perfusion extraction and then building and testing prototypes to validate the theory. Once a prototype had been built and the method had been validated, a commercially marketable device was developed and in-depth animal and human studies were performed in order to obtain regulatory approval, and efforts are currently underway to incorporate real-time, absolute perfusion measurement into the clinical setting (see Table 2.1).
The intellectual foundation of the thermodiffusion method consists of the design of the sensor, the formulation of the thermal model of this sensor, and the creation of an algorithm to extract perfusion from the thermal model. The bulk of this work was
performed during the 1970's and early 1980's by H. Frederick Bowman and his graduate students and colleagues (mainly T.A. Balasubramaniam and J.W. Valvano), first at Northeastern University in Boston, MA, and then at the Massachusetts Institute of Technology in Cambridge, MA.
Earlier, in 1968, Chato had proposed inserting a small, heated, spherically shaped thermistor probe into biological tissues for the measurement of thermal properties. In his analysis, Chato modeled tissue perfusion as an increase in "effective thermal
conductivity", and the probe as a lumped thermal mass [8].
In the early 1970's, Bowman and Balasubramaniam performed a similar analysis, but modeled the probe as a distributed thermal mass. For this model, they found open-form transient solutions to the governing equations for the thermistor probe and the surrounding tissue, which provided an accurate technique for determining thermal properties of tissue [7, 9, 10].
Subsequently, Bowman and Balasubramaniam modeled tissue perfusion by the bioheat equation, an equation proposed in 1948 by Pennes to model the effect of perfusion on heat transfer in tissue [11]. They found the steady-state solution to this model for the probe and surrounding tissue, and proposed a method for calculating tissue
perfusion from a knowledge of the controlled temperature of the probe and the power required to maintain this temperature [6].
In 1979, Jain published the open-form, transient solution to a set of more
sophisticated governing equations in which he models the thermistor probe as consisting of an inner, heated core and an outer shell [12]. However, this more complicated model seems to add little to the overall accuracy of the method, and is therefore not used subsequently by Bowman.
Valvano greatly contributed to the intellectual foundation by formulating the closed-form, transient solution for a heated spherical thermistor probe in perfused tissue, which he published in his Ph.D. thesis in 1981 [2] and in the literature in 1984 [1]. The key to finding the close-form solution was to express the Laplace transform of the probe temperature and tissue temperature as a Frobenius series and then perform a term-by-term inverse transform. He also found that, contrary to what was assumed at the time, the power vs. time function required to suddenly heat a thermistor probe in perfused tissue to a fixed temperature is not the same as the function determined by Chato in the 1960's for a thermistor probe in non-perfused tissue, and Valvano determined the correct function. In summary, Valvano's work produced an algorithm for extracting perfusion from both the steady-state and transient models.
On this intellectual foundation, Balasubramaniam, Bowman, Valvano, Woods and others built and tested many prototypes. Hemedex Inc. was created in Cambridge, MA, to develop a commercial thermodiffusion device, and animal studies were performed to validate the thermodiffusion method and refine the device. During the 1990's the use of the device spread to brain surgery, reconstructive surgery, transplantation, and other fields of medicine, in the United States and abroad. Martin and Bowman validated the thermodiffusion probe with the radioactive microsphere technique in 2000 [13].
Regulatory approval was obtained in 2002, and today the Bowman Perfusion Monitor is the only device on the market capable of measuring perfusion in real time and absolute units.
A brief history of the perfusion measurement research performed before 1970 by
Von Rein; Hensel, Betz, and Bender; Grayson; and Perl and Hirsch is given by Walsh [4].
2.3
History of the Development of the Non-invasive Probe
Various attempts have been made to develop a truly non-invasive sensor that functions by the thermodiffusion technique, but as far as I know none of the concepts have had the capability of accurately tracking and quantifying quickly fluctuating perfusion in absolute units and in real time.
In 1979 Patera and others proposed a very elegant method for determining perfusion by measuring the phase shift between a sinusoidally applied heat flux at the tissue surface and the temperature response. This method has the strong advantage of not depending on the temperature of the probe or the tissue, but only "on frequency, phase shift, and intrinsic properties of the tissue" [14]. The principal disadvantage of this method is that the magnitude of the dynamic temperature response, and therefore the accuracy of the calculated perfusion, decreases with increasing driver frequency. Since only perfusion fluctuations that are slow compared to the driver frequency can be
measured, this technique cannot track perfusion above approximately 0.1 Hz. If the non-invasive probe is to be used to investigate vasomotor tone, which includes fluctuations above 0.1Hz (see section 3.4.1), another method must be used.
In 1984 Walsh showed that a non-invasive probe could be created using two flake thermistors. Upon analytically modeling the probe as an infinite slab and as a sphere (both 1-dimensional models), he found that the slab model is inadequate and that the spherical model is more appropriate. Experimental results showed that the non-invasive probe is sensitive to changes in perfusion [4].
In 2001 and 2002, I used the invasive probe in a non-invasive manner by placing the invasive probe on the backhand of approximately 75 subjects, some healthy and some with heart disease (see Chapter 3). In a nutshell, it was found that while the invasive probe was able to track perfusion very accurately in some cases, in most cases thermal communication between the probe and the tissue was too poor to establish or maintain a sensible signal. In addition, the meaningful signals that were obtained could not be relied on for absolute values of perfusion. It was therefore concluded that the thermodiffusion method had great promise for non-invasive use, but that a truly non-invasive probe
should be developed to address the issues of thermal communication and calculation of perfusion in absolute units.
Tko probe
is skown in compurion
to
a dime.
The
oew
probe
is*
lWdea
printed
depth
iawkaor.
Figure 2.1 The thermodiffusion probe produced by Hemedex, Inc. [151.
I I
qod n VTn
qb=I2R
w
q"',, (Perfusion)
ATb
Figure 2.3 Temperature profile of the thermistor probe and tissue after heating, at two different levels of perfusion. k,,,=tissue thermal conductivity, I=current, R=probe resistance.
ATb
qb A
Figure 2.4 Heating the thermistor probe: temperature vs. time and power input vs. time.
Upon heating, AT, reaches a fixed value almost instantaneously. The power required to achieve this step-change in temperature is initially very large, saturates, and then drops off to a steady-state value.
Clinical Studies 1992-present
Regulatory Approval 2002: Approval by the U.S. Food and Drug Administration
Animal Studies 1975-present
2000: Martin and Bowman validate thermodiffusion method against microsphere
technique [13].
2000: Vajkoczy et al. validate invasive thermodiffusion probe in human against Xe CT Validation Studies [16].
1999: Klar et al. validate thermodiffusion probe in pigs against Doppler flowmetry and
H-2 clearance [17].
1984: Valvano and Bowman validate thermodiffusion method in isolated, perfused rat liver system against multiple radioactive microspheres [18].
Device Development 2000-present Hemedex
1970-1999: Prototype evolution (12 generations).
Prototype 1989: Szaijda develops analog subsystem, data acquisition system [19, 20].
1984: Valvano et al. measure thermal conductivity, thermal diffusivity, and perfusion in small volumes of tissue [1].
Reduction Algorithm 1981: Valvano extracts perfusion from transient and steady-state models [2]. 1977: Bowman and Balasubramaniam extract perfusion from steady-state model [6].
1981: Valvano solves transient equations for distributed thermistor probe in perfused
tissue (closed form) [2].
1980: Bowman identifies thermally significant vessels [21].
1979: Jain solves transient equations for two-zone distributed thermistor probe in
perfused tissue (open form) [12].
Sensor Design & 1977: Bowman, Balasubramaniam, and Woods solve steady-state solutions for Thermal Modeling distributed thermistor probe in perfused tissue [6].
1977: Balasubramaniam and Bowman propose method for measuring thermal properties
of biomaterials [7].
1974: Balasubramaniam and Bowman solve transient equations for distributed thermistor probe in unperfused tissue [9].
1968: Chato solves transient equations for lumped thermistor probe in perfused tissue [8].
3 Clinical Study: Using the Invasive Probe in a
Non-invasive Manner
3.1 Introduction
3.1.1 Cardiovascular Disease and Atherosclerosis
As of 1998, cardiovascular disease had been the number one cause of death in the
USA since 1918. It accounted for 45% of all deaths, claiming more lives than the next
seven leading killers combined. The underlying problem in cardiovascular disease is atherosclerosis {Study, 1998 #25}.
Atherosclerosis is the formation of fibrofatty plaques in the vascular lumen, resulting in calcification and weakening of the vessel wall. Photos of a normal coronary artery as well as one with build-up of atherosclerotic plaque can be found in [23]. Complications of atherosclerosis include hemorrhage, plaque rupture, and thrombosis. Common clinical manifestations include heart attack, stroke and aneurysm [24]. The initiating event in atherosclerosis is endothelial dysfunction [25].
3.1.2 Endothelial Dysfunction
The endothelium is a monolayer of cells that lines the entire vascular system. As a semi-permeable membrane, the endothelium is critical to vessel wall homeostasis and blood flow. Its functions are many and include [24]:
- Modulating vascular tone and blood flow
- Maintaining the non-thrombogenic blood-tissue interface
- Metabolizing hormones
- Regulating immune and inflammatory reactions - Modifying lipoproteins in the vessel wall
- Regulating growth of other cell types, particularly smooth muscle cells
Endothelial dysfunction, which describes "changes in the functional state of endothelial cells," is the initiating event in atherosclerosis and plays a role in the disease
process as well [24]. The endothelium becomes damaged decades before the development of atherosclerosis and following cardiac events.
3.1.3 Assessment of Endothelial Dysfunction
Many techniques have been developed for evaluating the health of the
endothelium and thereby assessing the onset or progression of atherosclerosis. Anderson presents a review of the assessment and treatment techniques of endothelium dysfunction in humans [25]. "Local vascular control depends on a balance between dilators and constrictors, with endothelium-dependent nitric oxide (NO) being the best characterized and probably the most important. Nitric oxide is stimulated by a variety of stimuli that serve as the basis for the assessment of endothelium-dependent vasodilation" [25].
Two vasodilator stimuli used in the assessment of endothelial function are administration of acetylcholine and flow-mediated vasodilation. The intracoronary administration of acetylcholine has been the gold standard in testing for endothelial dysfunction. Acetylcholine triggers the healthy endothelium to release nitric, causing the blood vessel to vasodilate. In contrast, acetylcholine vasoconstricts the diseased vessel.
Flow-mediated vasodilation (FMD) involves temporary occlusion of a vessel using a blood pressure cuff. Cuff deflation results in reactive hyperemia, which is a temporary increase in blood flow beyond the baseline level. Most often, the occluded artery is the brachial artery, and the technique is called Brachial Artery Reactivity Test (BART). The magnitude of the reactive hyperemia has been shown to correlate with coronary endothelial dysfunction [26]. Table 3.1 presents these two techniques (administration of acetylcholine and FMD).
A variety of sense techniques are available for each of these two methods. Some
are listed in Table 3.2, along with their advantages and disadvantages. It is clear that a non-invasive, cheap, easy-to-use technique that gives perfusion in real time and absolute
3.2 Data Gathering
During Summer 2001 and January 2002, I used the invasive thermodiffusion probe in a non-invasive manner in order to measure tissue perfusion in the backhands of approximately 80 subjects. The goal of the study was three-fold:
1. Establish a protocol.
2. Determine the feasibility of using the invasive thermodiffusion probe non-invasively
3. Perform BART on subjects with and without heart disease in order to study the
impact of heart disease on endothelial function and vasomotor activity of peripheral tissue
3.2.1 Protocol
3.2.1.1 Probe Placement
Location
It makes sense to place the probe on tissue with a high capillary density. This suggests placing the probe in or close to the digital district as opposed to the forearm. Informal studies have shown that it is much easier to pick up a sensible signal on the hand/fingers than on the forearm.
Complete Enclosure
Since the perfusion extraction algorithm assumes a 4n-geometry (spherical probe completely and symmetrically surrounded by tissue), it is critical that the probe have as much contact as possible with the surrounding tissue. Most importantly, this will decrease the likelihood that a slight disturbance in probe position or orientation would disrupt the measurement.
As shown in Figure 3.1, probes (object shown is not actually the probe) were placed on the backhand, between the thumb and the index finger, and the thumb and the index finger were brought together, enclosing the probe (as well as approximately 10-15mm of wire). The thumb was then taped to the rest of the hand in such a manner that
the subject could relax his/her hand but the probe would not move. It is important that the "squeezing pressure" be below the capillary collapse pressure.
"Squeezing Pressure" vs. Capillary Collapse Pressure
It is important that the pressure with which the probe pushes against the tissue not substantially diminish perfusion, let alone occlude the capillaries. Martin has shown that a pressure of approximately 5mmHg should not be exceeded [27].
3.2.1.2 Contact Gels
Standard ultrasound gel was used for some of the measurements. It is difficult to say whether its use improved the measurements. No negative effects were observed.
3.2.1.3 Insulation of the Hand
Wrapping the hand in a towel or blanket insulates it from air currents and
temporary changes in room temperature. Also, it is assumed that the amount of heat lost along the probe wire is decreased. However, insulating the hand does drive the hand temperature up.
3.2.1.4 Manual Mode vs. Automatic Mode
The Bowman Perfusion Monitor produced by Hemedex allows for manual or automatic operation. In automatic operation, the software will recalibrate if limits in certain parameters have been exceeded. During the occlusion phase of BART, perfusion drops to zero, and the software will often command a recalibration, frustrating the
measurement (and the measurer). Manual operation sidesteps this problem. However, it is possible that a recalibration really is necessary, and the measurement in manual mode would continue despite the need for recalibration.
3.2.1.5 Patient at Rest
Because the probe is not actually completely surrounded by malleable tissue but is instead in contact with tissue on some areas of its surface and with air/liquid on other areas, slight perturbation in the probe's position and/or angular orientation can cause huge, non-physiological spikes or drops in measured perfusion. It is therefore critical than
the subject's arm, hand and fingers be at complete rest. Interaction with doctors, nurses or family must be avoided. Even using his/her other hand, e.g. to change the TV channel, can disturb the measurement.
3.2.1.6 Measurement Duration
Various protocols have been used by different groups. Except for the sense site and method, the protocol used in this study is representative of many other BART studies found in the literature.
Ideally, after the calibration period, a 5-minute baseline measurement is recorded. Subsequently, the cuff is quickly inflated to approximately 50mmHg above systolic blood pressure (some groups set a safe, fixed pressure for all subjects, e.g. 200mmHg) and left inflated for 5 minutes, then deflated. After deflation, the measurement should be
continued until perfusion has returned to its baseline value. This typically takes between 5 and 15 minutes. If studies of post-occlusion baseline are planned, the measurement should be continued for some time after perfusion has returned to baseline values. If pre-or post-occlusion baseline perfusion is to be analyzed in the frequency domain,
measurement duration and sampling frequency must be chosen such that the desired bandwidth and resolution are obtained (see section 3.4.5).
3.2.2 Measurement Issues
Many difficulties arose in making perfusion measurements. The most typical measurement challenges are shown in the middle row of Figure 3.2. They include:
1. Failure to detect physiological baseline perfusion
2. Failure to detect zero perfusion during occlusion despite high occlusion pressure
3. Non-physiological spikes and drops in perfusion
There may exist simple explanations for some of these challenges. For example, consider the middle row of Figure 3.2. Bowman [28] has suggested that both of these plots may show normal measurements that are shifted downward or upward due to an
offset caused by a deviation from assumed model conditions (e.g. the 47r-geometry assumption).
Perfusion measurements were performed on 80 subjects. A stable baseline
measurement was obtained for approximately 65% of subjects. Of those measurements it was possible to perform and record BART on 45%, resulting in 21 good BART
measurements (13 of those measurements were recorded from patients with heart disease, and 8 without heart disease).
Despite this rather low success rate, the measurements clearly prove the feasibility
of a non-invasive thermodiffusion probe. For example, in many cases, the probe was able to very nicely track drops and rises in perfusion due to BART. Also, as shown in the bottom row of Figure 3.2, the probe is capable of picking up high- and low-frequency signals undetectable by most other routine techniques. This frequency information can be used in analyzing vasomotor activity, as discussed in section 3.4.5. It appears possible that these capabilities could be harnessed and the difficulties discussed above overcome if a truly non-invasive thermodiffusion probe were designed and developed-hence the efforts presented in chapter 4 of this thesis to design a truly non-invasive thermodiffusion probe.
3.2.3 Non-collocation of Event, Stimulus, and Sense Sites
In this study, the site where
1. the events, such as myocardial infarction and stroke, occur (i.e. the heart),
2. the test stimulus (i.e. occlusion) is administered (i.e. the brachial artery, upper arm), and
3. the response to the stimulus is sensed using the thermodiffusion method (i.e. the
backhand)
are all non-collocated, as depicted in Figure 3.3. Unfortunately, the three-way relationship between these sites is not obvious. Vita and Keaney discuss this issue in particular in their 2002 editorial [29].
In hindsight it is clear that collocating these sites and/or posing a more tractable and straightforward research question would have led to more useful data. The usefulness of this study rests mainly in the evidence that the invasive thermodiffusion probe, even when applied non-invasively, tracks perfusion and temperature very closely, with a high
temporal resolution, and in real time, and that the development of a truly non-invasive probe should be pursued.
3.2.3.1 Event Site to Test Site
The reason why the event and test sites were separated is that "although assessment of coronary endothelial function is clearly germane for coronary artery disease events, this methodology is limited by the risk and expense of coronary
angiography and selective intracoronary agonist infusion. As a consequence, there has been considerable interest in the study of endothelial vasomotor function in more accessible vascular beds, such as brachial circulation... The relevance of the brachial circulation to coronary and carotid artery events is not obvious. However, the systemic nature of many risk factors makes it plausible that they might affect central and
peripheral arteries in a parallel manner. Indeed, studies suggest that endothelial dysfunction detected noninvasively in the arm correlates with coronary endothelial dysfunction [26]. Despite these findings, it is well recognized that physiological mechanisms differ importantly according to vascular bed" [29].
3.2.3.2 Test Site to Sense Site
In many published studies, test and sense sites are collocated. In other words, the response of the brachial artery to BART is measured in the brachial artery, using methods such as ultrasound and laser doppler flowmetry. Non-invasive thermodiffusion seems to work best in tissue with a high capillary density such as the skin of the hand and fingers.
For this reason the test and sense sites were non-collocated. Cuff inflation and deflation on the upper arm are immediately detectable and traceable in the measurement of perfusion on the backhand, showing clearly that there exists a strong relationship with very little time lag. No doubt the signal received at the backhand is a filtered version of what originates in the upper arm, though the exact filter is unknown.
Also, the non-collocation of test and sense site in flow-mediated vasodilation is not without precedent [30].
3.3 Database of Measurement Data and Subject Information
The measurement data and subject information for each patient were compiled in a database, as outlined below.
3.3.1 Measurement Data
The measurement data, automatically collected by the thermodiffusion monitor, include (all vs. time):
* probe temperature
" skin temperature (measured by the passive thermistor probe) " power
" perfusion calculated by the transient model
* perfusion calculated by the steady-state model
as well as six other parameters. Measurements were made at 10 Hz and typically lasted about 25 minutes, adding up to approximately 15,000 measurements of each of 11 parameters for each of approximately 80 subjects. These data were converted and stored in matrix format in MATLAB for easy manipulation and analysis.
3.3.2 Subject Information
The following information was recorded for each subject: * gender
* age * weight
* current medication
The following yes/no information was recorded for each subject:
* coronary artery disease (any history of coronary intervention automatically qualified)
" diabetes mellitus
* hyperlipidemia (normally evaluated by looking at prescribed medications) * hypertension
0 family history of heart disease
3.4
Analysis
3.4.1 Physiological Issues
Blood flow is a complex, dynamic phenomenon in space and time. It is influenced
by numerous factors both locally and systemically. For purposes of this clinical study, the
following understanding is important:
* "THE PRIMARY FUNCTION OF THE CUTANEOUS CIRCULATION IS MAINTENANCE OF A
CONSTANT BODY TEMPERATURE. Consequently, blood flow to the skin fluctuates widely depending on the need for loss or conservation of body heat" [31]. This
severely complicates the analysis of baseline or steady-state perfusion. Local perfusion can change suddenly in a step-like manner, making it difficult to
determine a baseline value in the first place, and making it clear that any comparison between baseline values over time is suspect.
* Cutaneous circulation contains oscillations, and "there are indications that these oscillations may represent the influence of the heart beat, the respiration, the intrinsic myogenic activity of vascular smooth muscle, and the neurogenic activity on the vessel wall, with frequency around 1, 0.3, 0.1, and 0.04 Hz, respectively... In addition, periodic oscillations with a period of I min (0.0 1Hz) have been demonstrated..." [32].
3.4.2 Filtering
Like much of biological data, the collected perfusion and temperature data
contained much noise, artifact, and human variability. Therefore, it was necessary to filter the data prior to statistical analysis. As shown in Figure 3.4, the measurements were first manually segmented using the following information:
" a record of unusual events during the measurement
" an understanding of normal physiological baseline values and responses
* known characteristics of the thermodiffusion device
The data were then analyzed in the frequency domain, where non-physiological oscillations (presumably stemming from instrument artifacts) were filtered out. In hindsight, there is some concern that the manual segmentation and filtering could have subjectively corrupted or biased the data by removing what were thought to be abnormal (assumed to be artifactual) features.
The perfusion and temperature data were both split into baseline and BART segments and statistically correlated with whether or not the subject had heart disease. Perfusion and temperature analysis are each discussed in turn.
3.4.3 Perfusion
In the past, the analysis of BART studies has focused on the way vessel diameter (and therefore perfusion) reacts to reopening of the artery upon cuff deflation, but useful
information may be gleaned from investigating baseline perfusion as well. The high-sampling rate and high accuracy of the thermodiffusion method makes baseline examination feasible.
3.4.3.1 BART
The analysis of flow-mediated vasodilation data has generally been limited to observing how simple BART characteristics vary between subjects. Typical
characteristics include [33]:
* maximum increase in the post-stimulus vessel diameter as a percentage of baseline diameter (this is the most commonly used characteristic)
* time from cuff deflation to maximum response
* duration of the vasodilator response * area under the dilation curve
By the thermodiffusion method, perfusion is measured instead of vessel diameter.
Analogous characteristics can be defined as (see Figure 3.5):
* maximum hyperemic increase in perfusion (Wmax-Wbase) as a percentage of baseline perfusion:
100 x Wmax - Wbase Wbase
" time from cuff deflation to maximum response, At " duration of the vasodilator response, At2
" area under the dilation curve, A
The last two characteristics, At2 and A, require that perfusion return to baseline,
and that the measurement be continued to that point. In many cases, post-maximum perfusion was non-physiological, or the measurement was terminated pre-maturely for other reasons. The result was that the final sample size was too small to compare subject populations on the last two characteristics.
Figure 3.6 shows the change in post-stimulus perfusion and time to maximum response for healthy and heart-diseased subjects. The bars indicate one standard deviation.
3.4.3.2 Baseline
As discussed in 3.4.1, comparing baseline perfusion values at different times or between subjects is highly problematic. However, it is reasonable to suggest that some aspect of baseline perfusion may be affected by endothelial dysfunction and
atherosclerosis. As seen in Figure 3.2, perfusion can be highly variable over a large frequency range. In other words, perfusion contains relatively large fluctuations of a variety of frequencies. Some component of this variation may correlate with endothelial dysfunction. Because most methods are not suited to long, high-sampling rate perfusion measurements, no standard procedure for analyzing baseline perfusion exists. One candidate is to look at how often the perfusion vs. time curve changes from increasing to decreasing or vice versa, or, alternatively, how often it crosses over an average value. This is close to, but distinct from, a simple spectral analysis because the magnitude of the oscillation at a specific frequency bears no weight.
As shown in Figure 3.7, determination of the frequency with which a data set changes from increasing to decreasing or vice versa is dependent on the frequency range under consideration. In other words, one can count high-frequency, low-magnitude jitter, or low-frequency, high-magnitude changes, or anything in-between. Thus it is possible to
create a continuum of 'frequency at which a data set changes from increasing to decreasing or vice versa' vs. 'frequency range under examination'.
In practice, one can low-pass or band-pass filter the data set with filters of various cut-off frequencies, and count the number of times the data set changes from increasing to decreasing or vice versa. Dividing the number of changes by the time interval of the
data set gives the frequency of change.
Figure 3.8 shows the frequency of change at low frequencies (band-pass filtered with cut-off frequencies of 0.025 and 0.06 Hz) for healthy and heart-diseased subjects. The lack of statistically significant differences is typical of the results obtained from this frequency continuum.
3.4.4 Temperature
Since the main function of the cutaneous circulation is thermal regulation, which is achieved by orchestrating the flow of perfusion through the complex microcirculatory network, it is conceivable that some aspect of a subject's temperature vs. time profile, whether baseline or in BART, might correlate with endothelial dysfunction and atherosclerosis. However, exactly what aspect would provide such a correlation is unclear, and it seems probable that such a correlation would be a step removed from a more direct correlation between endothelial dysfunction and perfusion.
Nevertheless, various characteristics of the temperature vs. time profile were examined. Following are most of the examined characteristics, divided into BART and baseline.
3.4.4.1 BART
The slope of the temperature vs. time profile during occlusion, as well as the total temperature drop during occlusion, were investigated.
3.4.4.2 Baseline
In the time domain, the mean and standard deviation of the temperature vs. time profile were examined. The signal was also investigated in the frequency domain. Several
thermodiffusion device. Also, the "frequency of change" analysis introduced in section 3.4.3.2 was applied to the temperature profile.
Unfortunately, the correlations between these temperature characteristics (in BART and baseline) and the subject's disease state proved either statistically
insignificant or physiologically meaningless, and are therefore not reproduced in this thesis.
3.4.5 Frequency-domain Analysis
As stated above, it is reasonable to think that differences might exist in the
frequency spectrum of the perfusion vs. time profile (and possibly of temperature as well) between subjects with and without endothelial dysfunction. In the past, low sampling rates and short measurement durations have precluded thorough investigation of the frequency spectrum. However, some methods, such as the thermodiffusion method, are capable of providing high sampling rates, and could therefore be used to gather data for examination in the frequency domain. For example, the data for this study were gathered at 10 Hz, and the average duration of recorded stable baseline perfusion was
approximately 2 minutes (120 seconds). The highest non-aliased frequency is given by the Nyquist theorem as 5 Hz, and the lowest frequency is given by the frequency resolution as 1/120s=0.0083 Hz.
Though no statistically significant correlations were obtained from the data of this study, it is reasonable to think that frequency domain analysis of perfusion may provide a valuable view of the differences between subjects with and without endothelial
dysfunction. Kvernmo et al. present some of the promises and challenges associated with the frequency domain analysis of perfusion [32].
3.4.6 Conclusions
The goal of this study was three-fold: to establish a protocol, to investigate the feasibility of a non-invasive thermodiffusion probe, and to study correlations between cutaneous circulation (in baseline and BART) and endothelial dysfunction. Several conclusions can be drawn:
3.4.6.1 Feasibility of a Non-invasive Thermodiffusion Probe
"
The thermodiffusion method, applied non-invasively, is sometimes capable of tracking (relative) perfusion very closely." The thermodiffusion probe offers advantages over other perfusion measuring
devices, such as high sampling frequency, which could be very useful in analysis.
" However, most of the time, poor thermal communication between the probe and
the skin caused unstable and non-physiological signals. In addition, when stable signals were obtained, the absolute magnitude had no meaning since the model assumption of isotropic 47r-geometry was not valid.
" Therefore, the development of a truly non-invasive should be pursued.
3.4.6.2 Cutaneous Circulation and Endothelial Dysfunction
* Although the initial sample population was large, much of the data were non-physiological and therefore discarded. The resulting final data set was quite small (only 21 good BART tests).
* BART studies in the literature show a correlation between endothelial dysfunction and characteristics of vessel diameter vs. time, as discussed in section 3.4.3. The data in this study were not found to be statistically significant with regard to analogous perfusion characteristics. This lack of statistically significant results was likely caused by a combination of two of the major difficulties of this study: measurement noise caused by poor thermal communication and poor thermal
stability at the probe-tissue interface; and non-collocation of event, stimulus, and sense sites.
* The non-collocation of event site, test site, and sense site made interpretation of results difficult.
* With a high sampling rate and the possibility of long-duration measurements, a reliable non-invasive thermodiffusion method/probe would allow for new analysis techniques, especially frequency domain analysis of baseline perfusion.
Figure 3.1 Non-invasive placement of the thermodiffusion probe (originally designed for invasive use) for non-invasive clinical study (the object shown is not the actual probe).
Stimulus
Normal
Dysfunction
function
Acetylcholine
vasodilation
vasoconstriction
(Gold Standard)
Temporary
occlusion
(Brachial Artery
Reactivity Test)
" Perfusionai
T
inflation deflation inflation
ti
deflation Time
Table 3.1 Two tests for endothelial dysfunction.
Upon intracoronary administration of acetylcholine, the healthy vessel vasodilates while the diseased vessel vasoconstricts; following temporary occlusion, the healthy brachial artery shows more
pronounced reactive hyperemia compared to the diseased artery.