DESIGN AS A SEARCH PROBLEM: INTERACTIVE
VISUALIZATION FOR SYSTEM DESIGN UNDER UNCERTAINTY
by
Michael Dale Curry
M.B.A. Business Administration - Georgia Institute of Technology, 2012 M.S. Aerospace Engineering - Georgia Institute of Technology, 2004
B.S. Mechanical Engineering - University of Kentucky, 2001
Submitted to the Department of Aeronautics and Astronautics in Partial Fulfillment of the Requirements for the Degree of
Doctor of Philosophy in Aeronautics and Astronautics at the
Massachusetts Institute of Technology June 2017
0 2017 Massachusetts Institute of Technology. All rights reserved. Signature of Author...Signature
redacted
Department of Aeronautic and Astronautics May 18, 2017
Certified by...
Signature redacted
Daniel E. HAtings Cecil and Ida Green Education Professor of Aeronautics and Astronautics Thesis ChairCertified by...Signature
redacted
Adam M. Ross Lead Research Scientist, Systems EngineerinA angement Research Initiative
K
/thesi Committee MemberCertifiedby...Signature
redacted
Remco angAssociate Professor, Comp r Science, Tufts Uni ersity
IThesis Committee ember Certified by...Signature
redacted
Olivier de Weck
Professor of Aeronautics and Astronautics Thesis Committee Member
Accepted by...Signature
redacted
...
Youssef M. Marzouk Ass ciate Professor of Aeronautics and Astronautics Chair, Graduate Program Committee MASSACHUSETTS INSTITUTEOF TECHNOLOGY
SEP 2
7
2017
LIBRARIES
DESIGN AS A SEARCH PROBLEM: INTERACTIVE VISUALIZATION FOR SYSTEM DESIGN UNDER UNCERTAINTY
by
Michael Dale Curry
Abstract
In 2011, the Office of the Secretary of Defense (OSD) identified the need for improved methods of performing early conceptual trade studies and lifecycle analysis to design systems effective in a wide range of situations and adaptable to many others. This surge in interest within the DoD has been driven by a recognition that as systems grow in scale and complexity, and consequently cost, traditional methods of addressing design and operational uncertainties will no longer suffice. These challenges, which are not unique to the DoD, can be more broadly characterized as the need to achieve sustained value delivery from systems despite perturbations in design, context or stakeholder needs. Epoch Era Analysis (EEA) was developed to better model problems with lifecycle uncertainties and has demonstrated its usefulness in prior research studies, but it still faces significant challenges to practical application. Specifically, EEA can result in large, multivariate datasets that are difficult to generate, visualize and perform analysis on. When performing exploratory analysis on such model-generated data sets, human interaction is often necessary to identify important subsets of the data, resolve ambiguity or find inconsistencies. Although prior research towards methods for applying EEA constructs has been performed, a prescriptive framework that explicitly considers human interaction does not exist. To make informed decisions, and design successful strategies for value sustainment, effective visualization and analysis techniques are needed to derive valuable insights from this data. These challenges motivate this thesis research.
The aim of this thesis is to leverage recent research in visual analytics and advanced systems engineering methods to develop a rigorous framework, with associated methods, processes, metrics and prototype applications that will result in new capabilities that better enable analysis and decision-making for long-run value sustainment. Several research contributions are outcomes of this thesis. First, the Interactive Epoch Era Analysis (IEEA) framework is introduced as a methodology for analyzing lifecycle uncertainty when designing systems to achieve sustained value delivery. IEEA provides a coherent theoretical framework to guide the development of human-usable analytic tools for early-stage system concept selection. Next, new interactive visualization applications for system concept selection are introduced to demonstrate the feasibility, usefulness and scalability of IEEA as an integrated visual analytics system. Finally, to characterize the benefits of interactive visualization applications for engineering design problems, the results of a controlled human-subjects experiment are presented.
Thesis Chair: Daniel E. Hastings
Title: Cecil and Ida Green Education Professor of Aeronautics and Astronautics and Engineering Systems
Acknowledgements
First and foremost, I would like to thank my committee - Prof. Dan Hastings, Dr. Adam Ross, Prof. Remco Chang, and Prof. Oli de Weck - for their encouragement and for allowing me the freedom to pursue this research. I am incredibly fortunate to have had the opportunity to work with them over these last several years and benefit from their considerable experience and knowledge. Their wealth of expertise comes with enormous demands on their time, yet they have always managed to find time to offer me valuable advice along the way.
This work was made possible through the generous support of the Charles Stark Draper Laboratory Fellowship program. I have benefited, not only from the financial support of the lab, but also through collaboration with the many staff members with whom I've had the pleasure of working with over the years. Special thanks goes to Lena Valavani for all her help brainstorming ideas as well as proofreading drafts of this thesis. Steven Berguin and Alex Edsall also deserve a great deal of thanks for their help formulating initial case studies and for serving as sounding boards for ideas as I narrowed the initial focus of my research.
I would also like to extend my thanks to all those at MIT that made my time here a productive and enjoyable experience. Thanks especially go to the SEAri research group, and its leaders Dr. Donna Rhodes and Dr. Adam Ross, for providing me an academic home at MIT. I am grateful for their feedback and research advice throughout my time here and I have benefited tremendously from the opportunity to build on their research. And to the former members of SEAri who provided the inspiration for this research and to the SEAri students I've had the pleasure of working with over the last several years, thank you. Lastly, I want to recognize all the help I've received from MIT administrators like Beth Marois and Fran Marone, without whom I've convinced much of the great research going here would simply not be possible.
Another individual that deserves special recognition is my good friend Dr. Nick Borer. When I first began to consider the idea of returning to school for my PhD, Nick offered his support if that was the path I chose and simultaneously encouraged me to believe that a PhD wasn't strictly necessary for me to successfully achieve my goals. However, once I had decided that it was the path for me, he helped connect me with research opportunities in the beginning and then served as one of my thesis reviewers in the end. And that is perhaps the best measure of a true friend, someone who will help you both get into and out of a trouble.
Lastly, this accomplishment would not have been possible without the inspiration, motivation and unwavering support of my wife, Stephanie. Few people are as well equipped to understand how challenging and tedious finishing a PhD can be. I love you and I'm looking forward to the days ahead that hopefully entail far fewer late nights, early mornings, and weekends in front of our laptops. Words will never by able to fully express the thanks I owe you for your patience and endless support.
Table of Contents
Abstract... 3
Acknow ledgem ents ... 5
Table of Contents ... 6 List of Figures... 9 List of Tables ... 12 List of A cronym s... 13 1.0 ... 15 1.0 Introduction ... 15 1.1 M otivation...15
1.2 Problem Statem ent and Research Questions ... 17
1.3 M ethodology ... 18
1.4 Thesis Outline... 20
2.0 ... 23
2.0 Literature Review ... 23
2.1 ERS / System Value Sustainm ent ... 23
2.2 Advanced Systems Engineering M ethods... 26
2.2.1 Multi-Attribute Tradespace Exploration and Epoch-Era Analysis...26
2.2.2 M etrics for Value Sustainment through Changeability ... 28
2.2.3 Graph Theory and Network Analysis Metrics and Analysis Methods ... 29
2.2.4 M ethods / Processes based upon Epoch-Era Analysis...3 1 2.3 Visual Analytics and Interactive Visualization ... 33
2.4 Existing Systems Engineering Applications ... 36
2.5 Sum mary and W orking Hypotheses ... 37
3.0 ... 39
3.0 Considerations for Visual A nalytic A pplications ... 39
3.1 Potential Benefits of Visual Analytics Systems ... 39
3.2 Components of Visual Analytics System s ... 41
3.2.1 Data Structures, M anagement and Transformation ... 41
3.2.2 Visualization and Data Representation...46
3.2.3 Interaction Techniques... 50
3.3 G uidance on Visual Analytic Tool Design ... 52
3.3.1 Visual Analytics Process and M antra ... 52
3.3.2 Information Design and Effective Visual Communication of Data...55
3.4 Integrated Application for Operationalizing IEEA ... 59
3.5 Integrated Application Prelim inary Case Study... 61
3.5.1 W eb Browser-based Application Demonstration ... 62
4.0 ... 67
4.0 Interactive Epoch Era Analysis (IEEA) Framework... 67
4.1 Introduction...67
4.2 Interactive Epoch Era Analysis (IEEA) Related Data ... 68
4.3 Framework for Interactive Epoch Era Analysis (IEEA) ... 70
4.3.1 Extension of Prior EEA-based M ethods ... 71
4.3.2 Description of IEEA Fram ework M odules ... 71
4.3.3 Description of IEEA Fram ework Processes ... 73
4.4 Implementation of a Visual Analytics Application for IEEA ... 75
4.4.1 Process 2: Value-Driven Design Form ulation ... 76
4.4.2 Process 6: Single Epoch Analyses ... 77
4.4.3 Process 7: M ulti-Epoch Analysis... 82
4.4.4 Process 8: Single-Era Analysis ... 92
4.4.5 Process 9: M ulti-Era Analysis ... 94
5.0 ... 99
5.0 Human Subjects Experiment on a Surrogate Design Problem... 99
5.1 Experim ent O verview and O bjectives ... 99
5.2 Subject Selection and Assignm ent... 100
5.3 Treatm ent G roups ... 101
5.3.1 Treatm ent A : N on-interactive Table ... 102
5.3.2 Treatm ent B: Non-interactive Table with Visualization...103
5.3.3 Treatm ent C: Interactive Table ... 104
5.3.4 Treatm ent D: Interactive Table + Visualization ... 105
5.4 Trial Protocol ... 106
5.4.1 Pre-test Questionnaires ... 107
5.4.2 Experim ental Task ... 110
5.4.3 Post-task ... 114
5.5 Analysis ...
116
5.5.1 Im pact on Task A ccuracy ... 117
5.5.2 Im pact on Task Com pletion Tim e ... 120
5.5.3 Im pact on Cognitive Load ... 124
5.6 Discussion... 128
6.0 ... 131
6.0 C ase Study 1 - Space T ug... 131
6.1 Elicitation...131
6.1.1 Process 1: Value-Driving Context Definition... 131
6.1.2 Process 2: Value-Driven Design Form ulation ... 13
1
6.2 G eneration / Sam pling ... 1346.2.1 Process 3: Epoch Characterization... 134
6.2.2 Process 4: Era Construction ... 135
6.3 Evaluation... 135
6.3.1 Process 5: Design-Epoch-Era Evaluation ... 135
6.4 Analysis...137
6.4.1 Process 6: Single Epoch Analyses ... 137
6.4.2 Process 7: M ulti-Epoch Analysis... 140
6.4.3 Process 8: Single-Era Analyses ...
15
1 6.4.4 Process 9: M ulti-Era Analysis ... 1536.5.1 Process 10: Decisions and Knowledge Capture... 156
7.0 ... 157
7.0 Case Study 2 - Commercial offshore ships ... 157
7.1 Case Background ... 157
7.2 Elicitation... 158
7.2.1 Process 1: Value-Driving Context Definition...158
7.2.2 Process 2: Value-Driven Design Form ulation ... 159
7.3 G eneration / Sam pling ... 159
7.3.1 Process 3: Epoch Characterization... 159
7.3.2 Process 4: Era Construction ... 161
7.4 Evaluation...162
7.4.1 Process 5: Design-Epoch-Era Evaluation ... 162
7.5 Analysis ... 164
7.5.1 Process 6: Single Epoch Analyses ... 164
7.5.2 Process 7: M ulti-Epoch Analysis... 167
7.5.3 Process 8 and 9: Era Analyses ... 176
7.6 Discussion and Conclusions ... 178
8.0 ... 181
8.0 D iscussion and C onclusions... 181
8.1 Sum m ary of Research Q uestions... 181
8.1.1 Research Question 1 ... 181
8.1.2 Research Question 2 ...
183
8.1.3 Research Question 3 ... 184
8.2 Research Contributions...185
8.2.1 Sum m ary of Prim ary Contributions...1 85 8.2.2 Additional Contributions / Observations ... 189
8.3 Lim itations and Applicability ... 189
8.3.1 EEA constructs and modeling considerations... 190
8.3.2 Interactive visualization developm ent and applicability... 191
8.3.3 Collaborative capabilities... 191
8.3.4 Perform ance of interactive applications... 192
8.4 Future W ork... 192
8.5 Final Thoughts ... 194
9.0 ... 197
9.0 A ppendices ... 197
9.1 Q uestions from spatial reasoning test ... 197
9.2 Q uestions from personality inventory test... 199
9.3 Q uestions from car design problem ... 200
9.4 Scalability m ethods for parallel coo rdinates ... 202
List of Figures
Figure 1-1: Six-phase Research Approach ... 19
Figure 2-1: Graphical representation of short run impacts of perturbations on value d eliv ery [13 ,2 0 ]... 2 5 Figure 2-2: Graphical representation of long run impacts of perturbation on value d e liv e ry ... 2 5 Figure 2-3: Notional tradespace of cost versus benefit (e.g. value, utility)... 27
Figure 2-4: Notional example of value over time for a serviceable system [28]... 28
Figure 2-5: Examples of the same graph using color to encode the different centrality metrics: A) Closeness centrality, B) Degree centrality, C) Katz centrality, D) Betweenness centrality, E) Eigenvector centrality and F) Harmonic centrality [42]. ... 3 0 Figure 2-6: Comparison between full accessibility matrix representation using (left) adjacency matrix and (right) force-directed graph ... 31
Figure 2-7: Overview of the Responsive Systems Comparison (RSC) method [45,46] .. 32
Figure 2-8: Overview of the Gather-Evaluate-Analyze structure of the RMACS method [2 9 ] ... 3 3 Figure 2-9: Visual analytics process by Keim et al. [55]... 35
Figure 3-1: The V isualization Pipeline [97,55] ... 42
Figure 3-2: The Information Visualization Reference Model [98,55]... 43
Figure 3-3: OLAP operations on data hypercube (Adapted from [100]) ... 45
Figure 3-4: Example interactive visualizations built with D3 [61] ... 47
Figure 3-5: Nasdaq performance data shown in multiple coordinated views [104]... 49
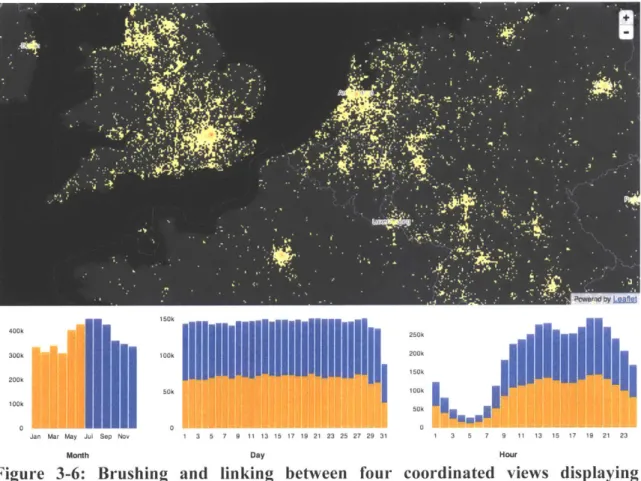
Figure 3-6: Brushing and linking between four coordinated views displaying different d im en sion s [106]... . . 5 1 Figure 3-7: User perception of interactive delay time [1 08] ... 51
Figure 3-8: Visual Analytics Process (adapted from Keim et al. [55]) ... 53
Figure 3-9: Details on demand from hovering mouse over a data point ... 54
Figure 3-10: Historical applications of information visualizations (a) Playfair's trade-balance time-series chart [114]; (b) Snow's spot maps of London cholera outbreak in 1850s [90]; (c) Minard's 1861 diagram depicting Napoleon's Russian campaign of 1812 [115]; (d) Nightingale's coxcomb diagram of army mortality rates [116]... 56
Figure 3-1 1: Tufte's Bar chart exam ple [90]... 57
Figure 3-12: Example of the use of small multiples [118] ... 58
Figure 3-13: W eb-based A rchitecture... 59
Figure 3-14: Model-View-Controller architecture [120]... 61
Figure 3-15: Web-based tool showing coordinated scatter plots and histograms ... 63
Figure 3-16: Brushing to filter designs across coordinated views... 63
Figure 3-17: Coordinated views showing histogram bin selection to slice data using O L A P ... 6 4 Figure 3-18: Coordinated scatter plot views with 2-D binned aggregation... 64
Figure 4-1: Combinations of Design-Epoch-Era evaluated through performance, value, context and strategy m odels... 68
Figure 4-3: Value-mapping interactive application ... 76
Figure 4-4: Interaction behavior for value mapping application ... 77
Figure 4-5: Example scatter plot of MAU vs Cost ... 78
Figure 4-6: Parallel coordinate chart ... 79
Figure 4-7: Multiple coordinated visualizations for single epoch analysis ... 80
Figure 4-8: Dense scatter plot represented using hexbins ... 81
Figure 4-9: Single and Multi-epoch analysis visualization ... 83
Figure 4-10: Epoch selection and point tracking in multi-epoch application... 84
Figure 4-11: Interactive heatm ap visualization ... 85
Figure 4-12: Interactive heatmap visualization with additional data encoded using size (A dapted from [ 135])... 86
Figure 4-13: Interactive Force-directed graph ... 87
Figure 4-14: Multi-epoch analysis visualization using OLAP ... 89
Figure 4-15: Nightingale coxcomb ("rose") visualization... 91
Figure 4-16: Multi-epoch analysis OLAP visualization with Nightingale coxcomb d ia g ra m ... 9 2 Figure 4-17: Single-era analysis visualization using OLAP showing (a) candidate designs before filter; (b) after filtering ... 93
Figure 4-18: Single Era Analysis visualization using OLAP ... 94
Figure 4-19: Visualization showing eras visualized using parallel sets[29]... 95
Figure 4-20: Exam ple chord diagram ... 96
Figure 4-21: Interactive Chord D iagram ... 97
Figure 4-22: Chord diagram details on demand ... 98
Figure 5-1: Experim ental Treatm ent Groups... 102
Figure 5-2: Treatment A - Non-interactive table ... 103
Figure 5-3: Treatment B - Non-interactive table with visualization... 104
Figure 5-4: Treatm ent C - Interactive table... 105
F igure 5-5 : T reatm ent D ... 106
Figure 5-6: Experim ental session protocol ... 107
Figure 5-7: Example paper folding question with solution ... 108
Figure 5-8: Sample of the paper folding questions... 109
Figure 5-9: Personality factors inventory ... 110
Figure 5-10: Screenshot of Web Interface for NASA Task Load Index Assessment .... 115
Figure 5-11: Screenshot of Feedback Form ... 116
Figure 5-12: Overview of overall task accuracy by treatment group ... 118
Figure 5-13: Overview of experiment completion time by treatment group... 120
Figure 5-14: Com pletion tim e for filter tasks ... 122
Figure 5-15: Com pletion tim e for sorting tasks... 122
Figure 5-16: Completion time for trend observation tasks ... 123
Figure 5-17: Composite Cognitive Load by Treatment Group... 125
Figure 5-18: Spatial reasoning score versus cognitive load ... 127
Figure 5-19: Spatial reasoning score versus cognitive load for treatment groups with in teractio n ... 12 8 Figure 6-1: Single attribute utility (SAU) curves for the 8 different missions ... 133 Figure 6-2: Interactive Visualization of SAU function and weightings showing (top) Initial tradespace and preferences over performance attributes corresponding to
Epoch 1; (bottom) Modified SAU function and weightings corresponding to Epoch 7 ... 1 3 4
Figure 6-3: Combinations of Design-Epoch-Era evaluated through performance, value,
context and strategy m odels... 136
Figure 6-4: Multiple coordinated visualizations for space tug single epoch analysis .... 1 38 Figure 6-5: Filtered subset of alternatives in the baseline epoch (epoch 1) ... 140
Figure 6-6: Design points tracked across epoch shifts (top) Epoch 1; (middle) Epoch 2; (b ottom ) E p och 5 ... 142
Figure 6-7: Interactive heatm ap visualization ... 144
Figure 6-8: Interactive Filtering Application implementing OLAP ... 145
Figure 6-9: (a) Interactive force-directed graphs of change mechanisms between designs; (b) Betweeness centrality metric assigned to node radius ... 148
Figure 6-10: Multi-epoch analysis OLAP visualization with Nightingale coxcomb d iag ram ... 14 9 Figure 6-1 1: Nightingale coxcomb ("rose") visualization... 150
Figure 6-12: Filtered subset of passively robust designs ... 151
Figure 6-13: Interactive application showing candidate designs across a single era (a) before filtering; and (b) after ... 152
Figure 6-14: Interactive chord diagram used to visualize design change behavior... 155
Figure 7-1: System boundaries and epoch variables [164]... 160
Figure 7-2: Descriptions of 3 narrative eras [164,168]... 162
Figure 7-3: Interactive Filtering Application for tradespace exploration for the offshore sh ip design b ase case ... 164
Figure 7-4: Interactive Filtering Application with (fine) hexagonal binning ... 166
Figure 7-5: Interactive Filtering Application with (course) hexagonal binning... 166
Figure 7-6: Interactive heatmap visualization (top), inspection table (bottom) for the ships in th e selected tile ... 16 9 Figure 7-7: Interactive Filtering Application implementing OLAP for the offshore case (Filtered for allowable change cost < $1 OOM and change time < 90 days)... 171
Figure 7-8: Nightingale coxcomb visualization for ship multi-epoch analysis comparing performance at an FPN threshold of 10% (dark blue) and 20% (light blue)... 172
Figure 7-9: Nightingale coxcomb visualization for ship multi-epoch analysis comparing performance at an FPN threshold of 10% without changeability (dark blue) and with changeability using the maximize efficiency strategy (light blue)... 174
Figure 7-10: Comparing epoch 25 for a changeable maximize efficiency strategy (left) and a passive robustness approach (right) ... 175
Figure 7-11: Comparing epoch 81 for a changeable maximize efficiency strategy (left) and a passive robustness approach (right) ... 175
Figure 7-12: Interactive era analysis application implementing OLAP ... 177
Figure 8-1: Interactive Epoch-Era Analysis process and modules... 186
Figure 8-2: Sampling on interactive visualizations developed for this thesis research.. 187
Figure 8-3: Summary of experiment results by treatment group... 188
Figure 9-1: Spatial reasoning test part I ... 197
Figure 9-2: Spatial reasoning test part 2 ... 198
Figure 9-3: Parallel coordinates plot coupled with axis histograms [172] ... 202
List of Tables
Table 3-I: How information visualization amplifies cognition (from Card et al. [86]
T a b le 1 .3 ) ... 4 0
Table 3-2: Example visualizations for binned data (from Lui et al. [65])... 44
Table 5-1: O verall im pact of treatm ent group ... 117
Table 5-2: Impact of treatment group on task accuracy ... 119
Table 5-3: Correlation between overall accuracy and spatial reasoning ability ... 120
Table 5-4: Impact of treatment group on task completion time (minutes)... 121
Table 5-5: Task completion time and individual differences ... 124
Table 5-6: Impact of treatment group on composite cognitive load... 125
Table 5-7: Sub-com ponents of cognitive load... 126
Table 6-1: Summary of preference weightings for each mission ... 132
Table 6-2: Sum m ary of Epoch V ariables ... 135
T able 6-3: D esign variable levels ... 137
Table 6-4: Performance attribute levels across all evaluated designs ... 137
Table 6-5: 3 designs are within 0.0% (FPN) of Pareto optimal in 87.5% (FNPT) of enum erated ep ochs... 1 46 Table 6-6: 3 designs are within 1.0% (FPN) of Pareto optimal in 100% (FNPT) of en um erated ep ochs... 14 6 Table 6-7: 5 are within 1.0% (FPN) of Pareto optimal in 87.5% (FNPT) of enumerated e p o c h s ... 14 6 Table 6-8: Passively robust designs identified by Fitzgerald [30]... 146
Table 6-9: A vailable C hange O ptions ... 147
T able 7-1: E poch variables [164]... 160
Table 7-2: Missions associated with technical requirements [168]... 160
Table 7-3: Operational area requirements [164,168]... 161
Table 7-4: D esign variable levels [164,168]... 163
Table 7-5: Performance attribute levels across all evaluated designs ... 163
Table 7-6: Expense attribute levels across all evaluated design... 163
List of Acronyms
AJAX Asynchronous JavaScript and XML ARI Available rank improvement
BI Business intelligence COI Community of Interest
CSS Cascading Style Sheets
CSV Comma-separated variables
D3 Data-driven documents
DoD Department of Defense
DOM Document object model
EEA Epoch Era Analysis
efNPT Effective Fuzzy Normalized Pareto Trace eFPN Effective Fuzzy Pareto Number
ERS Engineered Resilient Systems
FACT Framework for Assessing Cost and Technology FAFO Fully accessible filtered outdegree
fNPT Fuzzy Normalized Pareto Trace FOD Filtered outdegree
FPN Fuzzy Pareto Number
FPS Fuzzy Pareto Shift
HCI Human Computer Interiaction
HTML HyperText Markup Language
IEEA Interactive Epoch Era Analysis IMR Inspection maintenance and repair JSON Javascript object notation
MATE Multi-Attribute Tradespace Exploration MAE Multi-Attribute Expense
MAU Multi-Attribute Utility
MAUT Multi-Attribute Utility Theory
MCSC Marine Corps Systems Command MDO Multidisciplinary optimization
MIT Massachusetts Institute of Technology MOI Metric of interest
NASA National Aeronautics and Space Administration NPT Normalized Pareto Trace
NPV Net-Present Value
OCV Offshore construction vessels OLAP Online Analytical Processing OSD Office of the Secretary of Defense PSV Platform supply vessels
SAU Single Attribute Utility S&T Science and technology
SEAri Systems Engineering Advancement Research Initiative TSE Tradespace exploration
UX User Experience
VASC Valuation Approach for Strategic Changeability VWFO Value-weighted filtered outdegree
1.0
Introduction
1.1 Motivation
In April 2011, the Office of the Secretary of Defense (OSD) identified the development of engineered resilient systems (ERS) as a science and technology (S&T) strategic investment priority. Their use of the term "resilient" causes some semantic confusion, but a close examination of the problems they describe reveals an interest in improving how early conceptual trade studies (pre-Phase A) and system lifecycle analysis are performed when there is uncertainty in future stakeholder needs, operating environment or changes in the system over time. The surge in interest within the DoD has been driven by a recognition that as systems grow in scale and complexity, and consequently cost, traditional methods of addressing these uncertainties will no longer suffice. Recent publications out of the ERS community of interest (COI) have provided prospective on the DoD's needs as well as attempted to identify gaps in current system design and acquisition approaches [1,2,3]. Several researchers and practitioners have also begun to investigate how to define this problem and develop new methods, techniques and tools to assist designers in early-phase system concept selection activities. The ultimate goal of this strategic initiative can be more broadly characterized as the need to achieve sustained value delivery from systems in spite of changes in design, context or needs.
The objectives of the ERS program and many of the issues due to uncertainty about the future they describe are not unique to the DoD. Similar issues often arise in the design of space systems, commercial products and in infrastructure development. Many systems engineering practioners view design processes, like the systems engineering "V" or the phased design process described by the NASA Systems Engineering Handbook
[4], as a blueprint to be followed that will result in systems capable of satisfying the needs of stakeholders throughout the lifecycle of that system. This type of approach can be problematic, however, especially when there is uncertainty about the future or when the nature of what system stakeholders perceive as valuable over time is not well articulated or understood. In such situations the design process might best be viewed as exploratory where processes lead to unexpected results that require a decision-maker or analyst to iterate back through previous processes to comprehend a problem and reach a conclusion. The iterative nature of the design process, often characterized by successful knowledge discovery only after it is preceded by trial and error and intermediate failure, has been referred to as "design as a search problem" [5].
Epoch Era Analysis (EEA) and related approaches have been developed to better model problems with lifecycle uncertainties and have demonstrated their usefulness in prior research studies, but they still face significant challenges to practical application for informing decision-making in problems like those now posed by the DoD. Specifically, EEA can result in large, multivariate datasets that are difficult to generate, visualize and perform analysis on. The analysis of the model-generated data sets associated with EEA
studies can be challenging not only because of the size of the data set in terms of number of records and dimensions, but also due to issues related to the interpretation of results. Models of system performance or stakeholder value may contain embedded assumptions or errors that lead to confusing or misleading output data. Even when there are no concerns with the underlying models that generate the data there can still be ambiguity about what constitutes desirable characteristics and behaviors of the system designs that are being modeled. When performing exploratory analysis on such model-generated data sets, human interaction is often necessary to identify important subsets of the data, resolve ambiguity and recognize patterns or inconsistencies. However, although prior research towards methods for applying EEA constructs has been perfonned, a prescriptive framework that explicitly considers human interaction does not exist. To make informed decisions and design successful strategies for value sustainment, effective visualization and analysis techniques that consider human interaction are needed to derive valuable insights from this data
Design tools for assisting analysts and decision-makers discover insights while engaged in these types of system design problems under uncertainty should also reflect the exploratory nature of the problem. Think of them as part of a collaborative process between a human and a computer, where each has its own distinct advantages [6,7]. Exponential improvements in processing power and data visualization capabilities in recent years encourage us to reexamine our approaches to balancing computer automation with human intuition in systems engineering decision-making. Ongoing research and applications from visual analytics are often focused on similar types of problems. Visual analytics tools have been developed and have shown promise in application areas such as healthcare, finance and combating global terrorism [8,9,10]. These areas have some similarities with system design problems in that they must consider a wide range of possible outcomes, deal with large amounts of data, and the nature of "success" isn't always clearly defined or agreed upon.
This thesis examines how incorporation of research from the field visual analytics can facilitate the development of a generalizable, prescriptive framework that can be leveraged to develop interactive design tools and overcome the challenges described. As described by Thomas and Cook, visual analytics is "the science of analytical reasoning facilitated by interactive visual interfaces." [11]. It can attack certain problems whose size, complexity, and need for closely coupled human and machine analysis may make them otherwise intractable [12]. It is argued in this thesis that system design problems with uncertainty often fit this description. While much of this thesis is dedicated to the discussion of principles from the field of visual analytics and issues related to interactive visualization, it is primarily focused on making a contribution in the area of research dealing with the design of complex engineering systems under uncertainty. Where practical, this thesis also considers how these integrated visualization and analysis environments can best be merged with existing systems engineering practices.
1.2 Problem Statement and Research Questions
Prior research has provided some background on ways EEA can be applied to model the impacts of various perturbations' on system value. However, to fully address the challenges described in the previous section a more comprehensive framework for the analysis of system value sustainment that explicitly considers human interaction is necessary. This leads to the aim of the research presented here. This thesis should contribute to the engineering literature a new prescriptive framework that augments traditional EEA approaches with detailed processes, descriptive quantitative metrics, analytic methods, and interactive visualization techniques. It is hypothesized that this framework will fundamentally enable new capabilities and insights to be derived from EEA, resulting in superior dynamic strategies for sustaining system value.
As discussed previously, the top-level question that this thesis examines is, "How can we better enable decision makers to design complex systems that deliver sustained value to stakeholders in a wide range of operations and multiple alternative futures?" Based on this question, the primary hypothesis of this thesis is that incorporating research from the field of visual analytics to extend EEA can help us better address the challenges to practical application for the types of problems described by the engineered resilient systems (ERS) community of interest (COI). That primary hypothesis can be separated into three lower-level objectives that are motivated by the problem statement and EEA related challenges described in the preceding section. These objectives tie directly to the
following three research questions:
1. (RQI) How can the value sustainment of complex systems be enabled through an early-phase design framework that incorporates EEA and explicitly considers human interaction?
2. (RQ2) How can existing techniques from the field of visual analytics be incorporated into EEA to enable analysis and comprehension of driving factors of sustainable system value in dynamic operating environments? 3. (RQ3) Does interactive visualization improve design problem
decision-making and, if so, what are the relative contributions of representation, interaction or other factors to user performance?
The research methodology for answering these research questions is detailed in the next section of this chapter. Several contributions are anticipated as outcomes from the research effort associated with addressing these three research questions. First, this thesis contributes the results of a controlled human-subjects experiment that decouples the relative contributions to human performance of interaction, visualization and individual differences in subjects when they analyze design problems using interactive visualization tools. Next, the Interactive Epoch-Era Analysis (IEEA) framework, comprised of 10 processes grouped in 6 modules, is introduced as a means for analyzing lifecycle uncertainty when designing systems to achieve sustained value delivery. Finally, to enable new capabilities and improve the analysis of value sustainment as a
Beesemyer categorized perturbations as being either disturbances or shifts [15]. Disturbances have a short-duration impact and shifts have a long-duration or permanent impact on design, context, or needs.
dynamic, continuous, and path-dependent property of candidate systems, new interactive visualizations for both epoch and era analyses are introduced. It is hypothesized that the extension of interactive visualization to system design problems with lifecycle uncertainty will result in improved comprehension of the nature of underlying trades and improve a designer's ability to communicate their decision-making rationale.
1.3 Methodology
While the primary objective of this research is to determine how to better inform decision-making in the design process, ultimately resulting in systems with sustained value delivery, this thesis aims to make contributions to topics supporting the broader research agenda. Specifically, this thesis seeks to develop a prescriptive design framework with new metrics, algorithmic methods and interactive applications to facilitate improved analysis and comprehension by decision-makers. To that end, the six-phase research methodology shown in Figure 1-1, inspired by prior research studies by Richards [13] and Corbin [14], will be applied. The methodology includes the following phases:
1. Knowledge capture and synthesis
2. Framework, method and metric development 3. Prototype interactive visualization development 4. Review by subject matter experts
5. Controlled human subjects experiment 6. Case study applications.
Each phase should not be regarded as a discrete activity in a serial process but rather one aspect of an iterative, concurrent process of continuous learning, revisiting of assumptions, and development and testing of hypotheses. Combined, these six phases serve as a concrete validation plan for the working hypotheses of this thesis and provide a means of answering the three primary research question described in this chapter.
Literature Review, Exploratory case studies, Exploratory interviews
weakness Knowledge capture Theories,
of prior EEA and Synthesis methods and
frameworks, frameworks
analysis from prior
methods and visual analytics
metrics research
24
3
Framework, Methods & Interactive Visualization
Metrics Development Development
Revise Revise
Framework Prototypes
Case Study Controlledl)
Applications Experiment
- Demonstrate application of Evaluate impact of
prescriptive framework for applying interaction and
EEA constructs (RQ #1) visualization on human
- Demonstrate prototype interactive performance in simplified
visualization tools for IEEA (RQ #2) case study (RQ #3)
Figure 1-1: Six-phase Research Approach
The first phase in the proposed research approach is to conduct a thorough literature review to capture knowledge in a variety of fields, including prior research in advanced system engineering methods such as EEA and recent research in the areas of visual analytics and interactive data visualization that may be applicable to the current research. Exploratory interviews are also conducted with subject matter experts (SME),
senior systems engineers and key stakeholders in various candidate application case studies. The goal of this phase is to identify strengths and weaknesses of existing design frameworks, methods, metrics and analysis tools in the context of the types of challenges motivating this research. This phase should also identify theories, models, frameworks and enabling techniques from the field of visual analytics that can be incorporated to overcome challenges or enable new capabilities.
During the second phase of this research, which focuses on framework, method and metric development, gaps in the existing approaches are examined, and modifications and additions are made to fill these gaps. The intended output of this phase is a new prescriptive framework for applying EEA constructs to generate, evaluate and decide among design alternatives given future uncertainty. Exploratory case study examples, some from research reviewed in the previous phase, are used to test the proposed framework, algorithms and metrics for internal validity before implementing them in
prototype interactive applications. Informal expert reviews of the framework will also be
The third phase, which occurs concurrently with the second phase, will incorporate enabling research from the field of visual analytics, identified in the first phase, to implement and test the proposed IEEA framework. Elements from the key steps in the visual analytics process (visual mapping, model-based analysis, and user interactions) are mapped to prototype applications that implement the process phases of the IEEA framework. Prototype interactive visualizations will also be assessed using qualitative measures of effectiveness in the fourth phase of this research.
The fourth phase, which occurs concurrently with the second and third phase, incorporates the opinions of subject matter experts (SME's) on both the proposed IEEA framework and the prototype interactive visualizations that implement it through informal interviews and expert review. Qualitative measures of effectiveness will be assessed using the same exploratory case studies used in the second phase. Feedback from SME's on comprehension and usability of the framework and interactive visualizations will be used to iterate and revise both the framework and prototypes.
The fifth phase, which occurs concurrently with the third phase, implements a controlled human subjects experiment. The experiment aims to decouple and evaluate the impact of interaction and visualization on human performance by measuring performance differences between four treatment groups corresponding to different analysis tools. These analysis tools are each implemented using similar interaction and visualization types as those used to implement the IEEA framework prototypes. The experiment measures interpretation errors, number of achieved benchmark goals and task completion time of subjects analyzing a simplified multi-epoch car design problem, which in turn assesses quantitative measures of visualization effectiveness.
The sixth and final phase in this research focuses on demonstrating the prescriptive value of the new IEEA framework and corresponding metrics, algorithmic methods and visualizations. External validity of IEEA is assessed through case studies using parametric modeling and simulation to assess candidate system architectures in separate case studies: (1) A multi-mission on-orbit service vehicle; and (2) A commercial ship design application. The first case study provides a detailed assessment of each of the IEEA process steps and the second case study demonstrates the scalability of the framework and prototype applications to a larger data set.
1.4 Thesis Outline
The remainder of this thesis is structured as follows:
* In Chapter 2 an overview of past literature relevant to this research effort will be discussed. Specifically, prior work in the areas of visual analytics and advanced systems engineering methods will be discussed in detail.
* Chapter 3 discusses the considerations associated with development and application of visual analytics tools. The new capabilities they provide and how
these can be leveraged to improve to the discovery of insights in system design problems are also presented.
* Chapter 4 will provide a detailed discussion of IEEA, the proposed prescriptive framework for evaluating design alternatives given future uncertainty. Interactive visualization applications that implement the relevant process steps will be presented.
* Chapter 5 describes the controlled human subjects experiment developed to decouple the relative contributions to human performance of interaction and visualization when subjects analyze a simplified design problem using interactive visualization tools. Overview of the experimental protocol, treatment groups and results will be discussed.
* Chapters 6 and 7 provide case studies to demonstrate how descriptive information is produced, analyzed, and visualized to compare design, change option and strategy combinations. The first case study walks through the new IEEA framework in detail using a case study for the design of an on-orbit servicing vehicle (space tug). The second case study, which focuses on the design of commercial ships, demonstrates scalability of visualization and analysis techniques on a larger scale problem and extensibility to a different problem domain.
* Finally, Chapter 8 will provide discussion and some concluding remarks about the contributions of this research to the broader field of systems engineering. Candidate topics for future research are also discussed.
2.0 Literature Review
The ultimate goal of this research is to provide designers with a comprehensive approach for evaluating system value sustainment to inform improved decision making in the early conceptual phase of the system lifecycle. Specifically, this research explores the coupling of techniques from visual analytics to demonstrate how an integrated visualization and analysis environment for making sense of high-dimensional EEA data can lead to new capabilities and improved insights. This is a multi-faceted research topic and as such draws on several areas of previous research. The four main areas of literature reviewed are:
* DoD S&T efforts under the ERS initiative and related prior research that define the meaning of value sustainment as used in the current research.
e Advanced systems engineering methods research including epoch-era analysis. e Visual analytics and related research on interactive visual interfaces.
State of the practice systems engineering applications, workflows, processes and tools.
Although there is some overlap between these areas, they are largely distinct from one another both in their aims and in the researchers and practitioners involved in their study. Each will be described in further detail in the following subsections.
2.1 ERS / System Value Sustainment
The challenges described by the ERS community of interest (COI) within the DoD served as the initial motivation for this research [1,2,3]. As previously noted, however, their use of the term "resilient" causes some semantic confusion since the desired system behavior they describe is similar to the concepts described in prior literature as survivability, changeability, value robustness or value sustainment. It is therefore important to review the various definitions used by the ERS COI and other authors to clarify the goals of this thesis.
A significant prior body of work exists that describes what it means for a system to be resilient, survivable, value robust or other notions related to the concept of value sustainment over time, but the precise definition is not universally agreed upon. Among the first sources to use the phrase "resilience engineering" [15] described the failure of a system as being a result of its breakdown or malfunction due to its inability to adapt or cope with the complexities of the real world. The authors provide topologies of the meaning of resilience, but their focus is primarily system safety and risk management that is somewhat different than the focus of the current research effort described here. Later work by Richards [13,16], Jackson [17], Jackson and Madni [18], and Madni [19] focus on frameworks for architecting systems to avoid, survive and recover from disruptions. Each of these authors describes concepts similar to what is referred to in the current work as value sustainment. Jackson and Madni each describe a resilient system as one that has
"the ability to circumvent, survive, and recover from failures to ultimately achieve mission priorities even in the presence of environmental uncertainty" [19]. Richards described principles for system architecting for survivability, but his definition for survivability is similar to Jackson and Madni's definition of resilience. Adding to the semantic confusion, follow-on work by Beesemyer [20] that leveraged the work of Richards referred to a similar concept as value sustainment. The definition used by Richards for survivable systems is "the ability of a system to minimize the impact of a finite duration disturbance on value delivery, achieved through either (1) the reduction of the likelihood or magnitude of a disturbance; (2) the satisfaction of a minimally
acceptable level of value delivery during and after a finite disturbance or; (3) timely recovery from a disturbance event" [16]. Richards also proposed a means for quantifying
changes in system value due to disruption using two temporally based metrics: time-weighted average utility loss and threshold availability. What is common to most of the definitions suggested is an acknowledgement that complex systems must be designed to continue to deliver sustained value to their stakeholders even if uncertainty exists about the way a system will be required to operate in the future.
This thesis adopts the definition of the generalized concept of value sustainment, as given by Beesemyer, to be "the ability to maintain value delivery in spite of epoch shifts or disturbances." Figure 2-1 and Figure 2-2 below summarize this concept and reflect how notions of value sustainment will be considered in this research effort. In these figures, the nominal value delivered by a system is (potentially) impacted by a perturbation (characterized as either a disturbance or a shift). A disturbance is a short duration event, likely to revert imposed change on the design, context, or needs for a system, while a shift is a long duration event, unlikely to revert imposed change on the design, context, or needs for a system. A system that exhibits the desired behavior is one that is either not impacted, or maintains value above the indicated threshold, and restores that value delivery to a higher acceptable level after a threshold period of time.
Disturbance or Shift
47
-TD -TRtime (t)
av - - -. . . 6 .. -. .n. .V(t)
=value overtime
Vo = original value prior to Type 1: the reduction of the likelihood or magnitude of disturbance/shift
a disturbance VE =minimal acceptable value
Type 2: the satisfaction of a minimally acceptable level Vx = required value threshold of value delivery during and after a disturbance TD = Disturbance duration Type 3: maximization of the recovery of value-delivery TR = permitted recovery time
within a permitted recovery time
Figure 2-1: Graphical representation of short run impacts of perturbations on value delivery[13,201.
"Long" duration perturbation (unlikely to revert)
Attributes (performance, expectations)
I T Expectation 2 Context 2 0 0
Two aspects to an Epoch:
1. Needs (expectations)
2. Context (constraints including resources, technology, etc.)
Time Needs
..
(epochs) +
__0 Context:
[]NONEE...
Figure
2-2:
Graphical representation of long run impacts of perturbation on value
delivery
25
Value
V(t)
V0
Vx
VEAt
0 Expectation I Context 2.
In addition to efforts to define the desired system behavior over time, much of the early work of the ERS community has focused on identifying gaps in existing applications and techniques for tradespace exploration [21]. A significant gap in most existing tradespace exploration applications is that they only evaluate system alternatives for a static set of stakeholder needs, operating context (e.g. mission) and system state at
initial deployment. This effectively ignores system properties that only manifest
themselves with changes over time, the so called "ilities" (e.g. reliability, adaptability, etc.). This status quo is not surprising since setting static performance requirements that define the system design are central to the system acquisition processes used by both the
DoD and NASA. Additional details on research related to systems engineering
applications will be provided in Section 2.4.
2.2 Advanced Systems Engineering Methods
The second area of background research explored as part of the current effort is prior advanced methods that can be applied in early-phase conceptual design of systems. Though exploration of the space of possible designs is not a new concept, some recently developed methods have potential to fill the previously discussed gaps in applications and methods needed by the DoD.
2.2.1 Multi-Attribute Tradespace Exploration and Epoch-Era Analysis
Conceptual design methods for identifying system trades and optimizing the system under design for certain performance attributes have been a focus of research for some time [22,23]. More recently researchers have coupled design space exploration with multi-attribute utility theory (MAUT) [24] where system utility, which is computed as a function of system performance attributes, is used as a surrogate for value. This is useful for non-commercial systems where it is difficult to monetize value delivery through metrics such as net present value (NPV). Research in this area has given rise to
methods like multi-attribute tradespace exploration (MATE) [25,26]. MATE is a
conceptual design method that compares large numbers of candidate system designs using experimental designs to enumerate vectors of design variables that are evaluated by
system performance models. The performance attributes for each design are then
evaluated using a valuation metric, typically a multi-attribute utility (MAU) function, and plotted against their respective costs in a cost versus utility (as benefit) scatter plot to
visualize the tradespace as shown in Figure 2-3. Often the goal of this activity is to
identify the frontier of Pareto optimal solutions. Comparing alternatives in this way helps mitigate potential biases or premature fixation on a single-point design. While MATE is a useful approach it still does not directly address future uncertainties of the nature that are the focus of the current research.
Pareto frontier
Pareto-optimal
(nondominated)
,
-alternatives
.4,I
/ / /I
/ I IDominated
alternatives
Cost
Figure 2-3: Notional tradespace of cost versus benefit (e.g. value, utility)
To extend the capabilities of MATE, Ross [27] described a new method called Epoch-Era Analysis (EEA) that is useful for framing problems with uncertainties in stakeholder needs and context. EEA is designed to clarify the effects of changing contexts over time on the perceived value of a system in a structured way [27,28]. The base unit of time in EEA is the epoch, which is defined as a time period of fixed needs and context in which the system exists. Epochs are represented using a set of epoch variables, which can take on continuous or discrete values. These variables can be used to represent any exogenous uncertainty that might have an effect on the usage and perceived value of the system. Weather conditions, political scenarios, financial situations and the availability of other technologies are all potential epoch variables. Appropriate epoch variables for an analysis include key (i.e., impactful) exogenous uncertainty factors that will affect the perceived success of the system. A large set of epochs, differentiated using different enumerated levels of these variables, can then be assembled into eras, ordered sequences of duration-labeled epochs creating a description of a potential progression of contexts and needs over time as shown in Figure 2-4. This
27
A
w0
CD
CD
approach provides an intuitive basis upon which to perform analysis of value delivery
over time for systems under the effects of changing circumstances and operating
conditions, an important step to take when evaluating large-scale engineering systems
with long lifecycles.
New Context: new
Value value function
degradation (objective fcn) Major failure
Majo faiure Service to
Maorfalue upgrad " k
System BOL
T-
T- Tn - System EOLU
Epo 1 1oEpoch 21S l
~
e 2b Value outage:Servicing time /
Service to Same system, Service to
"restore" but perceived "restore" value decrease
Figure 2-4: Notional example of value over time for a serviceable system [281
Encapsulating potential short run uncertainty (i.e., what epoch will my system experience next?) and long run uncertainty (i.e. what potential sequences of epochs, or eras, will my system experience in the future?) allows analysts and decision makers to develop dynamic strategies that can enable system value sustainment. Key challenges in application of EEA up to this point involve eliciting a potentially large number of relevant epochs and eras, conducting analysis across these epochs and eras, and extracting useful and actionable information from the analyses. Schaffner [29] showed that the number of potential eras to consider could grow very quickly, becoming
computationally infeasible. As an example, an epoch space represented by 5 epoch
variables, each with 3 levels, would result in 35 = 243 possible epochs. If the length of
our eras is 10 epochs and each epoch can transition between any other epoch then the size of the potential era space would be 2430 ~ 1024 eras. This means that for many problem formulations it is not feasible to evaluate systems across all or even a large fraction of potential eras.
2.2.2 Metrics for Value Sustainment through Changeability
Several research efforts since Ross' original work have developed EEA further to
consider changeability options and path dependencies between epochs. The valuation
approach for strategic changeability (VASC) was proposed by Fitzgerald to generate quantitative descriptive information regarding the value of included system change options, without resorting to many of the assumptions implicit in real options analysis and other financial options method [30,31,32]. VASC introduces several metrics that can be used to characterize the behavior of systems with change options during multi-epoch


![Figure 2-8: Overview of the Gather-Evaluate-Analyze structure of the RMACS method [29]](https://thumb-eu.123doks.com/thumbv2/123doknet/14682183.559500/33.917.145.765.121.560/figure-overview-gather-evaluate-analyze-structure-rmacs-method.webp)