Publisher’s version / Version de l'éditeur:
Journal of Testing and Evaluation, 26, 2, pp. 83-88, 1998-03-01
READ THESE TERMS AND CONDITIONS CAREFULLY BEFORE USING THIS WEBSITE. https://nrc-publications.canada.ca/eng/copyright
Vous avez des questions? Nous pouvons vous aider. Pour communiquer directement avec un auteur, consultez la première page de la revue dans laquelle son article a été publié afin de trouver ses coordonnées. Si vous n’arrivez pas à les repérer, communiquez avec nous à PublicationsArchive-ArchivesPublications@nrc-cnrc.gc.ca.
Questions? Contact the NRC Publications Archive team at
PublicationsArchive-ArchivesPublications@nrc-cnrc.gc.ca. If you wish to email the authors directly, please see the first page of the publication for their contact information.
NRC Publications Archive
Archives des publications du CNRC
This publication could be one of several versions: author’s original, accepted manuscript or the publisher’s version. / La version de cette publication peut être l’une des suivantes : la version prépublication de l’auteur, la version acceptée du manuscrit ou la version de l’éditeur.
Access and use of this website and the material on it are subject to the Terms and Conditions set forth at
Interlaboratory comparison of the ASTM standard test methods for
water vapor transmission of materials (E96-95)
Kumaran, M. K.
https://publications-cnrc.canada.ca/fra/droits
L’accès à ce site Web et l’utilisation de son contenu sont assujettis aux conditions présentées dans le site LISEZ CES CONDITIONS ATTENTIVEMENT AVANT D’UTILISER CE SITE WEB.
NRC Publications Record / Notice d'Archives des publications de CNRC:
https://nrc-publications.canada.ca/eng/view/object/?id=62fdca9d-037b-4cec-954a-381a6b3e2c6c
https://publications-cnrc.canada.ca/fra/voir/objet/?id=62fdca9d-037b-4cec-954a-381a6b3e2c6c
http://www.nrc-cnrc.gc.ca/irc
I nt e rla bora t ory c om pa rison of t he AST M st a nda rd t e st m e t hods for
w a t e r va por t ra nsm ission of m a t e ria ls (E9 6 -9 5 )
N R C C - 4 0 6 4 4
K u m a r a n , M . K .
M a r c h 1 9 8 8
A version of this document is published in / Une version de ce document se trouve dans:
Journal of Testing and Evaluation,
26, (2), pp. 83-88, March 01, 1998
The material in this document is covered by the provisions of the Copyright Act, by Canadian laws, policies, regulations and international agreements. Such provisions serve to identify the information source and, in specific instances, to prohibit reproduction of materials without written permission. For more information visit http://laws.justice.gc.ca/en/showtdm/cs/C-42
Les renseignements dans ce document sont protégés par la Loi sur le droit d'auteur, par les lois, les politiques et les règlements du Canada et des accords internationaux. Ces dispositions permettent d'identifier la source de l'information et, dans certains cas, d'interdire la copie de documents sans permission écrite. Pour obtenir de plus amples renseignements : http://lois.justice.gc.ca/fr/showtdm/cs/C-42
,1
"1
,
Mavinkal
K.
Kumaran
tInterlaboratory Comparison of the ASTM Standard Test Methods
for Water Vapor Transmission of Materials (E 96-95)
REFERENCE: Kumaran, M. K., "Interlaboratory Comparison of the ASTM Standard Test Methods for Water Vapor Transmission
of Materials (E 96w95)" Journal of Testing and Evaluation,JTEVA, Vol. 26. No.2. March1998.pp.83-88.
ABSTRACT: An interlaboratory comparison was initiated by the
ASTM CI6 Committee on Thermal Insulation to determine theーイ・」ゥセ
sian of the test method prescribedby ASTM Standard Test Methods
for Water Vapor Transmission of Materials (E 96-95). Expanded poly-styrene board was chosen as the test material. Nine laboratories
com-pleted the measurements according to the drycup and the wet cup
procedures prescribedbythe standard. Statistical analyses of the data resulted in the following precision statement for the water vapor perme-ability:
Dry cup method:
Permeability of material =: 3.lE-12 kgm-t S-lPa-1
Repeatability standard deviation (within a laboratory) == 1.6E-13
kgm-1 $-1Pa-1
Reproducibility standard deviation (between laboratories) 4.7E-13 kgm-I 5- 1Pa-I
Wet cup method:
Permeability of material = 3.4E-12 kg m-1 S-I Pa-I
Repeatability standard deviation (within a laboratory) = 1.7E-13 kgm-1S-l Pa-I
Reproducibility standard deviation (between laboratories)
=
4.IE-13kgm-I S-l Pa-1
Aspecific procedure was uniformly used to analyze the data and 10calculate the permeability of the test material from the raw data provided by the participating laboratories. Corrections were made for the resistances offered by the still air layer inside the cup and by the specimen surfaces and for the edge masking details.
KEYWORDS: water vapor transmission, permeability, permeance, relative humidity, desiccant method, water method, repeatability. repro-ducibility
Water vapor penneance is probably the most commonly used hygrothermal property that characterizes building materials. Almost all insulation material specifications in North America refer to this property asa perfonnance parameter [1], The property originates from the water vapor transport equation:
m"=
-&pgradp"
(I)where
m
v = water vapor transmission rate, kg m-2 S-l8p = water vapor permeability of the medium, kg m-IS-IPa-I Pv
=
water vapor pressure, PaManuscript received 2110/97; accepted forpublication 6/10/97.
ISenior research officer, Building Envelope and Structure, Institute for
Research in Construction, National Research Council of Canada, Ottawa, Ontario, CanadaKIA OR6,
©1998 by the American Societyfor TestingandMaterials
83
The above equation is derived from Pick's law, which states that the density of diffusion flow rate of any substance at a given point in a medium is directly proportional to its concentration gra-dient at that point, at constant temperature, In building physics applications. the water vapor pressure being significantly lower than the atmospheric pressure. water vapor is assumed to foHow the ideal gas equation and hence the concentration is substituted by the vapor pressure in Eq 1.
Traditionally, building physicists have used Eq I directly to measure the water vapor permeabilities of building materials. There has been very little change in the principle of the・クー・イゥュ・ョセ
tal procedure during the past six decades. In 1963. Joy and Wilson [2] thus wrote:
The simplest and most widely used test of the rate of water vapor transmission is the dish or the cup method. The specimen is sealed to the mouth of an impermeable test dish containing water or a desiccant, and placed in a controlled atmosphere. Periodic weighing of the assem-bly detennines when a steady rate of mass loss or gain is attained, and this final rate, continued long enough to ensure its validity, is the test result. ...
ASTM had standardized two dish methods. as early as 1954: E 96 for thin sheets and C 355 (discontinued, replaced by E 96) for materials, such as those used in building construction, tested in a thickness greater than 3 mm. Currently, the ASTM Standard Test Methods for Water Vapor Transmission of Materials E 96-95 is followed in Canada and the U.S. This standard prescribes two test procedures: a desiccant method and
a
water method known respectively as the dry cup and the wet cup methods. In the former, the cup contains a desiccant (usually anhydrous calcium chloride to create an atmosphere of 0% relative humidity) and in the latter, distilled water to maintain 100% relative humidity. In either proce-dure the cup is placed in a chamber maintained at 50% relative humidity at a constant temperature to determine the steady-state water vapor transmission across the test specimen attached to the mouth of the cup.The procedures appear to be simple in principle. But as Tye [3J commented,
MethodE 96,for example, contains estimates of proba-ble levels of uncertainty due to a number of factors. These estimates differ depending on the individual pro-cedure and on the type of the material retarder and its thickness. In general, the maximum errors (worst case) due toacombination of known factors are estimated to be the order of
±
25 to 30% while±
10% is considered,
,
84 JOURNAL OF TESTING AND EVALUATION
to be an acceptable norm. However. in some of the earlier measurements the results indicated that uncertainties of the order of ten times and greater than the worst case were not uncommon.
The method of sealing the specimen to the mouth of the cup has a major influence on the results from the measurements. Also, as explained below, differences in the procedure used by individual laboratories to analyze the data result in differences in the reported values for permeances and permeabilities.
The standard prescribes a procedure for the data analysis. A least-squares regression analysis of the change in mass as a func-tion of time is used to determine the rate of water vapor transmis-sion at the steady state. However, in the current standard, the rate so calculated is assumed to correspond only to the resistance offered by the test specimen. In fact, the experimental setup imposes four vapor resistances [4,5] in series between the content of the cup (the desiccant or distilled water) and the chamber:
1. resistance offered by layer of still air in cup, 2. resistance offered by surface of specimen inside cup, 3. resistance offered by test specimen, and
4. resistance offered by surface of specimen outside cup.
While some of the laboratories make corrections {5] for these resistances, others do not. This results in large differences in the reported values for permeances and permeabilities, especially if the test material is highly permeable.
Yet another type of correction that cannot always be neglected is the buoyancy correction. The duration of one set of measure-ments can be many daysorweeks. The atmospheric pressure may change significantly during such periods. If the test specimen is highly vapor resistant, the changes in mass due to the vapor trans-port may be overshadowed by the apparent gravimetric changes observed.
Another reason for differences in reported values is whether or not the results are corrected for the edge masking details. Wax is recommended for sealing the test specimen to the mouth of the cup. Depending on the size and shape of the cup and the technique of the sealing, various fractions of the surface areas of the test specimens are masked at the edge. This results not only in
a
reduc-tion in the effective test area but also introduces an alternate path for vapor diffusion within the specimen. Hence, the measured water vapor transmission rates should be corrected{2].In practice, differences between 5% and 20% may result from this correction. There is a general consensus that ASTM E 96 and similar meth-ods used elsewhere need a thorough revision with attention paid specifically to specimen assembly, choice of temperature and humidity conditions and the subsequent evaluation and interpreta-tion of the results[3].A task group within the ASTM Cl6 Commit-tee on Thermal Insulation is currently reviewing a draft proposal that addresses some of these issues: an interlaboratory comparison was initiated in 1995 to investigate the influence of various param-eters. The project has now been completed and this paper reports the results.Work Plan for the Interlaboratory Comparison
A set of 60 X 60 em samples of expanded polystyrene boards (",25 mm thick) was prepared at the Institute for Research in Con-struction from a carefully chosen batch of the product. The average density of the material was ",15.8 kg m-3. One or two of these
20,...---,
15 ME
セ セ 10セ
UJ o 5o
1 2 3 4 5 6 7 8 9 10 11 12 13 14TEST SAMPLE NUMBER
FIG.I-Densities of14test samples ofexpanded polystyrene insulation used for the interlaboratory comparison.
samples were sent to IIparticipating laboratories. The distribution of densities of the test samples is shown in Fig. 1.
The work plan shown in Fig. 2 was sent to each participating laboratory. Ten of the participating laboratories completed and reported their measurements according to the work plan. One labo-ratory withdrew from the project.
Results
The freedom allowed by ASTM
E
96 resulted in a variety of experimental parameters to be chosen by the participating laborato-ries. The shape of test specimens. for example, was circular for eight laboratories, square for One and oval for another. The test area varied between45and 650 cm2.The thickness of the still air layer ranged between 6 and 19 mm. The sealing technique and edge masking resulted in corrections between0 and 21 %.All the raw data were forwarded to the Institute for Research in Construction and used for analysis using auniform procedure. One of the primary criteria was that each set of data (time versus mass change) on any test specimen yield a linear correlation coeffi-cient between 0.998 and I to confirm the attainment of steady state. Results from one laboratory failed to attain this and were not included in SUbsequent analysis. All corrections, such as those for the resistances offered by the still air layer in the cup and the surfaces of specimen and that for errors due to edge masking, were made according to the information provided by each laboratory using procedures recommended in the literature [2,4,5]. The mea-sured mass changes were large enough that buoyancy corrections were insignificant and hence unnecessary. The results are listed in Table I.
Averaging of all the data in Table I gives the following values: Water vapor permeability from dry CUp measurements
= (3.1 ± O.5)E-12 kg m-I S-l Pa-L
Water vapor permeability from wet cup measurements
= (3.7 ± 1.3)E-12 kg m-I S-l Pa-L The results for the wet cup measurements from Laboratory 4
KUMARAN ON INTERLABORATORY COMPARISON OF ASTM E96-95
85
I
• Prepare six test specimens from the 60 x 60 em sample(s)I
I
• Measure thickness, area and mass of each specimenI
• Calculate density of each specimenI
f I
• Seal three specimens in'three dry cups
I ·
Seal three speci mens in three wet cups • MeasurelEstimate the thickness of the air • MeasurelEstimate the thickness of the airlaver inside eachCUD laver inside each cup
I f
I
• Equilibrate in chamber
<>Temperature 23±1 °C
<)RH 50±2% <>Constant air flow velocity<3 m s"
I
• MeasurelRecord the following quantities for each eup periodically
<>Date and time
o
Chamber temperatureo
Chamber relative humidityo
Air flow velocity( at a lesser frequency than the rest of the quantities)o
Masso
Barometric pressure• Estimate the following corrections for each cup/each measurement
o
Buoyancyo
Edge masking<)StilJ air thickness
I
• Calculate and report the permeability of each specimen • Report primary data to IRC for further analysis
FIG.2-Work plan.
TABLE I-The permeability, kg m- I s-J Pa-I, ofrhe expanded polystyrene material from nine laboratories.
Dry Cup Wet Cup Dry Cup Wet Cup
Laboratory Results Results Laboratory Results Results
2.54E-12 2.90E-12 6 3.26E-12 2.6IE-12
2.46E-[2 3.14E-12 3.38E-12 2.82E-12
2.2IE-12 2.94E-12 3.29E-12 2.80E-12
2 2.65E-12 3.50E-12 7 3.05£-12 3.53E-[2
2.87E-12 3.46E-12 3.72E-12 3.18E-12
2.68E-12 3.52E-12 3.33E-12 3.4[E-12
3 3.79E-12 4.23E-12 8 3.76E-12 3.30E-12
3.49E-12 3.76E-12 3.53E-12 3.42E-12
3.65E·12 3.65E-12 3.87E-12 3.29E·12
4 2.77E-12 5.69E-12 9 3.24E-[2 3.75E-12
2.73E-12 5-85E-12 3.48E-12 3.97E-12
2.69E·[2 8.92E-12 3.26E-12 3.67E-12
5 2.67E-12 332E-12
2.66E-12 3.29E-12 2.79E·12 2.97E-12
The slandard deviations from both sets of measurements, 15% for the dry cup measurements and 11%for the wet cup measurements, fall well within those obtained from interlaboratory comparisons. For example, in the recently concluded' 'Intercomparison on Mea· surements of Water Vapour Penneability," in which 13 European laboratories participated, measurements on extruded polystyrene and particle board specimens yielded 19% and 21 % deviations from the average value[6].
Significance oftheCorrections
It is important that all applicable corrections be made to all measurements. The procedures for making these corrections are found in the literature and are summarized below.
Buoyancy Correction-Thefollowing equation can be used for buoyancy corrections [7]:
are solely responsible for the large standard deviation for this cate-gory. If these results, based on their relatively large deviations, are considered as outliers, then:
Water vapor permeability from wet cup measurements
= (3.4
±
0.4)E-12 kg m-Ls-J Pa-Iwhere
InI = mass recorded by balance, kg
m2 = mass corrected for buoyancy effect, kg p" = density of air, kg m-3
86 JOURNAL OF TESTING AND EVALUATION
(3)
PI = density of material of balance weights, kg m-3 P,
=
bulk density of test assembly, kg m-3The density of air can be calculated using the ideal gas law for the measured atmospheric pressure and ambient temperature,
Corrections for Resistances Due to Still Air Layer and Specimen Suljace-Ifthe thickness of the stiH air layer is known, the corre-sponding vapor permeance and hence the resistance can be calcu· lated using the foHowing equation for permeability[8].
= 2.306 X 10⁻⁵
Po (_T_)
1.81Sa RvTP 273.15
where
B
a=
permeability of still air, kg m-I 5- 1P.a-1T
=
temperature, KP
=
ambient pressure, PaPo
=
standard atmospheric pressure, Le., 101325 PaRv
=
the ideal gas constant for water, i.e., 461.5JK-I kg-Iof 21% while those from Laboratory 8 have no edge masking correction. The thickness of the still air layer for Laboratory 7 is 21 mm while that for Laboratory 8is 15 mm.
The differences between the numbers in columns
3
and4
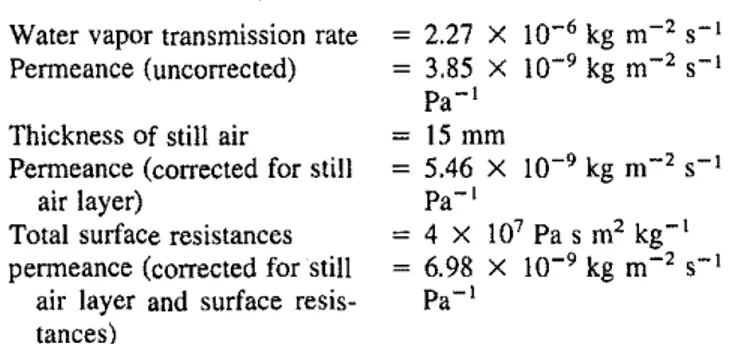
for Laboratory 7 are very large (::=25%) in comparison with theウエ。ョセ dard deviation of11%stated above. Furthermore, the average in column 3, where all applicable corrections are made. is nearly equal to the grand average from all the laboratories and the average from Laboratory 8.This confirms the significance of the correc-tions.For the present test material, the differences between the nUm-bers in columns 4 and 5 are not large. This is not always the case. For example, if a material is highly penneable, the corrections for the additional resistances become significant. This is illustrated below using the results on a specimen of a medium density glass fiber insulation.
Test Results on a Medium Density Glass Fiber Insulation Specimen 2.27 X 10⁻⁶kg m-2 S-I 3.85 X 10⁻⁹kg
m-'
S-I Pa-I 15 mm 5.46 X 10⁻⁹kg m-2 S-I Pa-l 4 X 10' Pas m'
kg-I 6.98 X 10⁻⁹kg m-' S-I Pa-IWater vapor transmission fate Penneance (uncorrected)
Thickness of still air
Penneance (corrected for still air layer)
Total surface resistances penneance (corrected for still
air layer and surface resis-tances)
If the corrections are not made, the errOf in the calculated perme-ance for this test specimen would have been ::=45%.
In the absence of any measured data, the surface resistances may be approximated using Lewis's relation [9]. According to Hansen and Lund [4J, for cup methods that foHow the ASTM Standard, the total surface resistance should be::::::4 X 10⁷Pa s m2kg-I.
Edge Mask Correction-Joyand Wilson [2J have recommended the following equation for the excess water vapor transmission (WVT) due to edge masking:
Percent excess WVT
=
セセエ
10g,C+
e2_(2"I<))
(4) wheret
=
specimen thickness, mb
=
width of masked edge, mS
=
four times test area divided by perimeter, mAs shown by Lackey et a1. [5J, the buoyancy correction is impor-tant where the measured mass changes are in the range of 0 to 100 mg. For the present specimens the changes were in the range of2 to 30gand thus the buoyancy correction was always insignificant. However, other corrections were often significant as showninthe following example.
The results from the wet cup measurements from Laboratories 7 and 8 are used for the calculations and included in Table 2. These results represent the two extremes in terms of the edge masking correction. The results from Laboratory 7 include an excess WVT
TABLE 2-Significance of various corrections for calculating the
permeability, kg m-Js-J Pa-J ,
Corrections Made Laboratory Specimen All Corrections No Correction Only for
No. No. Made Made Resistances
7 1 3.53E-12 4.39E-12 4.50E-12
2 3.t8E-t2 3.97E-12 4.06E-12
3 3.4IE-t2 4.25E-12 435E-12
Average 337E-12 4.20E-12 4.30E-t2
8 1 3.30E-12 3.26E-12 3.30E-12
2 3.42E-12 3.37E-12 3.42E-12
3 3.29E-12 3.24E-12 3.29E-12
Average 3.34E- t2 3.29E-12 3.34E-12
Statistical Analysis of the Data
The results in Table 1 were analyzed according to the ASTM Standard Practice for Conducting an Interlaboratory Study to Determine the Precision of a Test Method (E 691-92). The results are listed in Tables 3, 4, and 5. The symbols have the following meanings:
x
Cell average or the average from one laboratory. kgm-I S-I Pa-I
s = Cell standard deviation, or the standard deviation for
=
one laboratory, kg m-I S-I Pa-1x = Average of the cell averages. kg m-I S-I Pa-l
sx
Standard deviation of the cell averages. kg m-I S-I Pa-Id
=
CeH deviation or the difference (x - セIL kg m-I S-IPa-j
Sr
=
Repeatability standard deviation (within a laboratory),kg m-I S-I Pa-I
SR Reproducibility standard deviation (between
laboratories), kg m-l S-l Pa-l
h Between-laboratory consistency statistic, (-]
k Within-laboratory consistency statistic, [ - ]
The quantities hand k, the between-laboratory and the within-laboratory consistency statistics, in Tables 3 and 4 suggest the following: The results from Laboratory 7 in Table 3 should be treated as marginal, the.k value is very close to the critical value of 2.09. and the results are just acceptable.
aa
JOURNAL OF TESTING AND EVALUATIONCenler for Applied Engineering, Inc. (SI. Pelersburg), The Dow Chemical Company (Granville), Holometrix (Bedford), Mountain Technical Center (Littleton), The Institute for Research in Con-struction, The National Research Council of Canada (Ottawa),2 Pittsburgh Corning Corporation (Pittsburgh) and Styrochem Inter-national, Inc. (Fort Worth), The contribution from Me. John Lackey of the NRCC for the organization of the project deserves special recognition.
References
[1] Genge, G. R.t "Study of Thennal Insulation Standards for Residential
Applications," Report submitted to the Canadian Coordinating Com-mittee for Thermal Insulation Standards and Quality, March 1995, [2J Joy, F. A. and Wilson, A. G., "Standardization of the Dish Method
for Measuring Water Vapor Transmission,"Proceedings afthe
Inter-national Symposium on Humidity and Moisture, Washington, DC. Vol.
4,Chap, 31, 1963,pp.259-270.
2Two separate series of measurements were done at the NRCC.
[3J Tye, R. P., "Relevant Moisture Properties of Building Construction Materials," Chapter 3, Moisture Control in Buildings, Trechsel, H.
R. Ed., ASTM Manual Series: MNL18, 1994,pp. 35-53,
[4] Hansen,K. K. and Lund, H.B., "Cup Method for Determination of Water Vapour Transmission Properties of Building Materials. Sources of Uncertainty in the Method," Proceedings of the 2nd Symposium,
Building Physics in the Nordic Countries, Trondheim, 1990, pp. 291-298,
[5] Lackey,1. C., Marchand,R. G.,and Kumaran,
!"1.
K., "A Logical Extension of the ASTM Standard E96 to Detennme the Dependence of Water Vapor Transmission on Relative Humidity," Insulation Materials: Testing andApplications:3rdVolume, ASTM STP 1320,R. S.Graves andR. R.Zarr, Eds., American Society for Testing and Materials, West Conshohocken, PA, 1997, pp. 454-470.
[6J Galbraith,G. H.,"Intercomparison on Measurements of Water Vapour
Permeability," ISSN 1018·5593, EUR 14349 EN, University of
Strathclyde, Glasgow, United Kingdom, 1993, p. 102.
[7] McGlashan,M. L., Bpィケウゥ」ッセcィ・ュゥ」。ャ Quantities and Units,"Royal Institute of Chemistry Monographs for Teachers, No. 15, 1971, p. 8. [8J Schirmer, R, ZVDI,Beiheft Veifahrenstechnik, 1938, Nr,6, S, 170, [9] Pedersen, C.R.,"Combined Heat and Moisture Transfer in Building Constructions," Ph.D. thesis, Thennal Insulation Laboratory, The Technical University of Denmark, 1990, p. 10.
I;j'" ..